preliminary flo assessment r preliminary flood risk assessment report ...
preliminary flo assessment r preliminary flood risk assessment report ...
preliminary flo assessment r preliminary flood risk assessment report ...

Create successful ePaper yourself
Turn your PDF publications into a flip-book with our unique Google optimized e-Paper software.
Preliminary Flood Risk Assessment<br />
5. FUTURE FLOOD RISK<br />
5.1 Locally Agreed Surface Water Information<br />
The Environment Agency has produced two national datasets<br />
showing predicted surface water <strong>flo</strong>oding:<br />
• Areas Susceptible to Surface Water Flooding (AStSWF)<br />
• Flood Map for Surface Water (FMfSW)<br />
The data shown on both the AStSWF and FMfSW maps for the<br />
Knowsley area was reviewed by representatives of the<br />
Environment Agency, United Utilities and Knowsley Council on<br />
24 th January 2011. It was compared to known, locally agreed<br />
surface water data including the effects of an estimated 1%<br />
rainfall event (an event that has a 1 in 100 chance of happening<br />
in any one year) that occurred on 20 July 2011 and it was<br />
agreed that the FMfSW was more representative of the <strong>flo</strong>od<br />
<strong>risk</strong>. As such, the FMfSW was adopted for use as the map<br />
identifying “locally agreed surface water information”.<br />
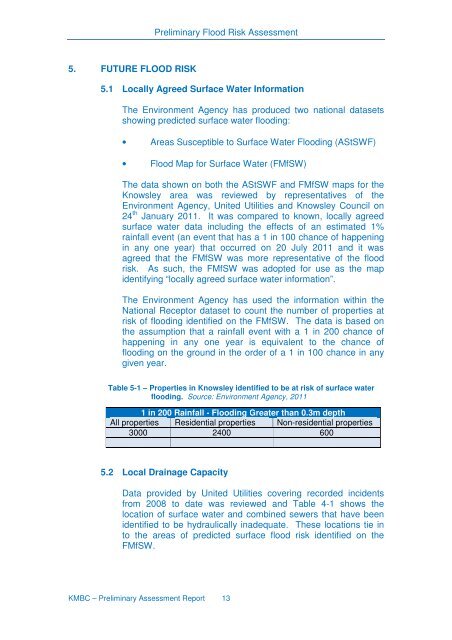
The Environment Agency has used the information within the<br />
National Receptor dataset to count the number of properties at<br />
<strong>risk</strong> of <strong>flo</strong>oding identified on the FMfSW. The data is based on<br />
the assumption that a rainfall event with a 1 in 200 chance of<br />
happening in any one year is equivalent to the chance of<br />
<strong>flo</strong>oding on the ground in the order of a 1 in 100 chance in any<br />
given year.<br />
Table 5-1 – Properties in Knowsley identified to be at <strong>risk</strong> of surface water<br />
<strong>flo</strong>oding. Source: Environment Agency, 2011<br />
1 in 200 Rainfall - Flooding Greater than 0.3m depth<br />
All properties Residential properties Non-residential properties<br />
3000 2400 600<br />
5.2 Local Drainage Capacity<br />
Data provided by United Utilities covering recorded incidents<br />
from 2008 to date was reviewed and Table 4-1 shows the<br />
location of surface water and combined sewers that have been<br />
identified to be hydraulically inadequate. These locations tie in<br />
to the areas of predicted surface <strong>flo</strong>od <strong>risk</strong> identified on the<br />
FMfSW.<br />
KMBC – Preliminary Assessment Report 13