2012 - Krell Institute
2012 - Krell Institute
2012 - Krell Institute

You also want an ePaper? Increase the reach of your titles
YUMPU automatically turns print PDFs into web optimized ePapers that Google loves.
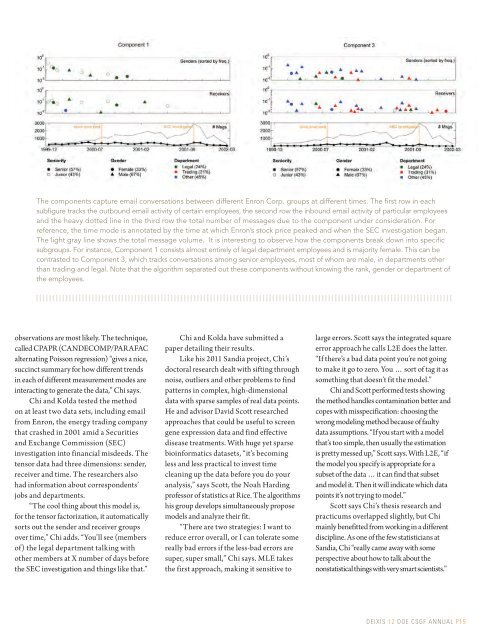
The components capture email conversations between different Enron Corp. groups at different times. The first row in each<br />
subfigure tracks the outbound email activity of certain employees, the second row the inbound email activity of particular employees<br />
and the heavy dotted line in the third row the total number of messages due to the component under consideration. For<br />
reference, the time mode is annotated by the time at which Enron’s stock price peaked and when the SEC investigation began.<br />
The light gray line shows the total message volume. It is interesting to observe how the components break down into specific<br />
subgroups. For instance, Component 1 consists almost entirely of legal department employees and is majority female. This can be<br />
contrasted to Component 3, which tracks conversations among senior employees, most of whom are male, in departments other<br />
than trading and legal. Note that the algorithm separated out these components without knowing the rank, gender or department of<br />
the employees.<br />
observations are most likely. The technique,<br />
called CPAPR (CANDECOMP/PARAFAC<br />
alternating Poisson regression) “gives a nice,<br />
succinct summary for how different trends<br />
in each of different measurement modes are<br />
interacting to generate the data,” Chi says.<br />
Chi and Kolda tested the method<br />
on at least two data sets, including email<br />
from Enron, the energy trading company<br />
that crashed in 2001 amid a Securities<br />
and Exchange Commission (SEC)<br />
investigation into financial misdeeds. The<br />
tensor data had three dimensions: sender,<br />
receiver and time. The researchers also<br />
had information about correspondents’<br />
jobs and departments.<br />
“The cool thing about this model is,<br />
for the tensor factorization, it automatically<br />
sorts out the sender and receiver groups<br />
over time,” Chi adds. “You’ll see (members<br />
of) the legal department talking with<br />
other members at X number of days before<br />
the SEC investigation and things like that.”<br />
Chi and Kolda have submitted a<br />
paper detailing their results.<br />
Like his 2011 Sandia project, Chi’s<br />
doctoral research dealt with sifting through<br />
noise, outliers and other problems to find<br />
patterns in complex, high-dimensional<br />
data with sparse samples of real data points.<br />
He and advisor David Scott researched<br />
approaches that could be useful to screen<br />
gene expression data and find effective<br />
disease treatments. With huge yet sparse<br />
bioinformatics datasets, “it’s becoming<br />
less and less practical to invest time<br />
cleaning up the data before you do your<br />
analysis,” says Scott, the Noah Harding<br />
professor of statistics at Rice. The algorithms<br />
his group develops simultaneously propose<br />
models and analyze their fit.<br />
“There are two strategies: I want to<br />
reduce error overall, or I can tolerate some<br />
really bad errors if the less-bad errors are<br />
super, super small,” Chi says. MLE takes<br />
the first approach, making it sensitive to<br />
large errors. Scott says the integrated square<br />
error approach he calls L2E does the latter.<br />
“If there’s a bad data point you’re not going<br />
to make it go to zero. You … sort of tag it as<br />
something that doesn’t fit the model.”<br />
Chi and Scott performed tests showing<br />
the method handles contamination better and<br />
copes with misspecification: choosing the<br />
wrong modeling method because of faulty<br />
data assumptions. “If you start with a model<br />
that’s too simple, then usually the estimation<br />
is pretty messed up,” Scott says. With L2E, “if<br />
the model you specify is appropriate for a<br />
subset of the data … it can find that subset<br />
and model it. Then it will indicate which data<br />
points it’s not trying to model.”<br />
Scott says Chi’s thesis research and<br />
practicums overlapped slightly, but Chi<br />
mainly benefitted from working in a different<br />
discipline. As one of the few statisticians at<br />
Sandia, Chi “really came away with some<br />
perspective about how to talk about the<br />
nonstatistical things with very smart scientists.”<br />
DEIXIS 12 DOE CSGF ANNUAL P15