KDOT Quick Facts - Kansas Department of Transportation
KDOT Quick Facts - Kansas Department of Transportation
KDOT Quick Facts - Kansas Department of Transportation

You also want an ePaper? Increase the reach of your titles
YUMPU automatically turns print PDFs into web optimized ePapers that Google loves.
<strong>KDOT</strong> <strong>Quick</strong> <strong>Facts</strong><br />
January 2012<br />
* <strong>Kansas</strong> Stats/<br />
Rankings<br />
* CTP<br />
* Personnel<br />
* Revenue<br />
* Taxes<br />
* Accident<br />
Stats
Table <strong>of</strong> Contents<br />
<strong>Kansas</strong> Public Road Miles and Vehicle Miles <strong>of</strong> Travel - Percent by Jurisdiction...........<br />
Travel in Calendar Year 2010................................................................................................<br />
<strong>Kansas</strong> <strong>Transportation</strong> at a Glance - 2010...........................................................................<br />
Comparison <strong>of</strong> Public Road Miles and Population.............................................................<br />
Program Structure.................................................................................................................<br />
T-WORKS ..............................................................................................................................<br />
T-WORKS FY 2011 - 2020.....................................................................................................<br />
T-WORKS Focuses on Jobs, Modes.....................................................................................<br />
T-WORKS Sources <strong>of</strong> Revenue.............................................................................................<br />
CTP Overview as <strong>of</strong> December 1, 2009.................................................................................<br />
<strong>KDOT</strong> - FTE Positions...........................................................................................................<br />
<strong>Kansas</strong> <strong>Department</strong> <strong>of</strong> <strong>Transportation</strong> Fund Sources FY 2012.........................................<br />
<strong>Kansas</strong> <strong>Department</strong> <strong>of</strong> <strong>Transportation</strong> Selected Information............................................<br />
Comparison <strong>of</strong> Sales and Tax use..........................................................................................<br />
Federal/State Gas Tax Comparisons.....................................................................................<br />
Gasoline Tax Rate Comparison.............................................................................................<br />
Diesel Tax Rate Comparison..................................................................................................<br />
<strong>Kansas</strong> Motor Fuel Tax Receipts and Distributions............................................................<br />
<strong>Kansas</strong> Special City and County Highway Fund.................................................................<br />
2010 Accident Stats.................................................................................................................<br />
Helpful Numbers....................................................................................................................<br />
2<br />
3<br />
4<br />
6<br />
7<br />
8<br />
9<br />
10<br />
11<br />
12<br />
13<br />
14<br />
15<br />
16<br />
17<br />
18<br />
19<br />
20<br />
21<br />
22<br />
23
<strong>Kansas</strong> Public Road Miles and Vehicle<br />
Miles <strong>of</strong> Travel - Percent by Jurisdiction<br />
Turnpike = 0.2%<br />
Municipal = 11.3%<br />
Turnpike = 5.2%<br />
Municipal = 28.3%<br />
County/Township = 81.1%<br />
County/Township = 15.3%<br />
*State Highway = 7.4%<br />
140,653 Total<br />
Public Road Miles<br />
2010 * Includes City Connecting Links<br />
2<br />
*State Highway = 51.2%<br />
81,916,438 Total Daily<br />
Vehicle Miles Traveled
Travel in Calendar Year 2010<br />
Center Line Percent Of Daily Vehicle Percent Of<br />
System Miles Total Miles Miles Traveled Total Travel<br />
State Highway System 9,503 6.8 26,747,853 32.6<br />
City Connecting Links 837 0.6 15,210,523 18.6<br />
County/Township 114,120 81.1 12,510,398 15.3<br />
Municipal 15,955 11.3 23,155,176 28.3<br />
Turnpike 238 0.2 4,292,488 5.2<br />
TOTAL 140,653 100.0% 81,916,438 100.0%<br />
Source: <strong>Kansas</strong> <strong>Department</strong> <strong>of</strong> <strong>Transportation</strong>, “Mileage and Travel Tables,” published<br />
September 2011, page1.<br />
3
<strong>Kansas</strong> <strong>Transportation</strong> at a Glance - 2010<br />
Background <strong>of</strong> <strong>Kansas</strong><br />
105 counties, 627 cities, 4 MPOs<br />
140,653 miles <strong>of</strong> public roads<br />
Land Area (sq. Miles) 81,823<br />
Population (2009 Est.) 2,853,118<br />
State Tax Rates (cents/gal.)<br />
Effective July 1, 2002<br />
Gasoline 24<br />
Diesel 26<br />
Gasohol 24<br />
Registered Vehicles<br />
Autos 1,449,484<br />
Pickups & Trucks 700,374<br />
Trailers 149,488<br />
Motorcycles 79,667<br />
Motorized Bikes 7,748<br />
Special Registrations 200,958<br />
RV 11,849<br />
Total 2,599,568<br />
Licensed Drivers 2,024,445<br />
Annual Vehicle Miles 29,899,500<br />
<strong>of</strong> Travel (in 1,000s)<br />
4
<strong>Kansas</strong> <strong>Transportation</strong> at a Glance - 2010<br />
Public Road Miles<br />
Rural 127,675<br />
Urban 12,978<br />
Total 140,653<br />
Accidents and Fatalities<br />
Total Accidents 60,029<br />
Fatal Accidents 376<br />
Fatalities 431<br />
Airports<br />
Public Use 138<br />
Commercial Service 8<br />
Bridges<br />
Structurally Deficient 2,729<br />
Functionally Obsolete 1,846<br />
Non-deficient 20,550<br />
Not Rated 154<br />
Total 25,279<br />
Rail<br />
Total Miles Operated 4,721<br />
Shortline Miles Operated 1,931<br />
Class I Miles Operated 2,790<br />
5
Comparison <strong>of</strong> Public Road Miles<br />
and Population<br />
Public Road Miles<br />
Land<br />
People<br />
State Ranking Miles Area Population Per Mile<br />
Texas 1 310,850 261,226 25,145,561 81<br />
California 2 171,874 155,766 37,253,956 216<br />
<strong>Kansas</strong> 3 *140,753 **81,823 2,853,118 20<br />
Illinois 4 139,577 55,518 12,830,632 92<br />
(Source - 2009 Highway Statistics, 2010 Census Estimates)<br />
* This includes roads under the jurisdiction <strong>of</strong> <strong>KDOT</strong>, KTA and <strong>Kansas</strong> cities<br />
and counties. About 100,000 miles <strong>of</strong> <strong>Kansas</strong> roads are non-paved.<br />
** <strong>Kansas</strong> ranks #15 in land area.<br />
6
Program Structure<br />
<strong>Kansas</strong> <strong>Department</strong> <strong>of</strong> <strong>Transportation</strong><br />
State Highway<br />
Program<br />
Local<br />
<strong>Transportation</strong><br />
Progam<br />
Other Modal<br />
Programs<br />
<strong>Transportation</strong><br />
Revolving Fund<br />
Routine<br />
Maintenance<br />
Preservation<br />
Special<br />
City/County<br />
Highway Fund<br />
Local<br />
Federal Aid<br />
Projects<br />
Aviation<br />
Transit<br />
Modernization<br />
Expansion<br />
Local<br />
Partnership<br />
Program<br />
City<br />
Connecting<br />
Link Payments<br />
Rail<br />
<strong>Transportation</strong><br />
Enhancement<br />
7
FY FY 2011 2011 through FY FY 2020 -- Total Spending<br />
State State Highways Highways - $6 - $6 Billion* Billion* – – Spending on on the state highway system<br />
(Interstate, U.S., U.S., and K routes)<br />
Local<br />
Local<br />
Roads<br />
Roads<br />
- $1.6<br />
- $1.6<br />
Billion*<br />
Billion*<br />
– Spending<br />
– Spending<br />
on<br />
on<br />
city<br />
city<br />
streets<br />
streets<br />
and<br />
and county<br />
county<br />
roads<br />
roads<br />
Modes - $174 Million* – Spending on public transit, aviation, and railroads<br />
Modes - $174 Million* – Spending on public transit, aviation, and railroads<br />
*Estimates do not include federal funds<br />
*Estimates do not include federal funds<br />
8
Estimated State Highway Spending<br />
Preservation - $ 4.2 Billion<br />
- Repair and reconstruction <strong>of</strong> roads and bridges<br />
Modernization and Expansion - $1.8 Billion<br />
*Estimates do not federal funds<br />
- Modernization work includes improvements to<br />
the existing roadway, such as the addition <strong>of</strong> shoulders<br />
- Expansion work is new construction, such as<br />
additional lanes or interchanges<br />
9<br />
FY 2011 through FY 2020 - Total Spending<br />
State Highways - $6 Billion* – Spending on the state highway system<br />
(Interstate, U.S., and K routes)<br />
Local Roads - $1.6 Billion* – Spending on city streets and county roads<br />
Modes - $174 Million* – Spending on public transit, aviation, and railroad
T-WORKS Program Focuses on Jobs,<br />
All Modes <strong>of</strong> <strong>Transportation</strong><br />
T-WORKS will preserve and improve the state’s transportation system and will create tens<br />
<strong>of</strong> thousands <strong>of</strong> jobs. The program includes $2.7 billion in new revenues during the 10-year<br />
plan. The new revenues will come from increased registration fees for heavy trucks and a<br />
sales tax deposit that takes effect in FY 2014. It also provides additional bonding authority for<br />
<strong>KDOT</strong>.<br />
It is estimated that T-WORKS will create or sustain 175,000 jobs over the next 10 years.<br />
The program passed by the Legislature provides 100 percent, or $4.2 billion, <strong>of</strong> the highway<br />
preservation funding recommended, ensuring that every mile <strong>of</strong> <strong>Kansas</strong> highway will see<br />
some preservation work. It also sets aside $1.8 billion in new construction funds.<br />
T-WORKS provides $6 million a year for public transit services, which increases to $11 million<br />
a year in FY 2014, and $3 million a year in aviation funding, which increases to $5 million<br />
in FY 2014, and $5 million a year in rail funding starting in FY 2014. <strong>KDOT</strong> will spend a<br />
minimum <strong>of</strong> $8 million in each county in <strong>Kansas</strong> during the program.<br />
10
New Sources <strong>of</strong> Revenue (in millions)<br />
$100 increase in Heavy Truck<br />
Registration*<br />
$211<br />
0.4% increase in State Sales Tax Deposit** $1,532<br />
$1.6 billion in Bonds Issued $900<br />
Total New Revenue $2,643<br />
* The registration fee increase begins in 2013 and includes heavy duty trucks. It does not include<br />
cars and light-duty pickup trucks, antique cars or motorcycles.<br />
** The increase in the State Sales Tax Deposit begins in FY 2014<br />
11
CTP Overview as <strong>of</strong> December 1, 2009<br />
$5.7 billion - CTP State Highway Program construction cost<br />
$6.6 billion - CTP State Highway Program total cost<br />
(const+CE+Util+RW+PE)<br />
$13.3 billion - Total CTP cost ($6.6 billion, plus $6.7 billion<br />
for other expenditures, including $2.7 billion for Local<br />
<strong>Transportation</strong> Programs, $1.2 billion for Routine<br />
Maintenance and $1.2 billion for Debt Service)<br />
Estimated CTP construction dollars for each District are<br />
below:<br />
District One - $1.7 billion<br />
District Two - $700 million<br />
District Three - $500 million<br />
District Four - $1.0 billion<br />
District Five - $1.0 billion<br />
District Six - $500 million<br />
Statewide - $300 million<br />
12<br />
Comprehensive<br />
<strong>Transportation</strong><br />
Program (1999-2009)
personnel<br />
<strong>Kansas</strong> <strong>Department</strong> <strong>of</strong> <strong>Transportation</strong><br />
FTE Positions<br />
4,652<br />
3,893<br />
3,293<br />
3,304.5<br />
3,247.5<br />
2,916.5<br />
<strong>KDOT</strong> has a history <strong>of</strong> aggressively<br />
managing Full Time Equivalent (FTE)<br />
positions. <strong>KDOT</strong>’s FTE positions<br />
declined by 1,735.5 between FY 1971<br />
and mid-FY 2012. The majority <strong>of</strong> this<br />
reduction (1,281.5) was the result <strong>of</strong><br />
<strong>KDOT</strong>’s net organizational changes;<br />
the other 454 FTE reduction was the<br />
result <strong>of</strong> transfers to other agencies.<br />
1971<br />
1976<br />
1991<br />
1996<br />
2001<br />
2012<br />
Full Time Equivalent (FTE) Positions<br />
13<br />
<strong>KDOT</strong> has 2,916.5 FTE,<br />
approximately 37 percent fewer than<br />
in 1971.
<strong>KDOT</strong><br />
All Funds<br />
Revenue<br />
Sources<br />
FY 2012<br />
$1,485.4 M<br />
31.8%<br />
28.7%<br />
20.6%<br />
12%<br />
4.4%<br />
2%<br />
0.4%<br />
Federal Funds - $472.9M<br />
Motor Fuels Tax - $427M<br />
Sales Tax Deposit - $306.6M<br />
Reg./Lic. Fees - $179M<br />
Local Funds - $65.8M<br />
Other - $28.3M<br />
Interest - $5.9M<br />
14
<strong>Kansas</strong> <strong>Department</strong> <strong>of</strong> <strong>Transportation</strong><br />
Selected Information<br />
<strong>Kansas</strong> <strong>Department</strong> <strong>of</strong> <strong>Transportation</strong><br />
Selected Information<br />
Budget*<br />
FY 2012 FY 2013<br />
Operating Budget 287,632,588 290,243,123<br />
Non-Operating Budget 1,330,259,668 1,106,705,590<br />
Total <strong>KDOT</strong> Budgeted Expenditures 1,617,892.256 1,396,948,713<br />
* As submitted to the Division <strong>of</strong> the Budget in September 2011<br />
(excluding supplemental and enhancement requests)<br />
Positions:<br />
FTE 2,916.50 2,916.50<br />
Non-FTE 51.00 51.00<br />
15
Comparison <strong>of</strong> Sales and Use Tax<br />
2011 Information<br />
Comparison <strong>of</strong> Sales and Use Tax<br />
Sales<br />
Use<br />
<strong>Kansas</strong> 6.300% 6.300%<br />
Nebraska 5.500% 5.500%<br />
Oklahoma 4.500% 4.500%<br />
Missouri 4.225% 4.225%<br />
Colorado 2.900% 2.900%<br />
16<br />
2011 Information<br />
The use tax is applied when goods and services are purchased from outside the<br />
state and imported into the state for use or consumption.<br />
The sales tax is imposed on the purchase price goods and services sold at retail.
Comparison <strong>of</strong> Fuel Taxes and Revenues<br />
Gasoline Diesel<br />
<strong>Kansas</strong> 24.0 ¢/gal. 26.0 ¢/gal.<br />
National Avg. 26.4 ¢/gal. 26.9 ¢/gal.<br />
Regional Avg. 27.5 ¢/gal. 29.3 ¢/gal.<br />
Border States’ Avg. 20.3 ¢/gal. 19.2 ¢/gal.<br />
Annual Yield 1 cent = $13 M 1 cent = $5 M<br />
2011 Information<br />
17
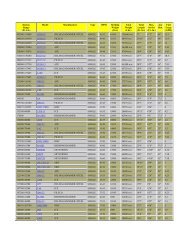
Gasoline Tax Rate Comparison<br />
Gasoline Tax Rate Comparison<br />
Excludes Excludes Environmental and Inspection Fees Fees<br />
Ranked<br />
Rank State Tax Rank State Tax Rank State Tax Rank State Tax<br />
1<br />
2<br />
3<br />
4<br />
Connecticut<br />
New York<br />
Hawaii<br />
California<br />
50.30 ** 14 Pennsylvania 31.20 27 <strong>Kansas</strong> 24.00 40 Mississippi<br />
49.00 ** 15 Maine<br />
31.05 * 28 Dist. <strong>of</strong> Columbia 23.50 41 Alabama<br />
48.10 ** 16 Oregon<br />
47.30 ** 17 Wisconsin<br />
5 Illinois 39.60 ** 18 Georgia<br />
6 Michigan 38.13 19 Ohio<br />
7<br />
8<br />
Washington<br />
9 Indiana 33.00 ** 22 Nebraska<br />
10<br />
11<br />
12<br />
North Carolina<br />
Florida<br />
Nevada<br />
West Virginia<br />
32.50 * 23 Vermont<br />
32.30 24 Idaho<br />
32.20 * 25 Kentucky<br />
31.00<br />
18<br />
29<br />
Maryland<br />
30.90 30 Delaware<br />
29.40 ** 31 North Dakota<br />
28.00 32 Colorado<br />
37.50 20 Minnesota 27.00 33 South Dakota<br />
35.00 * 21 Montana 27.00 34 Arkansas<br />
23.50 42<br />
23.00 * 43<br />
23.00 44<br />
22.00 45<br />
Arizona<br />
New Hampshire<br />
New Mexico<br />
Virginia<br />
18.40<br />
18.00<br />
18.00<br />
18.00<br />
17.90<br />
17.50<br />
22.00 46 Missouri 17.00<br />
21.50 47<br />
Oklahoma<br />
16.00<br />
26.30 * 35 Iowa 21.00 48 South Carolina 16.00<br />
25.60 36 Massachusetts 21.00 ** 49 New Jersey 14.50<br />
25.00 37 Tennessee 21.00 50 Wyoming 13.00<br />
25.00 * 38 Louisiana 20.00 51 Alaska 8.00<br />
13 Rhode Island 32.00 * 26 Utah<br />
24.50 39 Texas<br />
20.00 Average 26.41<br />
* Variable Tax included Source: American Petroleum Institute, 10/1/11<br />
** Sales Tax included Midwest Region per BLS: Illinois, Indiana, Iowa, <strong>Kansas</strong>, Michigan, Minnesota,<br />
Missouri, Nebraska, North Dakota, Ohio, South Dakota and Wisconsin.
Diesel<br />
Diesel<br />
Tax<br />
Tax<br />
Rate<br />
Rate Comparison<br />
Comparison<br />
Excludes Excludes Environmental and Inspection Fees Fees<br />
Ranked<br />
Rank State Tax Rank State Tax Rank State Tax Rank State Tax<br />
1 California 50.00 ** 14 Maine<br />
31.20 * 27 Maryland 24.30 40 Virginia 19.50<br />
2 Hawaii<br />
49.70 ** 15 Wisconsin 30.90 28 Dist. <strong>of</strong> Columbia 23.50 41 Mississippi 18.40<br />
3 Indiana<br />
48.50 ** 16 Oregon<br />
30.00 29 North Dakota 23.00 42 Kentucky 18.10<br />
4 New York 48.10 ** 17 Florida<br />
29.80 * 30 Iowa<br />
22.50 43 Tennessee 18.00<br />
5 Connecticut 46.20 18 Vermont 28.00 31 Arkansas 22.50 44 New Hampshire 18.00<br />
6 Illinois<br />
43.30 ** 19 Ohio<br />
28.00 * 32 South Dakota 22.00 45 Arizona 18.00<br />
7 Pennsylvania 38.10 20 Montana 27.85 33 Delaware 22.00 * 46 New Jersey 17.50<br />
8 Washington 37.50 21 Nevada 27.80 34 New Mexico 21.80 47 Missouri 17.00<br />
9 Michigan 37.13 ** 22 Minnesota 27.50 35 Massachusetts 21.00 * 48 South Carolina 16.00<br />
10 North Carolina 35.05 * 23 Nebraska 26.30 * 36 Alabama 20.90 49 Wyoming 13.00<br />
11 West Virginia 32.10 * 24 <strong>Kansas</strong> 26.00 37 Colorado 20.50 50 Oklahoma 13.00<br />
12 Rhode Island 32.00 * 25 Idaho<br />
25.00 38 Texas<br />
20.00 51 Alaska 8.00<br />
13 Georgia 31.90 ** 26 Utah<br />
24.50 39 Louisiana 20.00 Average 26.88<br />
* Variable Tax included Source: American Petroleum Institute, 10/1/11<br />
** Sales Tax included<br />
19
<strong>Kansas</strong> Motor Fuel Tax Receipts and Distributions<br />
INTERSTATE MOTOR<br />
FUEL (DIESEL)<br />
$0.26/GAL<br />
GASOLINE AND GASOHOL<br />
MOTOR FUEL<br />
$0.24/GA L<br />
MOTOR CARRIER<br />
TRIP PERMITS<br />
$13.00/PERMIT<br />
SPECIAL FUEL<br />
(DIESEL)<br />
$0.26 GAL<br />
LIQUEFIED PETROLEUM<br />
$0.23/GAL<br />
GROSS MOTOR FUEL<br />
TAX RECEIPTS<br />
MOTOR-VEHICLE FUEL<br />
TAX REFUND FUND<br />
ETHYL ALCOHOL<br />
PRODUCER INCENTIVE<br />
FUND, $3.5 million/year<br />
NET MOTOR FUEL<br />
TAX RECEIPTS<br />
* Represents current distribution<br />
rate<br />
SPECIAL CITY/COUNTY<br />
HIGHWAY FUND<br />
(33.63%)*<br />
STATE HIGHWAY FUND<br />
(66.37%)*<br />
COUNTY EQUALIZATION<br />
AND ADJUSTMENT FUND<br />
Source: <strong>Kansas</strong> <strong>Department</strong> <strong>of</strong> <strong>Transportation</strong>,<br />
Office <strong>of</strong> Financial and Investment Management<br />
CITY/COUNTY<br />
PROGRAMS<br />
STATE HIGHWAY<br />
PROGRAMS<br />
20
<strong>Kansas</strong> Special City and County Highway Fund<br />
(Effective July 1, 2000)<br />
Quarterly Distribution <strong>of</strong> Motor Fuel Taxes<br />
And<br />
Semi-Annual Distribution <strong>of</strong> Motor Carrier Property<br />
Taxes<br />
Transfer <strong>of</strong> $625,000<br />
to<br />
County Equalization<br />
and<br />
Adjustment Fund<br />
Cities<br />
43%<br />
Counties<br />
57%<br />
Source: <strong>Kansas</strong> <strong>Department</strong> <strong>of</strong> <strong>Transportation</strong>,<br />
Office <strong>of</strong> Financial and Investment Management<br />
100% Distributed to<br />
Incorporated Cities<br />
Based on Population<br />
$5,000 quarterly to each county, plus<br />
the balance <strong>of</strong> funds distributed using a<br />
weighted ratio <strong>of</strong>:<br />
• Vehicle Registration Fees 44.06%<br />
• Average Daily Vehicle Miles Traveled<br />
(excluding Interstate travel) 44.06%<br />
• Total Road Miles 11.88%<br />
21
2010 <strong>Kansas</strong> Traffic Accident <strong>Facts</strong><br />
<strong>Quick</strong> <strong>Facts</strong><br />
2010 <strong>Quick</strong> Accident <strong>Facts</strong> Stats<br />
ccidents Traffic Accidents<br />
Persons Fatally Persons Injured Fatally in Traffic Injured Accidents in Traffic Accident<br />
Fatal 376 – Fatal<br />
177 – Automobile 177 – Automobile<br />
Injury 13,356 – Injury<br />
99 – Pickup Truck 99 – Pickup Truck<br />
Property 46,297 Damage – Property Only Damage Only<br />
55 – SUV 55 – SUV<br />
60,029<br />
41 – Motorcycles, 41 Motor – Motorcycles, Scooters, Motor and Mopeds Scooters, and Mopeds<br />
17 – Pedestrians 17 – Pedestrians<br />
ns Involved All Persons in Traffic Involved Accidents in Traffic Accidents 19 – Vans 19 – Vans<br />
Fatally Injured 431 – Fatally Injured<br />
22 – Other Occupants 22 – Other and Occupants Pedestrians and Pedestrians<br />
Non-Fatally 18,850 Injured – Non-Fatally Injured<br />
Unharmed 117,593 or – Unknown Unharmed or Unknown<br />
1 – Pedal Cycle 1 – Pedal Cycle<br />
431 – All Occupants 431 – and All Occupants Pedestrians and Pedestrians<br />
All Occupants 136,874 – and All Occupants Pedestriansand Pedestrians<br />
cidents Most Occur: Accidents Occur:<br />
ylight During hours daylight hours 60.6% 60.6%<br />
eather In conditions good weather conditions 82.6% 82.6%<br />
road surface With dry conditions road surface 77.8% conditions 77.8%<br />
k zones Not in work zones 97.4% 97.4%<br />
limits Inside city limits 69.8% 69.8%<br />
road Where is straight the road and is straight 77.8% and 77.8%<br />
level<br />
Top 5 Contributing Top 5 Contributing Circumstances: Circumstances:<br />
Inattention - Inattention - 19.20% 19.20%<br />
General General<br />
Animal wild or Animal domestic wild or domestic 10.9% 10.9%<br />
Right <strong>of</strong> way violation Right <strong>of</strong> way violation10.5%<br />
10.5%<br />
Too fast for conditions Too fast for conditions 8.30% 8.30%<br />
Followed too closely Followed too closely 7.20% 7.20%<br />
Note: 4 out <strong>of</strong> 5 Note: are driver-related<br />
4 out <strong>of</strong> 5 are driver-related<br />
22
Helpful numbers:<br />
<strong>KDOT</strong> website:<br />
www.ksdot.org<br />
<strong>KDOT</strong> Connection (toll-free)<br />
1-877-550-<strong>KDOT</strong> (5368)<br />
Road/Weather info:<br />
In <strong>Kansas</strong>, call 511,<br />
or 1-866-511-<strong>KDOT</strong> (5368)<br />
anywhere in the U.S.<br />
Road/Weather website:<br />
www.kandrive.org<br />
District One Office<br />
Topeka, (785) 296-3881<br />
District Two Office<br />
Salina, (785) 823-3754<br />
District Three Office<br />
Norton, (785) 877-3315<br />
District Four Office<br />
Chanute, (620) 431-1000<br />
District Five Office<br />
Hutchinson, (620) 663-3361<br />
District Six Office<br />
Garden City, (620) 276-3241<br />
<strong>KDOT</strong> <strong>Transportation</strong> Information Office in Topeka - (785) 296-3585<br />
23
<strong>KDOT</strong> is on<br />
Flickr<br />
YouTube<br />
Facebook<br />
‣ <strong>Kansas</strong> <strong>Department</strong> <strong>of</strong> <strong>Transportation</strong><br />
‣ <strong>KDOT</strong>Aviation<br />
‣ DriveSafe<strong>Kansas</strong><br />
Twitter<br />
‣ @<strong>KDOT</strong>HQ<br />
‣ @NE<strong>Kansas</strong><strong>KDOT</strong><br />
‣ @TopekaMetro<strong>KDOT</strong><br />
‣ @Wichita<strong>KDOT</strong><br />
‣ @SE<strong>Kansas</strong><strong>KDOT</strong><br />
‣ @SW<strong>Kansas</strong><strong>KDOT</strong><br />
‣ @NW<strong>Kansas</strong><strong>KDOT</strong><br />
‣ @SC<strong>Kansas</strong><strong>KDOT</strong><br />
‣ @NC<strong>Kansas</strong><strong>KDOT</strong><br />
‣ @KCMetro<strong>KDOT</strong><br />
Notes<br />
24