EANCOM 2002 S4 INVRPT Inventory report message Edition ... - GS1
EANCOM 2002 S4 INVRPT Inventory report message Edition ... - GS1
EANCOM 2002 S4 INVRPT Inventory report message Edition ... - GS1

You also want an ePaper? Increase the reach of your titles
YUMPU automatically turns print PDFs into web optimized ePapers that Google loves.
<strong>EANCOM</strong> ® <strong>EANCOM</strong> <strong>2002</strong> <strong>S4</strong> Part II<br />
<strong>INVRPT</strong> <strong>Inventory</strong> <strong>report</strong> <strong>message</strong><br />
1. Introduction<br />
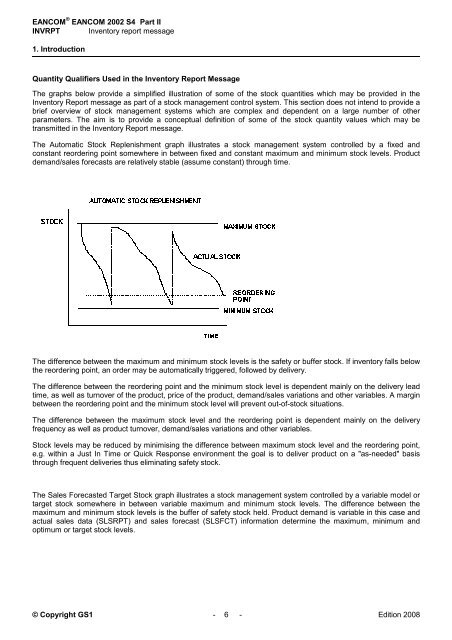
Quantity Qualifiers Used in the <strong>Inventory</strong> Report Message<br />
The graphs below provide a simplified illustration of some of the stock quantities which may be provided in the<br />
<strong>Inventory</strong> Report <strong>message</strong> as part of a stock management control system. This section does not intend to provide a<br />
brief overview of stock management systems which are complex and dependent on a large number of other<br />
parameters. The aim is to provide a conceptual definition of some of the stock quantity values which may be<br />
transmitted in the <strong>Inventory</strong> Report <strong>message</strong>.<br />
The Automatic Stock Replenishment graph illustrates a stock management system controlled by a fixed and<br />
constant reordering point somewhere in between fixed and constant maximum and minimum stock levels. Product<br />
demand/sales forecasts are relatively stable (assume constant) through time.<br />
The difference between the maximum and minimum stock levels is the safety or buffer stock. If inventory falls below<br />
the reordering point, an order may be automatically triggered, followed by delivery.<br />
The difference between the reordering point and the minimum stock level is dependent mainly on the delivery lead<br />
time, as well as turnover of the product, price of the product, demand/sales variations and other variables. A margin<br />
between the reordering point and the minimum stock level will prevent out-of-stock situations.<br />
The difference between the maximum stock level and the reordering point is dependent mainly on the delivery<br />
frequency as well as product turnover, demand/sales variations and other variables.<br />
Stock levels may be reduced by minimising the difference between maximum stock level and the reordering point,<br />
e.g. within a Just In Time or Quick Response environment the goal is to deliver product on a "as-needed" basis<br />
through frequent deliveries thus eliminating safety stock.<br />
The Sales Forecasted Target Stock graph illustrates a stock management system controlled by a variable model or<br />
target stock somewhere in between variable maximum and minimum stock levels. The difference between the<br />
maximum and minimum stock levels is the buffer of safety stock held. Product demand is variable in this case and<br />
actual sales data (SLSRPT) and sales forecast (SLSFCT) information determine the maximum, minimum and<br />
optimum or target stock levels.<br />
© Copyright <strong>GS1</strong> - 6 - <strong>Edition</strong> 2008