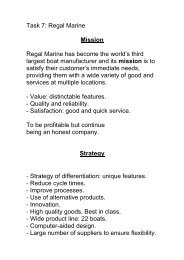
Project presentation A case-study of ZARA Project ... - UPV
Project presentation A case-study of ZARA Project ... - UPV
Project presentation A case-study of ZARA Project ... - UPV

You also want an ePaper? Increase the reach of your titles
YUMPU automatically turns print PDFs into web optimized ePapers that Google loves.
15<br />
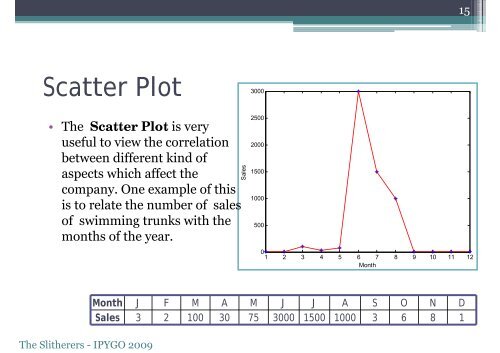
Scatter Plot<br />
3000<br />
• The Scatter Plot is very<br />
useful to view the correlation<br />
between different kind <strong>of</strong><br />
aspects which affect the<br />
company. One example <strong>of</strong> this<br />
is to relate the number <strong>of</strong> sales<br />
<strong>of</strong> swimming trunks with the<br />
months <strong>of</strong> the year.<br />
Sales<br />
2500<br />
2000<br />
1500<br />
1000<br />
500<br />
0<br />
1 2 3 4 5 6 7 8 9 10 11 12<br />
Month<br />
The Slitherers - IPYGO 2009<br />
Month J F M A M J J A S O N D<br />
Sales 3 2 100 30 75 3000 1500 1000 3 6 8 1