Mayavi: Making 3D Data Visualization Reusable - HAL - INRIA
Mayavi: Making 3D Data Visualization Reusable - HAL - INRIA
Mayavi: Making 3D Data Visualization Reusable - HAL - INRIA

Create successful ePaper yourself
Turn your PDF publications into a flip-book with our unique Google optimized e-Paper software.
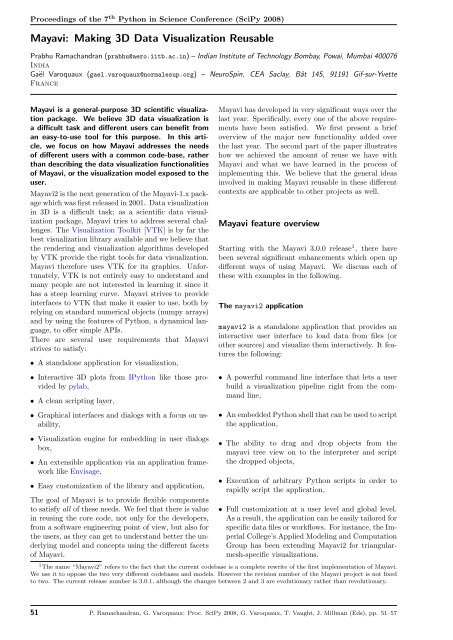
Proceedings of the 7 th Python in Science Conference (SciPy 2008)<br />
<strong>Mayavi</strong>: <strong>Making</strong> <strong>3D</strong> <strong>Data</strong> <strong>Visualization</strong> <strong>Reusable</strong><br />
Prabhu Ramachandran (prabhu@aero.iitb.ac.in) – Indian Institute of Technology Bombay, Powai, Mumbai 400076<br />
India<br />
Gaël Varoquaux (gael.varoquaux@normalesup.org) – NeuroSpin, CEA Saclay, Bât 145, 91191 Gif-sur-Yvette<br />
France<br />
<strong>Mayavi</strong> is a general-purpose <strong>3D</strong> scientific visualization<br />
package. We believe <strong>3D</strong> data visualization is<br />
a difficult task and different users can benefit from<br />
an easy-to-use tool for this purpose. In this article,<br />
we focus on how <strong>Mayavi</strong> addresses the needs<br />
of different users with a common code-base, rather<br />
than describing the data visualization functionalities<br />
of <strong>Mayavi</strong>, or the visualization model exposed to the<br />
user.<br />
<strong>Mayavi</strong>2 is the next generation of the <strong>Mayavi</strong>-1.x package<br />
which was first released in 2001. <strong>Data</strong> visualization<br />
in <strong>3D</strong> is a difficult task; as a scientific data visualization<br />
package, <strong>Mayavi</strong> tries to address several challenges.<br />
The <strong>Visualization</strong> Toolkit [VTK] is by far the<br />
best visualization library available and we believe that<br />
the rendering and visualization algorithms developed<br />
by VTK provide the right tools for data visualization.<br />
<strong>Mayavi</strong> therefore uses VTK for its graphics. Unfortunately,<br />
VTK is not entirely easy to understand and<br />
many people are not interested in learning it since it<br />
has a steep learning curve. <strong>Mayavi</strong> strives to provide<br />
interfaces to VTK that make it easier to use, both by<br />
relying on standard numerical objects (numpy arrays)<br />
and by using the features of Python, a dynamical language,<br />
to offer simple APIs.<br />
There are several user requirements that <strong>Mayavi</strong><br />
strives to satisfy:<br />
• A standalone application for visualization,<br />
• Interactive <strong>3D</strong> plots from IPython like those provided<br />
by pylab,<br />
• A clean scripting layer,<br />
• Graphical interfaces and dialogs with a focus on usability,<br />
• <strong>Visualization</strong> engine for embedding in user dialogs<br />
box,<br />
• An extensible application via an application framework<br />
like Envisage,<br />
• Easy customization of the library and application,<br />
The goal of <strong>Mayavi</strong> is to provide flexible components<br />
to satisfy all of these needs. We feel that there is value<br />
in reusing the core code, not only for the developers,<br />
from a software engineering point of view, but also for<br />
the users, as they can get to understand better the underlying<br />
model and concepts using the different facets<br />
of <strong>Mayavi</strong>.<br />
<strong>Mayavi</strong> has developed in very significant ways over the<br />
last year. Specifically, every one of the above requirements<br />
have been satisfied. We first present a brief<br />
overview of the major new functionality added over<br />
the last year. The second part of the paper illustrates<br />
how we achieved the amount of reuse we have with<br />
<strong>Mayavi</strong> and what we have learned in the process of<br />
implementing this. We believe that the general ideas<br />
involved in making <strong>Mayavi</strong> reusable in these different<br />
contexts are applicable to other projects as well.<br />
<strong>Mayavi</strong> feature overview<br />
Starting with the <strong>Mayavi</strong> 3.0.0 release 1 , there have<br />
been several significant enhancements which open up<br />
different ways of using <strong>Mayavi</strong>. We discuss each of<br />
these with examples in the following.<br />
The mayavi2 application<br />
mayavi2 is a standalone application that provides an<br />
interactive user interface to load data from files (or<br />
other sources) and visualize them interactively. It features<br />
the following:<br />
• A powerful command line interface that lets a user<br />
build a visualization pipeline right from the command<br />
line,<br />
• An embedded Python shell that can be used to script<br />
the application,<br />
• The ability to drag and drop objects from the<br />
mayavi tree view on to the interpreter and script<br />
the dropped objects,<br />
• Execution of arbitrary Python scripts in order to<br />
rapidly script the application,<br />
• Full customization at a user level and global level.<br />
As a result, the application can be easily tailored for<br />
specific data files or workflows. For instance, the Imperial<br />
College’s Applied Modeling and Computation<br />
Group has been extending <strong>Mayavi</strong>2 for triangularmesh-specific<br />
visualizations.<br />
1 The name “<strong>Mayavi</strong>2” refers to the fact that the current codebase is a complete rewrite of the first implementation of <strong>Mayavi</strong>.<br />
We use it to oppose the two very different codebases and models. However the revision number of the <strong>Mayavi</strong> project is not fixed<br />
to two. The current release number is 3.0.1, although the changes between 2 and 3 are evolutionary rather than revolutionary.<br />
51 P. Ramachandran, G. Varoquaux: Proc. SciPy 2008, G. Varoquaux, T. Vaught, J. Millman (Eds), pp. 51–57
<strong>Mayavi</strong>: <strong>Making</strong> <strong>3D</strong> <strong>Data</strong> <strong>Visualization</strong> <strong>Reusable</strong><br />
• Integration into the Envisage application framework.<br />
Users may load any other plugins of<br />
their choice to extend the application. Envisage<br />
is a plugin-based application framework, similar<br />
to Eclipse, for assembling large applications from<br />
loosely-coupled components. The wing-design group<br />
at Airbus, in Bristol, designs wing meshes for simulations<br />
with a large application built with Envisage<br />
using <strong>Mayavi</strong> for the visualization.<br />
Shown below is a visualization made on the mayavi<br />
user interface.<br />
<strong>Visualization</strong> created by the above code example.<br />
mlab also allows users to change the data easily. In<br />
the above example, if the scalars needs to be changed<br />
it may be easily done as follows:<br />
new_scalars = x*x + y*y*0.5 + z*z*3.0<br />
ctr.mlab_source.scalars = new_scalars<br />
Screenshot of the <strong>Mayavi</strong> application.<br />
The mlab interface<br />
<strong>Mayavi</strong>’s mlab interface provides an easy scripting interface<br />
to visualize data. It can be used in scripts, or<br />
interactively from an IPython session in a manner similar<br />
to matplotlib’s pylab interface. mlab features the<br />
following:<br />
• As easy to use as possible.<br />
• Works in the mayavi2 application also.<br />
• Trivial to visualize numpy arrays.<br />
• Full power of mayavi from scripts and UI.<br />
• Allows easy animation of data without having to<br />
recreate the visualization.<br />
A simple example of a visualization with mlab is shown<br />
below:<br />
from enthought.mayavi import mlab<br />
from numpy import ogrid, sin<br />
x, y, z = ogrid[-10:10:100j,<br />
-10:10:100j,<br />
-10:10:100j]<br />
ctr = mlab.contour3d(sin(x*y*z)/(x*y*z))<br />
mlab.show()<br />
In the above, we use the mlab_source attribute to<br />
change the scalars used in the visualization. After setting<br />
the new scalars the visualization is immediately<br />
updated. This allows for powerful and simple animations.<br />
The core features of mlab are all well-documented in<br />
a full reference chapter of the user-guide [M2], with<br />
examples and images.<br />
mlab also exposes the lower-level mayavi API in convenient<br />
functions via the mlab.pipeline module. For<br />
example one could open a data file and visualize it<br />
using the following code:<br />
from enthought.mayavi import mlab<br />
src = mlab.pipeline.open(’test.vtk’)<br />
o = mlab.pipeline.outline(src)<br />
cut = mlab.pipeline.scalar_cut_plane(src)<br />
iso = mlab.pipeline.iso_surface(src)<br />
mlab.show()<br />
mlab thus allows users to very rapidly script <strong>Mayavi</strong>.<br />
Object-oriented interface<br />
<strong>Mayavi</strong> features a simple-to-use, object-oriented interface<br />
for data visualization. The mlab API is built atop<br />
this interface. The central object in <strong>Mayavi</strong> visualizations<br />
is the Engine, which connects the different elements<br />
of the rendering pipeline. The first mlab example<br />
can be re-written using the Engine object directly<br />
as follows:<br />
http://conference.scipy.org/proceedings/SciPy2008/paper_12 52
Proceedings of the 7 th Python in Science Conference (SciPy 2008)<br />
from numpy import ogrid, sin<br />
from enthought.mayavi.core.engine import Engine<br />
from enthought.mayavi.sources.api import ArraySource<br />
from enthought.mayavi.modules.api import IsoSurface<br />
from enthought.pyface.api import GUI<br />
e = Engine()<br />
e.start()<br />
scene = e.new_scene()<br />
x, y, z = ogrid[-10:10:100j,<br />
-10:10:100j,<br />
-10:10:100j]<br />
data = sin(x*y*z)/(x*y*z)<br />
src = ArraySource(scalar_data=data)<br />
e.add_source(src)<br />
e.add_module(IsoSurface())<br />
GUI().start_event_loop()<br />
Clearly mlab is a lot simpler to use. However, the raw<br />
object-oriented API of mayavi is useful in its own right,<br />
for example when using mayavi in an object-oriented<br />
context where one may desire much more explicit control<br />
of the objects and their states.<br />
Embedding a <strong>3D</strong> visualization<br />
One of the most powerful features of <strong>Mayavi</strong> is the<br />
ability to embed it in a user interface dialog. One may<br />
do this either with native Traits user interfaces or in a<br />
native toolkit interface.<br />
Embedding in TraitsUI<br />
The TraitsUI module, used heavily throughout <strong>Mayavi</strong><br />
to build dialogs, provides user-interfaces built on top of<br />
objects, exposing their attributes. The graphical userinterface<br />
is created in a fully descriptive way by associating<br />
object attributes with graphical editors, corresponding<br />
to views in the MVC pattern. The objects<br />
inheriting from the HasTraits class, the workhorse of<br />
Traits, have an embedded observer pattern, and modifying<br />
their attributes can fire callbacks, allowing the<br />
object to be manipulated live, e.g.through a GUI.<br />
TraitsUI is used by many other projects to build graphical,<br />
interactive applications. <strong>Mayavi</strong> can easily be<br />
embedded in a TraitsUI application to be used as a<br />
visualization engine.<br />
<strong>Mayavi</strong> provides an object, the MlabSceneModel, that<br />
exposes the mlab interface as an attribute. This object<br />
can be viewed with a SceneEditor in a TraitsUI<br />
dialog. This lets one use <strong>Mayavi</strong> to create dynamic visualizations<br />
in dialogs. Since we are using Traits, the<br />
core logic of the dialog is implemented in the underlying<br />
object. The modifying_mlab_source.py example<br />
can be found in the <strong>Mayavi</strong> examples and shows<br />
a <strong>3D</strong> line plot parametrized by two integers. Let us<br />
go over the key elements of this example, the reader<br />
should refer to the full example for more details. The<br />
resulting UI offers slider bars to change the values of<br />
the integers, and the visualization is refreshed by the<br />
callbacks.<br />
A <strong>Mayavi</strong> visualization embedded in a custom dialog.<br />
The outline of the code in this example is:<br />
from enthought.tvtk.pyface.scene_editor import \<br />
SceneEditor<br />
from enthought.mayavi.tools.mlab_scene_model \<br />
import MlabSceneModel<br />
from enthought.mayavi.core.pipeline_base \<br />
import PipelineBase<br />
class MyModel(HasTraits):<br />
[...]<br />
scene = Instance(MlabSceneModel, ())<br />
plot = Instance(PipelineBase)<br />
# The view for this object.<br />
view = View(Item(’scene’,<br />
editor=SceneEditor(),<br />
height=500, width=500,<br />
show_label=False),<br />
[...])<br />
def _plot_default(self):<br />
x, y, z, t = curve(self.n_merid, self.n_long)<br />
return self.scene.mlab.plot3d(x, y, z, t)<br />
@on_trait_change(’n_merid,n_long’)<br />
def update_plot(self):<br />
x, y, z, t = curve(self.n_merid, self.n_long)<br />
self.plot.mlab_source.set(x=x, y=y,<br />
z=z, scalars=t)<br />
The method update_plot is called when the n_merid<br />
or n_long attributes are modified, for instance through<br />
the UI. The mlab_source attribute of the plot object is<br />
used to modify the existing <strong>3D</strong> plot without rebuilding<br />
it.<br />
It is to be noted that the full power of the <strong>Mayavi</strong> library<br />
is available to the user in these dialogs. This is<br />
an extremely powerful feature.<br />
53 http://conference.scipy.org/proceedings/SciPy2008/paper_12
<strong>Mayavi</strong>: <strong>Making</strong> <strong>3D</strong> <strong>Data</strong> <strong>Visualization</strong> <strong>Reusable</strong><br />
Embedding mayavi in a wxPython application<br />
Since TraitsUI provides a wxPython backend, it is very<br />
easy to embed <strong>Mayavi</strong> in a wxPython application. The<br />
previous TraitsUI code example may be embedded in<br />
a wxPython application:<br />
import wx<br />
from mlab_model import MyModel<br />
class MainWindow(wx.Frame):<br />
def __init__(self, parent, id):<br />
wx.Frame.__init__(self, parent, id,<br />
’<strong>Mayavi</strong> in Wx’)<br />
self.mayavi = MyModel()<br />
self.control = self.mayavi.edit_traits(<br />
parent=self,<br />
kind=’subpanel’).control<br />
self.Show(True)<br />
app = wx.PySimpleApp()<br />
frame = MainWindow(None, wx.ID_ANY)<br />
app.MainLoop()<br />
Thus, mayavi is easy to embed in an existing application<br />
not based on traits. Currently traits supports<br />
both wxPython and Qt as backends. Since two toolkits<br />
are already supported, it is certainly possible to<br />
support<br />
more, although that will involve a fair amount of work.<br />
<strong>Mayavi</strong> in envisage applications<br />
Envisage is an application framework that allows developers<br />
to create extensible applications. These applications<br />
are created by putting together a set of plugins.<br />
<strong>Mayavi</strong>2 provides plugins to offer data visualization<br />
services in Envisage applications. The mayavi2<br />
application is itself an Envisage application demonstrating<br />
the features of such an extensible application<br />
framework by assembling the <strong>Mayavi</strong> visualization engine<br />
with a Python interactive shell, logging and preference<br />
mechanisms, and a docked-window that manages<br />
layout each provided as Envisage plugins.<br />
Customization of mayavi<br />
<strong>Mayavi</strong> provides a convenient mechanism for users to<br />
contribute new sources, filters and modules. This may<br />
be done:<br />
• at a global, system-wide level via a site_mayavi.py<br />
placed anywhere on Python’s sys.path,<br />
• at a local, user level by placing a user_mayavi.py<br />
in the users ~/.mayavi2/ directory.<br />
In either of these, a user may register new sources, filters,<br />
or modules with <strong>Mayavi</strong>’s central registry. The<br />
user may also define a get_plugins function that returns<br />
any plugins that the mayavi2 application should<br />
load. Thus, the <strong>Mayavi</strong> library and application are<br />
easily customizable.<br />
Headless usage<br />
<strong>Mayavi</strong> also features a convenient way to create offscreen<br />
animations, so long as the user has a recent<br />
enough version of VTK (5.2 and above). This allows<br />
users to create animations of their data. Consider the<br />
following simple script:<br />
n_step = 36<br />
scene = mlab.gcf()<br />
camera = scene.camera<br />
da = 360.0/n_step<br />
for i in range(n_step):<br />
camera.azimuth(da)<br />
scene.reset_zoom()<br />
scene.render()<br />
mlab.savefig(’anim%02d.png’ % i, size=(600,600))<br />
This script rotates the camera about its azimuth and<br />
saves each such view to a new PNG file. Let this script<br />
be saved as movie.py. If the user has another script<br />
to create the visualization (for example consider the<br />
standard streamline.py example) we may run these<br />
to provide an offscreen rendering like so:<br />
$ mayavi2 -x streamline.py -x movie.py -o<br />
The -o option (or --offscreen) turns on the offscreen<br />
rendering. This renders the images without creating a<br />
user interface for interaction but saves the PNG images.<br />
The PNG images can be combined to create a<br />
movie using other tools.<br />
We have reviewed the various usage patterns that<br />
<strong>Mayavi</strong> provides. We believe that this variety of use<br />
cases and entry points makes <strong>Mayavi</strong> a truly reusable<br />
<strong>3D</strong> visualization tool. <strong>Mayavi</strong> is not domain specific<br />
and may be used in any suitable context. In the<br />
next section we discuss the secrets behind this level<br />
of reusability and the lessons we learned.<br />
Secrets and Lessons learned<br />
The techniques and pattern used to achieve maximal<br />
reusability in <strong>Mayavi</strong> are an application of general<br />
software architecture good practices. We will not review<br />
software architecture, although it is often underexposed<br />
to scientific developers, an introduction to the<br />
field can be found in [Gar94]. An important pattern in<br />
<strong>Mayavi</strong>’s design is the separation between model and<br />
view, an introduction to which can be found in [Fow].<br />
There are several contributing technical reasons which<br />
make <strong>Mayavi</strong> reusable:<br />
• Layered functionality,<br />
• Large degree of separation of UI from model,<br />
• Object-oriented architecture and API,<br />
• Scriptable from ground up,<br />
• The use of Traits.<br />
We look at these aspects in some detail in the following.<br />
http://conference.scipy.org/proceedings/SciPy2008/paper_12 54
Proceedings of the 7 th Python in Science Conference (SciPy 2008)<br />
Layered functionality<br />
<strong>Mayavi</strong> is built atop layers of functionality, and a variety<br />
of different modules:<br />
Object-oriented architecture<br />
The object-oriented API of <strong>Mayavi</strong> and its architecture<br />
helps significantly separate functionality while enabling<br />
a great deal of code reuse.<br />
• The abstraction layers of <strong>Mayavi</strong> allows for a significant<br />
amount of flexibility and reuse. This is because<br />
the abstraction hides various details of the internals<br />
of TVTK or VTK. As an example, the <strong>Mayavi</strong><br />
Engine is the object central to a <strong>Mayavi</strong> visualization<br />
that manages and encapsulates the entirety of<br />
the <strong>Mayavi</strong> visualization pipeline.<br />
Tool stack employed by <strong>Mayavi</strong>.<br />
At the lowest level of this hierarchy are VTK, numpy<br />
and Traits. The TVTK package marries VTK, numpy<br />
and Traits into one coherent package. This gives us<br />
the power of VTK with a very Pythonic API. TVTK<br />
is the backbone of <strong>Mayavi</strong>. Traits optionally depends<br />
on either wxPython or Qt4 to provide a user interface.<br />
The core <strong>Mayavi</strong> engine uses TVTK and Traits. The<br />
mayavi2 application and the mlab API use the <strong>Mayavi</strong><br />
core engine to provide data visualization. The mayavi2<br />
application additionally uses Envisage to provide a<br />
plugin-based extensible application.<br />
Using Traits in the object model<br />
The use of Traits provides us with a very significant<br />
number of advantages:<br />
• A very powerful object model,<br />
• Inversion of control and reactive/event-based programming:<br />
<strong>Mayavi</strong> and TVTK objects come with<br />
pre-wired callbacks which allow for easy creation of<br />
interactive applications,<br />
• Ability to create/extend many <strong>Mayavi</strong> engines is invaluable<br />
and is the key to much of its reusability.<br />
• All of <strong>Mayavi</strong>’s menus (on the application as well<br />
as right-click menus) are automatically generated.<br />
Similarly, the bulk of the mlab.pipeline interface<br />
is auto-generated. Python’s ability to generate code<br />
dynamically is a big win here.<br />
• Abstraction of menu generation based on simple<br />
metadata allows for a large degree of simplification<br />
and reuse.<br />
• The use of Envisage for the mayavi2 application<br />
forces us to concentrate on a reusable object model.<br />
Using envisage makes our application extensible.<br />
The Engine object is not just a core object for the programming<br />
model, its functionality can also be exposed<br />
via a UI where required. This UI allows one to edit the<br />
properties of any object in the visualization pipeline as<br />
well as remove or add objects. Thus we can provide a<br />
powerful and consistent UI while minimizing duplication<br />
of efforts, both in code and design.<br />
• Forces a separation of UI/view from object model,<br />
• Easy and free UIs:<br />
– Automatic user interfaces for wxPython and Qt4.<br />
– UI and scripting are well connected. This means<br />
that the UI automatically updates if the underlying<br />
model changes and this is automatically wired<br />
up with traits,<br />
– No need to write toolkit-specific code.<br />
Traits allows programmers to think in very different<br />
ways and be much more efficient. It makes a significant<br />
difference to the library and allows us to completely<br />
focus on the object model.<br />
On the downsides, we note that automatically generated<br />
UIs are not very pretty. Traits provides methods<br />
to customize the UI to look better but it still isn’t perfect.<br />
The layout of traits UI is also not perfect but is<br />
being improved.<br />
Dialog controlling the Engine: The different visualization<br />
objects are represented in the tree view. The<br />
objects can be edited by double-clicking nodes and<br />
can be added using the toolbar or via a right-click.<br />
In summary, we believe that <strong>Mayavi</strong> is reusable because<br />
we were able to concentrate on producing a<br />
powerful object model that interfaces naturally with<br />
numpy. This is largely due to the use of Traits, TVTK<br />
and Envisage which force us to build a clean, scriptable<br />
object model that is Pythonic. The use of traits allows<br />
us to concentrate on building the object model without<br />
worrying about the view (UI). Envisage allows us<br />
to focus again on the object model without worrying<br />
too much about the need to create the application itself.<br />
We feel that, when used as a visualization engine,<br />
55 http://conference.scipy.org/proceedings/SciPy2008/paper_12
<strong>Mayavi</strong>: <strong>Making</strong> <strong>3D</strong> <strong>Data</strong> <strong>Visualization</strong> <strong>Reusable</strong><br />
<strong>Mayavi</strong> provides more than a conventional library, as<br />
it provides an extensible set of reusable dialogs that<br />
allow users to configure the visualization.<br />
<strong>Mayavi</strong> still has room for improvement. Specifically<br />
we are looking to improve the following:<br />
• More separation of view-related code from the object<br />
model,<br />
• Better and more testing,<br />
• More documentation,<br />
• Improved persistence mechanisms,<br />
• More polished UI.<br />
Conclusions<br />
<strong>Mayavi</strong> is a general-purpose, highly-reusable, <strong>3D</strong> visualization<br />
tool. In this paper we demonstrated its<br />
reusable nature with specific examples. We also elaborated<br />
the reasons that we think make it so reusable.<br />
We believe that these general principles are capable<br />
of being applied to any project that requires the use<br />
of a user interface. There are only a few key lessons:<br />
focus on the object model, make it clean, scriptable<br />
and reusable; in addition, use test-driven development.<br />
Our technological choices (Traits, Envisage) allow us<br />
to carry out this methodology.<br />
References<br />
[VTK] W. Schroeder, K. Martin, W. Lorensen, “The <strong>Visualization</strong><br />
Toolkit”, Kitware, 4th edition, 2006.<br />
[M2] P. Ramachandran, G. Varoquaux, “<strong>Mayavi</strong>2<br />
User Guide”, http://code.enthought.com/<br />
projects/mayavi/docs/development/mayavi/<br />
[Gar94]<br />
html/<br />
D. Garlan, M. Shaw, “An Introduction to Software<br />
Architecture”, in “Advances in Software Engineering<br />
and Knowledge Engineering”, Volume<br />
I, eds V.Ambriola, G.Tortora, World Scientific<br />
Publishing Company, New Jersey, 1993, http:<br />
//www.cs.cmu.edu/afs/cs/project/able/ftp/<br />
intro_softarch/intro_softarch.pdf<br />
[Fow] M. Fowler http://www.martinfowler.com/<br />
eaaDev/uiArchs.html<br />
http://conference.scipy.org/proceedings/SciPy2008/paper_12 56