2003 Statistics - Campus Compact
2003 Statistics - Campus Compact
2003 Statistics - Campus Compact

You also want an ePaper? Increase the reach of your titles
YUMPU automatically turns print PDFs into web optimized ePapers that Google loves.
• A. Institutional Information<br />
• B. Student Service <strong>Statistics</strong><br />
• C. Administration of Service Projects and Programs<br />
• D. Scope of Service-Learning Support and Infrastructure<br />
• E. <strong>Campus</strong> Support for Community Service<br />
• F. Service-Learning Development and Institutionalization<br />
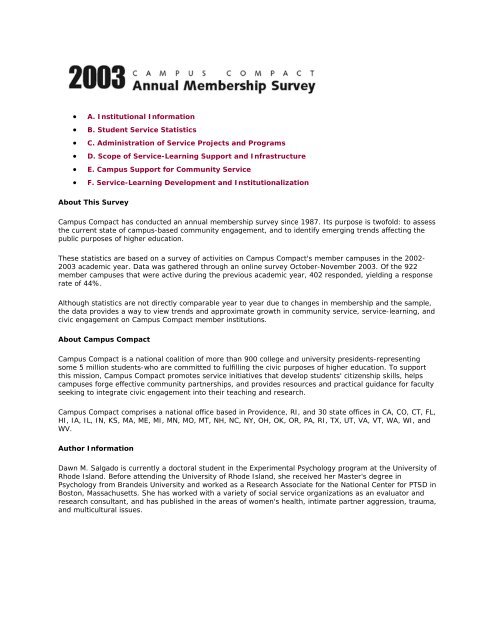
About This Survey<br />
<strong>Campus</strong> <strong>Compact</strong> has conducted an annual membership survey since 1987. Its purpose is twofold: to assess<br />
the current state of campus-based community engagement, and to identify emerging trends affecting the<br />
public purposes of higher education.<br />
These statistics are based on a survey of activities on <strong>Campus</strong> <strong>Compact</strong>'s member campuses in the 2002-<br />
<strong>2003</strong> academic year. Data was gathered through an online survey October-November <strong>2003</strong>. Of the 922<br />
member campuses that were active during the previous academic year, 402 responded, yielding a response<br />
rate of 44%.<br />
Although statistics are not directly comparable year to year due to changes in membership and the sample,<br />
the data provides a way to view trends and approximate growth in community service, service-learning, and<br />
civic engagement on <strong>Campus</strong> <strong>Compact</strong> member institutions.<br />
About <strong>Campus</strong> <strong>Compact</strong><br />
<strong>Campus</strong> <strong>Compact</strong> is a national coalition of more than 900 college and university presidents-representing<br />
some 5 million students-who are committed to fulfilling the civic purposes of higher education. To support<br />
this mission, <strong>Campus</strong> <strong>Compact</strong> promotes service initiatives that develop students' citizenship skills, helps<br />
campuses forge effective community partnerships, and provides resources and practical guidance for faculty<br />
seeking to integrate civic engagement into their teaching and research.<br />
<strong>Campus</strong> <strong>Compact</strong> comprises a national office based in Providence, RI, and 30 state offices in CA, CO, CT, FL,<br />
HI, IA, IL, IN, KS, MA, ME, MI, MN, MO, MT, NH, NC, NY, OH, OK, OR, PA, RI, TX, UT, VA, VT, WA, WI, and<br />
WV.<br />
Author Information<br />
Dawn M. Salgado is currently a doctoral student in the Experimental Psychology program at the University of<br />
Rhode Island. Before attending the University of Rhode Island, she received her Master's degree in<br />
Psychology from Brandeis University and worked as a Research Associate for the National Center for PTSD in<br />
Boston, Massachusetts. She has worked with a variety of social service organizations as an evaluator and<br />
research consultant, and has published in the areas of women's health, intimate partner aggression, trauma,<br />
and multicultural issues.
B. Community Service <strong>Statistics</strong><br />
Member institutions were asked a variety of questions about student service involvement. 30% of member<br />
institutions have developed a comprehensive inventory of all community service activities. These estimates<br />
are similar to last year, where 31% of schools reported having a comprehensive inventory.<br />
Similarly, respondents were asked to report whether their member institution measured the impact of<br />
service-learning and/or community service programs on the local community and its constituents. Of the<br />
297 respondents (74% of the total sample), 39% reported that their institution measured impact.<br />
For the 222 (55%) respondents that provided information on the gender of students involved in service<br />
activities, the average number of females and males was calculated. The majority of the students<br />
participating in service activities were female (64%), while 35% were male. The race and ethnicity of<br />
participating students were Caucasian (71%) followed by African American (10%), Hispanic (7%), Asian<br />
American (7%), and Native American (2%). For respondents who indicated "other," many responses<br />
included students that were Hawaiian/Pacific Islander, biracial, or multiracial.<br />
Respondents were also asked to provide the total number of students involved in ongoing service, one-time<br />
service, and overall service. As shown below, the average percent of students involved in any type of service<br />
project has steadily increased.<br />
Students Involved Service (Average)<br />
2001 2002 <strong>2003</strong><br />
30% 33% 36%<br />
Of the total 402 respondents, 272 (68%) supplied information as to whether the number of students<br />
participating in service had increased in the previous year. In 2002, 82% of respondents reported an<br />
increase in the number of students participating. In <strong>2003</strong>, 89% of respondents reported an increase in the<br />
number of students participating in service activities.<br />
Percent Increase in Student Involvement in Service Over the Past Year
0-10% 61<br />
11-25% 26<br />
26-50% 8<br />
50% or more 5<br />
The most common types of service programs that were offered at member institutions in the 2002-<strong>2003</strong><br />
academic year included work-study (90%), discipline-based service-learning courses (81%), non-profit<br />
internships (71%), and freshman orientation (61%)<br />
The table provided below indicates that there has been a steady increase in certain programs offered by<br />
member institutions. These include graduate school service, freshman orientation, work-study, and<br />
Capstone Courses.<br />
Programs at Member Institutions (2000-<strong>2003</strong>)<br />
2000 2001 2002 <strong>2003</strong><br />
Work-Study 83% 76% 70% 90%<br />
Discipline-based Service-Learning Courses n/a n/a n/a 81<br />
Non-profit internships n/a n/a n/a 71<br />
Freshman Orientation 56 53 47 63
Residence Hall Based 48 52 41 61<br />
Alternative Breaks 60 59 49 60<br />
Government Internships 27 29 28 43<br />
International Service 34 26 32 43<br />
Summer Programs 32 32 32 43<br />
Capstone Courses 18 24 25 36<br />
Alumni Projects 25 28 24 30<br />
Graduate School Service 14 12 19 24<br />
Other 29 26 41 21<br />
The most popular issues for service projects were tutoring (94%), mentoring (89%), health (84%),<br />
environment (84%), housing/homelessness (84%), and hunger (82%). The least popular service projects<br />
were legal aid (27%), conflict resolution (34%), and immigration issues (44%).
Partnerships with K-12 schools<br />
Of the 331 (82%) respondents who provided this information, the majority of member institutions (93%)<br />
reported having an existing partnership with K-12 schools (compared to 88% in 2002, a 6% increase). Of<br />
those that did have existing partnerships, the average number across all member institutions ranged from 1<br />
to 400 partnerships with an average of 18 partnerships per institution. Of those, an average of 10<br />
partnerships were with elementary schools (ranging from 1 to 125), 5 partnerships with middle schools<br />
(ranging from 1 to 87), and 6 partnerships with high schools (ranging from 1 to 113).<br />
Partnerships with K-12 Schools<br />
Mean<br />
Number of K-12 Partnerships 18.1<br />
with elementary schools 9.7
with middle schools 5.1<br />
with high schools 5.7<br />
Partnerships with faith-based organizations<br />
69% of member institutions reported having an existing partnership with a faith-based organization. Of<br />
those that had an existing partnership with faith-based organizations, the number of partnerships ranged<br />
from 1 to 750 with an average of 12 partnerships across all institutions that provided this information (189<br />
of the 215 respondents).
C. Administration of Service Projects and Programs<br />
To determine the structure and administration of service-related offices on campus, respondents were asked<br />
to provide information as to whether their campus had a community service and/or service-learning office.<br />
Of those that responded (363 of 402, or 90%), the vast majority of institutions have both a community<br />
service (70% compared to 74% in 2002) and service-learning (67%) office.<br />
Since it is possible that community service and the service-learning offices are located in the same space<br />
and may serve both functions, respondents were also asked to report whether these offices were the same.<br />
When both offices existed at the institution, 72% reported that they were the same office (compared to 69%<br />
in 2002). Data from these items were combined to compute the percent of member institutions that have a<br />
community service and/or a service-learning office. Of the 363 institutions (90% of the total 402), 83%<br />
reported having a community service office and/or a service-learning office.<br />
The total annual budgets for both offices are generally comparable (shown below). Both the community<br />
service office and the service-learning office budgets tend to be less than $20,000 (44% and 46%,<br />
respectively). In addition, respondents reported 17% of community service offices have an endowment, an<br />
increase from the previous year (15%). This year's survey also asked respondents to report whether their<br />
separate service-learning office received an endowment, with results indicating that approximately 9% had<br />
(this number increases to 14% when considering if the CSO and the SLO share offices and tasks).<br />
In looking at the number of staff working in the community service office and the service-learning office, the<br />
highest numbers of individuals at either office are volunteer positions held by students (average of 15.17<br />
and 9.49, respectively). There are approximately 2 full- and 2 part-time professional staff at both the<br />
community service office and the service-learning office.<br />
Community<br />
Service Office<br />
Mean<br />
Service-<br />
Learning Office<br />
Mean<br />
Full-time professional staff 2.1 2.2<br />
Part-time professional staff 1.7 1.5<br />
Paid student positions 5.0 5.1<br />
Volunteer student positions 15.2 9.5<br />
Work-study positions 7.5 4.3
VISTAs 1.3 1.4<br />
Other positions 2.0 1.6<br />
In addition to the types of offices, respondents were also asked to provide information as to whether their<br />
institution had a Community Service Director (CSD) and Service-Learning Director (SLD). Of the 353<br />
respondents, 73% reported having a CSD. To determine the percent of CSDs in institutions that had<br />
community service offices, this information was partialled out indicating that for those institutions that had a<br />
community service office, 94% had a CSD in <strong>2003</strong> (similar to 94% in 2002). For SLDs, 76% of institutions<br />
reported having one. Of the 363 institutions (90% of the total 402), 80% reported having a CSD and/or a<br />
SLD.<br />
Respondents were also asked to provide information to whom the Community Service Directors (CSDs) and<br />
Service-Learning Directors (SLDs) directly reported. While Community Service Directors are more likely to<br />
report to the Student Affairs Director or Dean as compared to the other individuals, Service-Learning<br />
Directors are equally likely to report to either Student Affairs Director or Dean and the Chief Academic<br />
Officer (26% and 22%, respectively). For those reporting that the CSDs and SLDs reported to other<br />
individuals, many of the responses included reporting to the <strong>Campus</strong> Ministry as well as executive directors<br />
from various centers (e.g., student services and civic engagement, public service).<br />
Direct Reporting Lines<br />
Community<br />
Service Director<br />
Mean<br />
Service-<br />
Learning<br />
Director<br />
Mean<br />
Student Affairs Director or Dean 49% 26%<br />
Chief Academic Officer 6 22<br />
Dean of College 8 13<br />
Faculty Chair 1 5<br />
Career Services Director 5 4<br />
President 2 3<br />
Chaplain 4 1<br />
Other 26 27<br />
As shown below Community Service and Service-Learning Directors tended to be full-time (61% as<br />
compared to 46%, respectively) or half-time (16% versus 21%, respectively).
The Community Service and Service-Learning Directors education levels varied. While the majority of both<br />
groups tended to have Master's degrees (54% and 51%, respectively), respondents reported that Service-<br />
Learning Directors were generally more likely to have a Ph.D. or equivalent (28% compared to 15%) while<br />
Community Service Directors were more likely to have Bachelor's degrees (29% versus 20%).<br />
The annual salaries of Community Service Directors and Service-Learning Directors were also somewhat<br />
different. 38% of Community Service Directors, as compared to 52% of Service-Learning Directors, had an<br />
annual salary above $40,000. These differential amounts are most likely related to the employment status<br />
of the director as well as the individual’s education level.
America Reads, America Counts, and Federal Work-Study<br />
Approximately 60% of member institutions maintain an America Reads program and approximately 27%<br />
report maintaining an America Counts program.<br />
The majority of institutions (96%) have over the current federal mandate of 7% of Federal Work-Study<br />
funds being devoted to community service. Institutions were also asked to identify what office administers<br />
the community service portion of the Federal Work-Study funds (shown in the figure below). Of the 336<br />
respondents who reported this information (84% of 402), the majority of institutions reported that workstudy<br />
funds are handled by Financial Aid Office (49% as compared to 41% in 2002), a partnership between<br />
the Financial Aid Office and the Community Service Office (20% as compared to 12% in 2002), a<br />
partnership between the Career planning/Student Employment Office (14% as compared to 7% in 2002),<br />
the Community Service office exclusively (7% as compared to 8% in 2002), or some other office/partnership<br />
(10% compared to 6% in 2002).
D. Scope of Service-Learning Support and Infrastructure<br />
Respondents were asked to supply specific information about the extent to which service-learning courses<br />
were offered at their institutions. Of the 344 respondents that supplied this information, 88% reported that<br />
their campus offered service-learning courses on their campuses.<br />
Results indicate that an average of 24 faculty per institution taught service-learning courses in the 2002-<br />
<strong>2003</strong> academic year.<br />
Institutions were asked to rate the degree to which they thought that faculty involvement in service-learning<br />
had increased over the past three years. Of the 324 respondents (81%), 25% of institutions said there had<br />
been a significant increase (i.e., 10% or more) in faculty involvement in service-learning over the past three<br />
years, 49% said there had been a slight increase (a few additional faculty each year), 25% described the<br />
trend as consistent with previous years, and 2% said faculty involvement had decreased over the past three<br />
years.<br />
The departments most likely to offer service-learning courses were Education (69%), Sociology (56%),<br />
Psychology (55%), English (55%), Communications (46%), and Business/Accounting (46%).<br />
Departments Offering Service-Learning Courses<br />
1 Education 69<br />
2 Sociology 56<br />
3 English 55<br />
4 Psychology 55<br />
5 Business/Accounting 46<br />
6 Communications 46<br />
7 Health/Health Related 45<br />
8 Politics/Government 43<br />
9 Social Work 38<br />
10 Biology 37<br />
11 Nursing 37<br />
12 Foreign Language 34<br />
13 Fine Arts/Performing Arts 30<br />
14 History 29<br />
15 Interdisciplinary Courses 29<br />
16 Anthropology/Cultural Studies 27<br />
17 Women's Studies 27<br />
18 Natural Sciences 25<br />
19 Computer Science 22<br />
20 Physical Education 22
21 Religion 21<br />
22 Philosophy 19<br />
23 Economics 18<br />
24 Music 17<br />
25 Chemistry 16<br />
26 Counseling 15<br />
27 Hispanic/Latino Studies 15<br />
28 Engineering 13<br />
29 Information Systems 12<br />
30 Medical/Pre-Medical 12<br />
31 Recreation/Parks 12<br />
32 Urban Studies 12<br />
33 Law/Pre-Law 10<br />
34 African-American Studies 8<br />
35 American Studies 8<br />
36 Architecture 8<br />
37 Asian Studies 6<br />
38 Technical 6<br />
39 Physics 5<br />
40 Native American Studies 2<br />
<strong>Campus</strong> support for service-learning can range from student level mechanisms (i.e. academic credit given<br />
for service-learning) to more administrative mechanisms (i.e. reporting of service-learning in campus<br />
publications). Three hundred and sixty one schools (90%) provided information on campus support for<br />
service-learning. The table below presents the percentages for <strong>2003</strong>, as well as trends for the previous two<br />
years. As shown, these rates have remained generally stable over time.<br />
<strong>Campus</strong> Support for Service Learning<br />
2001 2002 <strong>2003</strong><br />
Academic credit given for service learning 72% 59% 69%<br />
Service-learning incorporated into departments 45 35 47<br />
Service-learning reported consistently in campus<br />
publications<br />
46 31 34<br />
Service-learning incorporated into majors 34 27 32<br />
Service-learning incorporated into curriculum 26 19 25
Honors program linked to service learning 23 18 19<br />
Service-learning courses required for graduation 10 7 9<br />
Other n/a n/a 10<br />
In addition to providing information on general campus support for service-learning, schools were asked to<br />
provide information on mechanisms by which the campus provides support for faculty involvement in<br />
service-learning. Three hundred schools (75%) provided information on this question.<br />
As indicated in the table below, there was increased faculty involvement in service-learning by providing<br />
faculty development, faculty workshops, and curriculum models and syllabi.<br />
<strong>Campus</strong> Support for Faculty Involvement in Service Learning<br />
2001 2002 <strong>2003</strong><br />
Faculty workshops offered 64% 48% 76%<br />
Curriculum models and syllabi available 70 55 74<br />
Materials available to assist faculty in reflection and 73 55 70
assessment<br />
Provides faculty development n/a 45 67<br />
Faculty encouraged to go to service learning conference 64 30 60<br />
Service-learning discussed in faculty orientation 39 32 52<br />
Faculty provided with grants to support curriculum<br />
redesign<br />
53 36 51<br />
Service awards for faculty 32 25 39<br />
Service-learning considered in tenure and promotion<br />
evaluation<br />
Students trained to support faculty in service-learning<br />
courses<br />
19 15 27<br />
n/a 20 24<br />
Community orientation provided for new faculty 16 16 16<br />
Sabbaticals available for service learning 14 8 13
E. <strong>Campus</strong> Support for Community Service<br />
Schools were asked to provide information on the manner in which their campuses supported student<br />
involvement in community service. 58% of schools indicated that their institution provides a formal process<br />
for students to reflect on or evaluate their experiences with community service.<br />
As shown below, respondents are reporting either stable or increasing support for student involvement in<br />
community service. Results indicate student efforts being supported by faculty and administration has<br />
increased substantially from last year (69% to 80%, an increase of 79% from 2002). This is also the case<br />
with increased numbers of service awards being offered to students (60% to 72%) and service being<br />
considered in scholarships process (47% to 58%).<br />
<strong>Campus</strong> Support for Student Involvement in Community Service<br />
2001 2002 <strong>2003</strong><br />
Student efforts supported by faculty and administration 81% 69% 80%
Service awards for students 74 60 72<br />
Service considered in scholarships 48 47 58<br />
Institution manages service placements liability 50 41 49<br />
Community service offered as extra credit option 46 44 45<br />
Transportation to service sites available 45 37 44<br />
Service considered in admission process 25 21 27<br />
Courses on volunteerism offered 28 26 20<br />
Service work recorded on co-curricular transcripts 20 15 16<br />
Service certificate program n/a 5 10<br />
Service work recorded on formal transcripts 10 10 9<br />
Formal graduation requirement related to service 12 7 8<br />
Loan forgiveness for students entering public service 2 3 3<br />
Community service offered as a major n/a n/a 2<br />
Community service offered as a minor n/a n/a 2<br />
Other 18 18 12<br />
In addition to being asked to provide broad information on campus support for community service, schools<br />
were also asked to describe the president's involvement in community service.
The table below indicates the ways in which presidential involvement has changed over recent years. In<br />
comparing the percentages in <strong>2003</strong> to 2002, all presidential involvement activities have increased.<br />
Presidential Involvement with Community Service<br />
2000 2001 2002 <strong>2003</strong><br />
Is active in civil affairs 73% 62% 58% 78%<br />
Speaks or writes publicly on service 66 65 55 71<br />
Provides fiscal support 66 58 49 64<br />
Provides leadership at local level 67 56 39 43<br />
Provides leadership at state level 47 45 29 36<br />
Solicits foundation or other support 35 29 28 32<br />
Attends service conferences 25 24 18 25<br />
Provides leadership at national level 31 26 15 19<br />
Host service conferences 17 18 16 17
Teaches service learning 2 2 1 2<br />
Other n/a n/a n/a 8<br />
Service-learning projects often serve a wide range of populations. Three hundred and forty seven (86%)<br />
schools provided information on the types of populations served by their service-learning programs. As<br />
shown below, a larger percent of member institutions report having projects that serve low-income persons<br />
(95%), elementary (95%), and the elderly (85%).
F. Service-Learning Development and Institutionalization<br />
To see how various factors contributed to faculty decisions on whether to incorporate service-learning in<br />
coursework, we asked survey respondents to rate the factors shown below on a 1 to 5 scale, where 1 is not<br />
very important and 5 is very important. The table presents the mean scores for each factor.<br />
The factors seen as most important to faculty decisions was facilitating student learning of course content<br />
(mean of 4.5), followed by promoting engaged learning (mean of 4.4), and development of students’ critical<br />
thinking skills (mean of 4.4). For those indicating other important reasons to incorporate service-learning<br />
into courses, many responses included wanting to improve students’ writing skills (through journal<br />
assignments), students’ ability to work collaboratively with others, as well as in order to meet the needs of<br />
the community.<br />
Also provided in the table below are the average scores across each item for 2001 and 2002. Across all<br />
years, the importance of certain factors such as facilitating learning of course content, promoting engaged<br />
learning, developing critical thinking skills, and extending and exposing students to diversity issues<br />
remained the most important across these years.<br />
Importance of Various Factors in Faculty Decisions to Incorporate Service-Learning in Courses<br />
(Mean Scores)<br />
2001 2002 <strong>2003</strong><br />
Facilitate learning of course content n/a 4.3 4.5<br />
Promote active/engaged learning 4.3 4.3 4.4<br />
Develop critical thinking skills 4.2 4.2 4.4<br />
Exposure to diversity issue 3.9 4.0 4.1<br />
Development of civic skills and responsibilities 3.8 3.8 3.9<br />
Encourage engagement in social action 3.6 3.7 3.8<br />
Addressing campus responsibility to community 3.6 3.6 3.7<br />
Facilitate career exploration 3.5 3.5 3.6<br />
Encourage moral development 3.4 3.4 3.6<br />
Extend faith/religious principles 2.3 2.2 2.1<br />
Other 4.3 4.2 4.2<br />
Member institutions felt that faculty time and pressures of faculty teaching loads (86%) were important,<br />
followed by a lack of funding (62%) and a lack of common understanding of the concepts and models of<br />
service-learning (58%). For those that indicated there were other obstacles to the institutionalization of<br />
service-learning on their campuses (16%), many responses included a lack of consideration in performance<br />
reviews (e.g., for tenure, promotion) for faculty and a lack of incentive/benefits to faculty that do offer<br />
service-learning courses.<br />
Most Significant <strong>Campus</strong> Obstacles to Extension of Service-Learning<br />
2001 2002 <strong>2003</strong><br />
1 Faculty Time Pressure 87 64 86
2 Lack of SL Funding 51 42 62<br />
3 Lack of Common Understanding 62 44 58<br />
4 Lack of Funding for Work 36 32 49<br />
5 Faculty Resistance 48 36 42<br />
6 Lack of Confidence 42 30 39<br />
7 Lack of Dept Support 48 18 39<br />
8 Lack of Faculty Interest 37 28 37<br />
9 Concern over SL Effects 29 n/a 32<br />
10 Lack of Institutional Support 41 27 29<br />
11 Poor Coordination 23 n/a 24<br />
12 Unsupportive Department Chair n/a 16 18<br />
13 Lack of Institutional Fit 16 10 11<br />
14 Unsupportive CEO n/a 8 10<br />
15 Unsupportive President 9 8 6