Annual Report 2012 - Thecorporatelibrary.net
Annual Report 2012 - Thecorporatelibrary.net
Annual Report 2012 - Thecorporatelibrary.net

You also want an ePaper? Increase the reach of your titles
YUMPU automatically turns print PDFs into web optimized ePapers that Google loves.
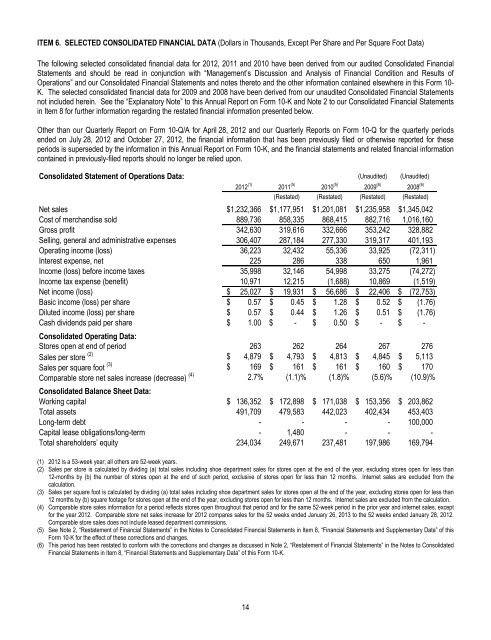
ITEM 6. SELECTED CONSOLIDATED FINANCIAL DATA (Dollars in Thousands, Except Per Share and Per Square Foot Data)<br />
The following selected consolidated financial data for <strong>2012</strong>, 2011 and 2010 have been derived from our audited Consolidated Financial<br />
Statements and should be read in conjunction with “Management’s Discussion and Analysis of Financial Condition and Results of<br />
Operations” and our Consolidated Financial Statements and notes thereto and the other information contained elsewhere in this Form 10-<br />
K. The selected consolidated financial data for 2009 and 2008 have been derived from our unaudited Consolidated Financial Statements<br />
not included herein. See the “Explanatory Note” to this <strong>Annual</strong> <strong>Report</strong> on Form 10-K and Note 2 to our Consolidated Financial Statements<br />
in Item 8 for further information regarding the restated financial information presented below.<br />
Other than our Quarterly <strong>Report</strong> on Form 10-Q/A for April 28, <strong>2012</strong> and our Quarterly <strong>Report</strong>s on Form 10-Q for the quarterly periods<br />
ended on July 28, <strong>2012</strong> and October 27, <strong>2012</strong>, the financial information that has been previously filed or otherwise reported for these<br />
periods is superseded by the information in this <strong>Annual</strong> <strong>Report</strong> on Form 10-K, and the financial statements and related financial information<br />
contained in previously-filed reports should no longer be relied upon.<br />
Consolidated Statement of Operations Data: (Unaudited) (Unaudited)<br />
<strong>2012</strong> (1) 2011 (5) 2010 (5) 2009 (6) 2008 (6)<br />
(Restated) (Restated) (Restated) (Restated)<br />
Net sales $ 1,232,366 $ 1,177,951 $ 1,201,081 $ 1,235,958 $ 1,345,042<br />
Cost of merchandise sold 889,736 858,335 868,415 882,716 1,016,160<br />
Gross profit 342,630 319,616 332,666 353,242 328,882<br />
Selling, general and administrative expenses 306,407 287,184 277,330 319,317 401,193<br />
Operating income (loss) 36,223 32,432 55,336 33,925 (72,311)<br />
Interest expense, <strong>net</strong> 225 286 338 650 1,961<br />
Income (loss) before income taxes 35,998 32,146 54,998 33,275 (74,272)<br />
Income tax expense (benefit) 10,971 12,215 (1,688) 10,869 (1,519)<br />
Net income (loss) $ 25,027 $ 19,931 $ 56,686 $ 22,406 $ (72,753)<br />
Basic income (loss) per share $ 0.57 $ 0.45 $ 1.28 $ 0.52 $ (1.76)<br />
Diluted income (loss) per share $ 0.57 $ 0.44 $ 1.26 $ 0.51 $ (1.76)<br />
Cash dividends paid per share $ 1.00 $ - $ 0.50 $ - $ -<br />
Consolidated Operating Data:<br />
Stores open at end of period 263 262 264 267 276<br />
Sales per store (2) $ 4,879 $ 4,793 $ 4,813 $ 4,845 $ 5,113<br />
Sales per square foot (3) $ 169 $ 161 $ 161 $ 160 $ 170<br />
Comparable store <strong>net</strong> sales increase (decrease) (4) 2.7% (1.1)% (1.8)% (5.6)% (10.9)%<br />
Consolidated Balance Sheet Data:<br />
Working capital $ 136,352 $ 172,898 $ 171,038 $ 153,356 $ 203,862<br />
Total assets 491,709 479,583 442,023 402,434 453,403<br />
Long-term debt - - - - 100,000<br />
Capital lease obligations/long-term - 1,480 - - -<br />
Total shareholders’ equity 234,034 249,671 237,481 197,986 169,794<br />
(1) <strong>2012</strong> is a 53-week year; all others are 52-week years.<br />
(2) Sales per store is calculated by dividing (a) total sales including shoe department sales for stores open at the end of the year, excluding stores open for less than<br />
12-months by (b) the number of stores open at the end of such period, exclusive of stores open for less than 12 months. Inter<strong>net</strong> sales are excluded from the<br />
calculation.<br />
(3) Sales per square foot is calculated by dividing (a) total sales including shoe department sales for stores open at the end of the year, excluding stores open for less than<br />
12 months by (b) square footage for stores open at the end of the year, excluding stores open for less than 12 months. Inter<strong>net</strong> sales are excluded from the calculation.<br />
(4) Comparable store sales information for a period reflects stores open throughout that period and for the same 52-week period in the prior year and inter<strong>net</strong> sales, except<br />
for the year <strong>2012</strong>. Comparable store <strong>net</strong> sales increase for <strong>2012</strong> compares sales for the 52 weeks ended January 26, 2013 to the 52 weeks ended January 28, <strong>2012</strong>.<br />
Comparable store sales does not include leased department commissions.<br />
(5) See Note 2, “Restatement of Financial Statements” in the Notes to Consolidated Financial Statements in Item 8, “Financial Statements and Supplementary Data” of this<br />
Form 10-K for the effect of these corrections and changes.<br />
(6) This period has been restated to conform with the corrections and changes as discussed in Note 2, “Restatement of Financial Statements” in the Notes to Consolidated<br />
Financial Statements in Item 8, “Financial Statements and Supplementary Data” of this Form 10-K.<br />
14