Annual Report 2012 - Thecorporatelibrary.net
Annual Report 2012 - Thecorporatelibrary.net
Annual Report 2012 - Thecorporatelibrary.net

Create successful ePaper yourself
Turn your PDF publications into a flip-book with our unique Google optimized e-Paper software.
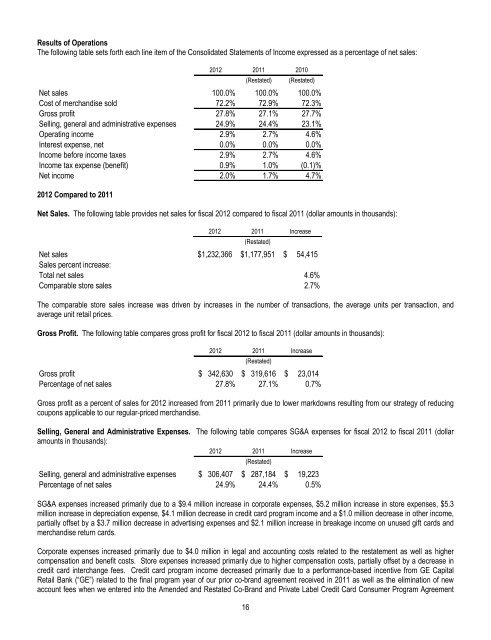
Results of Operations<br />
The following table sets forth each line item of the Consolidated Statements of Income expressed as a percentage of <strong>net</strong> sales:<br />
<strong>2012</strong> 2011 2010<br />
(Restated) (Restated)<br />
Net sales 100.0% 100.0% 100.0%<br />
Cost of merchandise sold 72.2% 72.9% 72.3%<br />
Gross profit 27.8% 27.1% 27.7%<br />
Selling, general and administrative expenses 24.9% 24.4% 23.1%<br />
Operating income 2.9% 2.7% 4.6%<br />
Interest expense, <strong>net</strong> 0.0% 0.0% 0.0%<br />
Income before income taxes 2.9% 2.7% 4.6%<br />
Income tax expense (benefit) 0.9% 1.0% (0.1)%<br />
Net income 2.0% 1.7% 4.7%<br />
<strong>2012</strong> Compared to 2011<br />
Net Sales. The following table provides <strong>net</strong> sales for fiscal <strong>2012</strong> compared to fiscal 2011 (dollar amounts in thousands):<br />
<strong>2012</strong> 2011 Increase<br />
(Restated)<br />
Net sales $ 1,232,366 $ 1,177,951 $ 54,415<br />
Sales percent increase:<br />
Total <strong>net</strong> sales 4.6%<br />
Comparable store sales 2.7%<br />
The comparable store sales increase was driven by increases in the number of transactions, the average units per transaction, and<br />
average unit retail prices.<br />
Gross Profit. The following table compares gross profit for fiscal <strong>2012</strong> to fiscal 2011 (dollar amounts in thousands):<br />
<strong>2012</strong> 2011 Increase<br />
(Restated)<br />
Gross profit $ 342,630 $ 319,616 $ 23,014<br />
Percentage of <strong>net</strong> sales 27.8% 27.1% 0.7%<br />
Gross profit as a percent of sales for <strong>2012</strong> increased from 2011 primarily due to lower markdowns resulting from our strategy of reducing<br />
coupons applicable to our regular-priced merchandise.<br />
Selling, General and Administrative Expenses. The following table compares SG&A expenses for fiscal <strong>2012</strong> to fiscal 2011 (dollar<br />
amounts in thousands):<br />
<strong>2012</strong> 2011 Increase<br />
(Restated)<br />
Selling, general and administrative expenses $ 306,407 $ 287,184 $ 19,223<br />
Percentage of <strong>net</strong> sales 24.9% 24.4% 0.5%<br />
SG&A expenses increased primarily due to a $9.4 million increase in corporate expenses, $5.2 million increase in store expenses, $5.3<br />
million increase in depreciation expense, $4.1 million decrease in credit card program income and a $1.0 million decrease in other income,<br />
partially offset by a $3.7 million decrease in advertising expenses and $2.1 million increase in breakage income on unused gift cards and<br />
merchandise return cards.<br />
Corporate expenses increased primarily due to $4.0 million in legal and accounting costs related to the restatement as well as higher<br />
compensation and benefit costs. Store expenses increased primarily due to higher compensation costs, partially offset by a decrease in<br />
credit card interchange fees. Credit card program income decreased primarily due to a performance-based incentive from GE Capital<br />
Retail Bank (“GE”) related to the final program year of our prior co-brand agreement received in 2011 as well as the elimination of new<br />
account fees when we entered into the Amended and Restated Co-Brand and Private Label Credit Card Consumer Program Agreement<br />
16