Photoquadrats on a Transect - cosee now
Photoquadrats on a Transect - cosee now
Photoquadrats on a Transect - cosee now

Create successful ePaper yourself
Turn your PDF publications into a flip-book with our unique Google optimized e-Paper software.
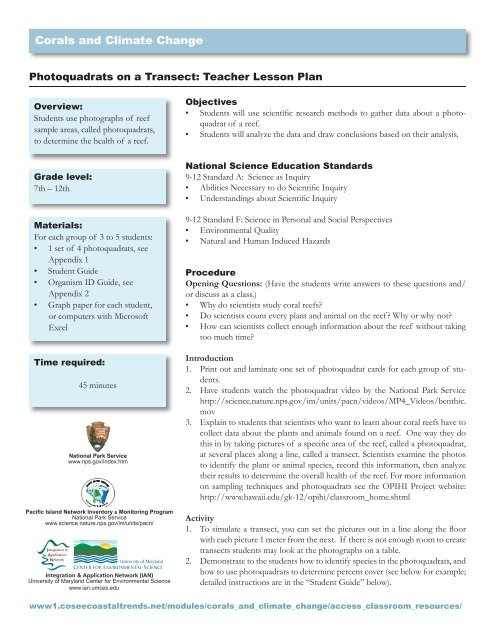
Corals and Climate Change<br />
<str<strong>on</strong>g>Photoquadrats</str<strong>on</strong>g> <strong>on</strong> a <strong>Transect</strong>: Teacher Less<strong>on</strong> Plan<br />
Overview:<br />
Students use photographs of reef<br />
sample areas, called photoquadrats,<br />
to determine the health of a reef.<br />
Objectives<br />
• Students will use scientific research methods to gather data about a photoquadrat<br />
of a reef.<br />
• Students will analyze the data and draw c<strong>on</strong>clusi<strong>on</strong>s based <strong>on</strong> their analysis.<br />
Grade level:<br />
7th – 12th<br />
Materials:<br />
For each group of 3 to 5 students:<br />
• 1 set of 4 photoquadrats, see<br />
Appendix 1<br />
• Student Guide<br />
• Organism ID Guide, see<br />
Appendix 2<br />
• Graph paper for each student,<br />
or computers with Microsoft<br />
Excel<br />
Time required:<br />
45 minutes<br />
Nati<strong>on</strong>al Park Service<br />
www.nps.gov/index.htm<br />
Pacific Island Network Inventory & M<strong>on</strong>itoring Program<br />
Nati<strong>on</strong>al Park Service<br />
www.science.nature.nps.gov/im/units/pacn/<br />
Integrati<strong>on</strong> & Applicati<strong>on</strong> Network (IAN)<br />
University of Maryland Center for Envir<strong>on</strong>mental Science<br />
www.ian.umces.edu<br />
Nati<strong>on</strong>al Science Educati<strong>on</strong> Standards<br />
9-12 Standard A: Science as Inquiry<br />
• Abilities Necessary to do Scientific Inquiry<br />
• Understandings about Scientific Inquiry<br />
9-12 Standard F: Science in Pers<strong>on</strong>al and Social Perspectives<br />
• Envir<strong>on</strong>mental Quality<br />
• Natural and Human Induced Hazards<br />
Procedure<br />
Opening Questi<strong>on</strong>s: (Have the students write answers to these questi<strong>on</strong>s and/<br />
or discuss as a class.)<br />
• Why do scientists study coral reefs?<br />
• Do scientists count every plant and animal <strong>on</strong> the reef? Why or why not?<br />
• How can scientists collect enough informati<strong>on</strong> about the reef without taking<br />
too much time?<br />
Introducti<strong>on</strong><br />
1. Print out and laminate <strong>on</strong>e set of photoquadrat cards for each group of students.<br />
2. Have students watch the photoquadrat video by the Nati<strong>on</strong>al Park Service<br />
http://science.nature.nps.gov/im/units/pacn/videos/MP4_Videos/benthic.<br />
mov<br />
3. Explain to students that scientists who want to learn about coral reefs have to<br />
collect data about the plants and animals found <strong>on</strong> a reef. One way they do<br />
this in by taking pictures of a specific area of the reef, called a photoquadrat,<br />
at several places al<strong>on</strong>g a line, called a transect. Scientists examine the photos<br />
to identify the plant or animal species, record this informati<strong>on</strong>, then analyze<br />
their results to determine the overall health of the reef. For more informati<strong>on</strong><br />
<strong>on</strong> sampling techniques and photoquadrats see the OPIHI Project website:<br />
http://www.hawaii.edu/gk-12/opihi/classroom_home.shtml<br />
Activity<br />
1. To simulate a transect, you can set the pictures out in a line al<strong>on</strong>g the floor<br />
with each picture 1 meter from the next. If there is not enough room to create<br />
transects students may look at the photographs <strong>on</strong> a table.<br />
2. Dem<strong>on</strong>strate to the students how to identify species in the photoquadrats, and<br />
how to use photoquadrats to determine percent cover (see below for example;<br />
detailed instructi<strong>on</strong>s are in the “Student Guide” below).<br />
www1.<strong>cosee</strong>coastaltrends.net/modules/corals_and_climate_change/access_classroom_resources/
Corals and Climate Change<br />
<str<strong>on</strong>g>Photoquadrats</str<strong>on</strong>g> <strong>on</strong> a <strong>Transect</strong>: Teacher Less<strong>on</strong> Plan<br />
3. Divide students into groups and give each group a set of photos and data sheets.<br />
4. Have students work together to first identify what species appears under each dot. Each time a species is observed under a<br />
dot, students should put a check mark in the “Times Observed” column of their data sheet.<br />
5. Next, students should add up the check marks for each species and record this number in the “Total Times Observed” column,<br />
then calculate % cover for each species by dividing the total times observed by the total number of dots in the photo<br />
and multiplying by 100.<br />
6. The students should then total the percent cover of live coral points (those c<strong>on</strong>taining any living coral) and dead coral points<br />
(those c<strong>on</strong>taining dead coral or dead coral covered with algae) for each photoquadrat.<br />
7. Have students answer the analysis and c<strong>on</strong>clusi<strong>on</strong> questi<strong>on</strong>s listed in the “Student Guide” below.<br />
Graphing<br />
1. Have students make a data table displaying total live percent cover in each photoquadrat.<br />
2. Next have students make a bar graph displaying percent live cover in each photoquadrat, making sure to number and label<br />
the X and Y axes and title the graph.<br />
3. Have students answer the c<strong>on</strong>clusi<strong>on</strong> questi<strong>on</strong>s listed in the “Student Guide” below.<br />
Example<br />
Species<br />
Times observed<br />
Total<br />
times observed<br />
Percent cover<br />
(total times<br />
observed÷total dots<br />
× 100)<br />
Antler coral √√√√√√√ 7 7/24 x 100=29%<br />
Cauliflower coral √√√√ 4 4/24 x 100=17%<br />
Lobe coral √√ 2 2/24 x 100=8%<br />
Blue soft coral 0 0 0%<br />
Turf algae 0 0 0%<br />
Encrusting algae 0 0 0%<br />
Dead coral √√√√√√√√√√ 11 10/24 x 100=46%<br />
Percent live cover 13 13/24 x 100=54%<br />
Percent dead<br />
cover<br />
11 11/24 x 100=46%<br />
Photoquadrat # % Live<br />
Cover<br />
1 80<br />
2 60<br />
3 70<br />
4 80<br />
www1.<strong>cosee</strong>coastaltrends.net/modules/corals_and_climate_change/access_classroom_resources/
Corals and Climate Change<br />
<str<strong>on</strong>g>Photoquadrats</str<strong>on</strong>g> <strong>on</strong> a <strong>Transect</strong>: Student Guide<br />
When scientists want to learn about the health of a coral reef, they have to collect data <strong>on</strong> the plants and animals found <strong>on</strong> a<br />
reef. One way to do this in by taking pictures of a specific area of the reef, called a photoquadrat, at several places al<strong>on</strong>g a line,<br />
called a transect. Scientists examine the pictures to identify the plant or animal species, record this informati<strong>on</strong>, and interpret<br />
their findings to estimate the overall health of the reef. In this exercise, you will use the photoquadrat technique to learn about<br />
the health of a Hawaiian coral reef.<br />
Step 1: Identify the Species<br />
Each photoquadrat photo c<strong>on</strong>tains an overlying grid of dots. First, identify the coral, algae or invertebrate under each dot. Use<br />
the Coral Reef Identificati<strong>on</strong> Guide (Appendix 2) to identify each type of organism.<br />
Step 2: Record the Species<br />
After identifying what type of organism is under each dot, put a check mark in the “Times Observed” column <strong>on</strong> your data<br />
sheet each time you observe an organism under a dot. Next, add up all of your check marks for each type of organism and<br />
record this number in the “Total Times Observed” column of your data sheet.<br />
Step 3: Calculate Percent Cover<br />
Calculate the percent cover for each species. Record this <strong>on</strong> your data sheet in the “Percent Cover” column <strong>on</strong> your data sheet.<br />
Percent cover = (Number of points under which organism is observed) ÷ (Total number of points) × 100<br />
Step 4: Identify Healthy and Unhealthy Points<br />
Add up percent live coral cover. Next add up percent cover for all dead coral points (areas with any dead coral, which looks like<br />
a rock, or dead coral covered with algae).<br />
Step 5: Analyze the Data<br />
After filling in the data table for each photoquadrat, compare the photoquadrats al<strong>on</strong>g your transect and answer the following<br />
questi<strong>on</strong>s:<br />
1. What photoquadrat had the highest percent live coral points? ________________________________________________<br />
2. What photoquadrat had the highest percent of percent dead coral points? ______________________________________<br />
Step 6: Graph data<br />
1. Make a data table that displays total live percent cover in each photoquadrat.<br />
2. Next, use the data table to make a bar graph that illustrates live percent cover of each photoquadrat.. Make sure to number<br />
and label the X and Y axes of your graph and include a title.<br />
Step 7: Draw c<strong>on</strong>clusi<strong>on</strong>s<br />
Answer the following questi<strong>on</strong>s:<br />
1. Based <strong>on</strong> your data is <strong>on</strong>e photoquadrat healthier than all the others? Write 2 or 3 sentences that explain why.<br />
_________________________________________________________________________________________________<br />
_________________________________________________________________________________________________
Corals and Climate Change<br />
<str<strong>on</strong>g>Photoquadrats</str<strong>on</strong>g> <strong>on</strong> a <strong>Transect</strong>: Student Guide<br />
_________________________________________________________________________________________________<br />
_________________________________________________________________________________________________<br />
3. What is the average percent live and percent dead coral cover for all of the photoquadrats <strong>on</strong> the transect?<br />
Average % live: ________________<br />
Average % dead: _______________<br />
4. Based <strong>on</strong> your data is the overall reef healthy? Write 2 or 3 sentences that explain why or why not.<br />
__________________________________________________________________________________________________<br />
__________________________________________________________________________________________________<br />
__________________________________________________________________________________________________<br />
__________________________________________________________________________________________________
Corals and Climate Change<br />
<str<strong>on</strong>g>Photoquadrats</str<strong>on</strong>g> <strong>on</strong> a <strong>Transect</strong>: Data Sheets<br />
Photoquadrat 1<br />
Species<br />
Antler coral<br />
Times observed (place a<br />
check mark in this column<br />
every time you observe each<br />
species)<br />
Total times observed<br />
(add up<br />
check marks for each<br />
species)<br />
Percent cover (percent<br />
cover=total times<br />
observed÷total dots ×<br />
100)<br />
Cauliflower coral<br />
Lobe coral<br />
Blue soft coral<br />
Turf algae<br />
Encrusting algae<br />
Dead coral<br />
Percent live cover<br />
Percent dead cover<br />
Photoquadrat 2<br />
Species<br />
Antler coral<br />
Times observed (place a<br />
check mark in this column<br />
every time you observe each<br />
species)<br />
Total times observed<br />
(add up<br />
check marks for each<br />
species)<br />
Percent cover (percent<br />
cover=total times<br />
observed÷total dots ×<br />
100)<br />
Cauliflower coral<br />
Lobe coral<br />
Blue soft coral<br />
Turf algae<br />
Encrusting algae<br />
Dead coral<br />
Percent live cover<br />
Percent dead cover
Corals and Climate Change<br />
<str<strong>on</strong>g>Photoquadrats</str<strong>on</strong>g> <strong>on</strong> a <strong>Transect</strong>: Data Sheets<br />
Photoquadrat 3<br />
Species<br />
Antler coral<br />
Times observed (place a<br />
check mark in this column<br />
every time you observe each<br />
species)<br />
Total times observed<br />
(add up<br />
check marks for each<br />
species)<br />
Percent cover (percent<br />
cover=total times<br />
observed÷total dots ×<br />
100)<br />
Cauliflower coral<br />
Lobe coral<br />
Blue soft coral<br />
Turf algae<br />
Encrusting algae<br />
Dead coral<br />
Percent live cover<br />
Percent dead cover<br />
Photoquadrat 4<br />
Species<br />
Antler coral<br />
Times observed (place a<br />
check mark in this column<br />
every time you observe each<br />
species)<br />
Total times observed<br />
(add up<br />
check marks for each<br />
species)<br />
Percent cover (percent<br />
cover=total times<br />
observed÷total dots ×<br />
100)<br />
Cauliflower coral<br />
Lobe coral<br />
Blue soft coral<br />
Turf algae<br />
Encrusting algae<br />
Dead coral<br />
Percent live cover<br />
Percent dead cover
Corals and Climate Change<br />
<str<strong>on</strong>g>Photoquadrats</str<strong>on</strong>g> <strong>on</strong> a <strong>Transect</strong>: Appendix 1 Photoquadrat Images<br />
Photoquadrat 1
Corals and Climate Change<br />
<str<strong>on</strong>g>Photoquadrats</str<strong>on</strong>g> <strong>on</strong> a <strong>Transect</strong>: Appendix 1 Photoquadrat Images<br />
Photoquadrat 2
Corals and Climate Change<br />
<str<strong>on</strong>g>Photoquadrats</str<strong>on</strong>g> <strong>on</strong> a <strong>Transect</strong>: Appendix 1 Photoquadrat Images<br />
Photoquadrat 3
Corals and Climate Change<br />
<str<strong>on</strong>g>Photoquadrats</str<strong>on</strong>g> <strong>on</strong> a <strong>Transect</strong>: Appendix 1 Photoquadrat Images<br />
Photoquadrat 4
Corals and Climate Change<br />
<str<strong>on</strong>g>Photoquadrats</str<strong>on</strong>g> <strong>on</strong> a <strong>Transect</strong>: Appendix 2 Organism Identificati<strong>on</strong> Guide<br />
Corals<br />
ANTLER CORAL - a branching live st<strong>on</strong>y<br />
coral. Photo: NPS<br />
LOBE CORAL - a bumpy looking live st<strong>on</strong>y<br />
coral. Photo: NPS<br />
BLUE SOFT CORAL - a coral that does not<br />
make a calcium carb<strong>on</strong>ate skelet<strong>on</strong>. Photo:<br />
IAN/UMCES<br />
CAULIFLOWER CORAL - a live st<strong>on</strong>y coral<br />
with elaborate bends. Photo: IAN/UMCES<br />
DEAD CORAL - rocky substrate with no living<br />
coral polyps. Photo: NPS
Corals and Climate Change<br />
<str<strong>on</strong>g>Photoquadrats</str<strong>on</strong>g> <strong>on</strong> a <strong>Transect</strong>: Appendix 2 Organism Identificati<strong>on</strong> Guide<br />
Algae<br />
TURF ALGAE - short filamentous algae that<br />
may grow <strong>on</strong> live coral, dead coral, or other<br />
substrates. Photo: NOAA<br />
ENCRUSTING ALGAE - pink to dark<br />
burgandy algae crust that grows <strong>on</strong> hard substrates.<br />
Photo: NOAA<br />
Invertebrates<br />
SEA URCHIN - can have short or l<strong>on</strong>g spines<br />
and attach to hard substrate. Photo: NOAA