A Comparison of Seafloor Classification Methods Through the Use ...
A Comparison of Seafloor Classification Methods Through the Use ...
A Comparison of Seafloor Classification Methods Through the Use ...

You also want an ePaper? Increase the reach of your titles
YUMPU automatically turns print PDFs into web optimized ePapers that Google loves.
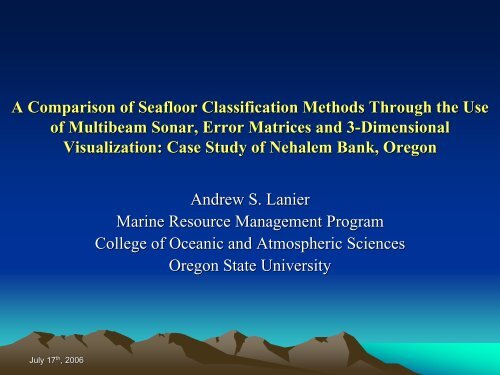
A <strong>Comparison</strong> <strong>of</strong> <strong>Seafloor</strong> <strong>Classification</strong> <strong>Methods</strong> <strong>Through</strong> <strong>the</strong> <strong>Use</strong><br />
<strong>of</strong> Multibeam Sonar, Error Matrices and 3-Dimensional<br />
3<br />
Visualization: Case Study <strong>of</strong> Nehalem Bank, Oregon<br />
Andrew S. Lanier<br />
Marine Resource Management Program<br />
College <strong>of</strong> Oceanic and Atmospheric Sciences<br />
Oregon State University<br />
July 17 th , 2006
Thesis Outline<br />
• Introduction<br />
– Background & Motivation<br />
– Multibeam Sonar Principles<br />
• Study Site and Data Set<br />
Description<br />
– Processing<br />
– Results<br />
• Benthic Habitat <strong>Classification</strong><br />
– Background<br />
– Topographic <strong>Classification</strong><br />
– Quantitative Assessment<br />
– Backscatter <strong>Classification</strong><br />
• Discussion <strong>of</strong> Results<br />
• Conclusions and Future<br />
Implications<br />
• Acknowledgements<br />
Submersible<br />
dive images from<br />
Nehalem Bank<br />
July 17 th , 2006 MS Thesis Defense
Background<br />
Timeline <strong>of</strong> Significant Events<br />
Rockfish Conservation Area (May, 2006)<br />
MSA Reauthorized<br />
EFH evaluation mandated<br />
NMFS declares 9 groundfish<br />
species“Over-fished” –Implements<br />
Area Closures<br />
NMFS publishes Final EIS<br />
alternatives<br />
White = Regulatory<br />
Yellow = Non-Regulatory<br />
NMFS Litigation Re: EIS<br />
PEW Oceans Commission<br />
1 st EFH Maps published<br />
US Oceans Commission<br />
(Bellman et al, 2006)<br />
July 17 th , 2006 MS Thesis Defense
Active Tectonics and<br />
<strong>Seafloor</strong> Mapping Lab<br />
Motivation<br />
1 st Published EFH Map<br />
Thematic interpretation<br />
(Romsos, 2004)<br />
Data Gaps<br />
Scale and Resolution Issues<br />
My Role: To evaluate what<br />
kinds <strong>of</strong> analysis are possible<br />
when <strong>the</strong>re is a high density<br />
<strong>of</strong> different types (and quality)<br />
<strong>of</strong> data available<br />
(Romsos, 2004)<br />
July 17 th , 2006 MS Thesis Defense
Motivation<br />
Study Goals<br />
Identify <strong>the</strong> limitations <strong>of</strong> <strong>the</strong> multibeam sonar data set.<br />
<strong>Use</strong> <strong>the</strong> Nehalem Bank study site to address <strong>the</strong><br />
following questions:<br />
– Does <strong>the</strong> multibeam data provide an accurate depiction<br />
<strong>of</strong> <strong>the</strong> seafloor topography? What artifacts remain and<br />
propagate into <strong>the</strong> classified images and data layers?<br />
– How do you assess <strong>the</strong> quality <strong>of</strong> a benthic<br />
classification attempt when groundtruthing information<br />
is at a different scale <strong>of</strong> observation?<br />
July 17 th , 2006 MS Thesis Defense
Thesis Outline<br />
• Introduction<br />
– Background & Motivation<br />
– Multibeam Sonar Principles<br />
• Study Site and Data Set<br />
Description<br />
– Processing<br />
– Results<br />
• Benthic Habitat <strong>Classification</strong><br />
– Background<br />
– Topographic <strong>Classification</strong><br />
– Quantitative Assessment<br />
– Backscatter <strong>Classification</strong><br />
• Discussion <strong>of</strong> Results<br />
• Conclusions and Future<br />
Implications<br />
• Acknowledgements<br />
Multibeam<br />
Sidescan<br />
July 17 th , 2006 MS Thesis Defense
Active Remote Sensing<br />
Multibeam Sonar Principles<br />
Motion Corrections<br />
Sound reflection characteristics<br />
Common Artifacts<br />
July 17 th , 2006 MS Thesis Defense
Thesis Outline<br />
• Introduction<br />
– Background & Motivation<br />
– Multibeam Sonar Principles<br />
– Benthic Habitat <strong>Classification</strong>s<br />
• <strong>Methods</strong> and Schemes<br />
• Study Site and Data Set Description<br />
– Processing<br />
– Results<br />
• <strong>Methods</strong> Tests and Results<br />
– Topographic <strong>Classification</strong><br />
– Quantitative Assessment<br />
– Backscatter <strong>Classification</strong><br />
• Discussion <strong>of</strong> Results<br />
• Conclusions and Future Implications<br />
• Acknowledgements<br />
Graphic Here <strong>of</strong> MB Survey<br />
+ Processing Steps<br />
(Base maps by J. Chaytor)<br />
July 17 th , 2006 MS Thesis Defense
Data Specifics:<br />
– Collected using University <strong>of</strong><br />
Washington RV Thomas G.<br />
Thompson, using Kongsberg Simrad<br />
EM300 Sonar a 30 kHz frequency<br />
(August, 2002).<br />
– Collected over a period <strong>of</strong> 3 days and<br />
covers an area <strong>of</strong> approximately 375<br />
km 2<br />
– 135 one degree (1x1) acoustic beams<br />
(swath width ~1.5X water depth)<br />
– Effective EM300 depth range ~100m<br />
to ~3000m<br />
Topographic Processing Steps:<br />
MBedit MBvelocitytool MBtide<br />
Nehalem Bank Data<br />
Tide Corrections<br />
Scientist Cave<br />
July 17 th , 2006 MS Thesis Defense
Nehalem Bank Backscatter Data<br />
Nehalem Bank Backscatter Data<br />
Backscatter Processing<br />
• Angle filter to correct for <strong>the</strong> influence <strong>of</strong> grazing angle on <strong>the</strong> grey level reflectance values (MBbackanglecorrect)<br />
July 17 th , 2006 MS Thesis Defense
Thesis Outline<br />
• Introduction<br />
– Background & Motivation<br />
– Multibeam Sonar Principles<br />
• Study Site and Data Set<br />
Description<br />
– Processing<br />
– Results<br />
• Benthic Habitat <strong>Classification</strong><br />
– Background<br />
– Topographic <strong>Classification</strong><br />
– Quantitative Assessment<br />
– Backscatter <strong>Classification</strong><br />
• Discussion <strong>of</strong> Results<br />
• Conclusions and Future<br />
Implications<br />
• Acknowledgements<br />
Model <strong>of</strong> <strong>Classification</strong> Procedures<br />
Topographic<br />
BTM<br />
BTM Classified<br />
Image<br />
DEM<br />
Qualitative<br />
Assessment<br />
Reference<br />
Points<br />
Error Matrices<br />
Quantitative<br />
Assessment<br />
SIM<br />
SIM Classified<br />
Image<br />
Backscatter<br />
Backscatter<br />
Image<br />
Dive<br />
Interpretation<br />
Textural<br />
Analysis<br />
Classified<br />
Image<br />
Qualitative<br />
Assessment<br />
Input Data Set<br />
Analysis Method<br />
Result<br />
Assessment<br />
July 17 th , 2006 MS Thesis Defense
Benthic <strong>Classification</strong> <strong>Methods</strong><br />
<strong>Seafloor</strong> <strong>Classification</strong> efforts falls behind that <strong>of</strong> terrestrial classification because <strong>of</strong> <strong>the</strong><br />
nature <strong>of</strong> collecting observational data under water (Difficult to collect, $$$, Time)<br />
Types <strong>of</strong> data available:<br />
– Sample collection, <strong>the</strong> acquisition <strong>of</strong> remotely sensed data (sidescan sonar, multibeam<br />
sonar, seismic), and observational video groundtruth data<br />
Common types <strong>of</strong> classification:<br />
By single variable<br />
– Depth<br />
– Substrate<br />
Image classification techniques:<br />
– Spatial analysis<br />
• Spatial filtering<br />
• Digital Elevation Model (DEM) derivatives (slope, aspect, plan, pr<strong>of</strong>ile)<br />
Previous work on <strong>the</strong> Oregon seafloor Conducted @ Heceta Bank ( Nasby-Lucas et<br />
al., 2002; Whitmire, 2003).<br />
July 17 th , 2006 MS Thesis Defense
Benthic Terrain Modeler <strong>Classification</strong><br />
<strong>Classification</strong> Process<br />
Definition <strong>of</strong> Zones<br />
Crests –<br />
•High points in <strong>the</strong> terrain<br />
•values greater than one standard deviation<br />
from <strong>the</strong> mean in <strong>the</strong> positive direction.<br />
• Depressions –<br />
•Low points in <strong>the</strong> terrain<br />
•Values greater than one standard deviation<br />
from <strong>the</strong> mean in <strong>the</strong> negative direction.<br />
• Flats –<br />
•Flat points in <strong>the</strong> terrain<br />
•values that are within one standard deviation<br />
<strong>of</strong> <strong>the</strong> mean. Flats have a slope that is 5.<br />
Bathymetric Position Index<br />
July 17 th , 2006 MS Thesis Defense
Benthic Terrain Modeler <strong>Classification</strong><br />
<strong>Classification</strong> Process<br />
<strong>Classification</strong> Dictionary<br />
July 17 th , 2006 MS Thesis Defense
SIM <strong>Classification</strong><br />
Surface Interpretation Method<br />
<strong>Use</strong>s a randomly sited set <strong>of</strong> points<br />
interpreted in <strong>the</strong> 3D environment<br />
Model <strong>of</strong> <strong>Classification</strong> Process<br />
•1 st Calculation <strong>of</strong> spatial indices<br />
•2 nd Multiple derived spatial analysis indices<br />
are condensed using PCA and intersected<br />
with <strong>the</strong> interpreted points to create<br />
classification signatures.<br />
•3 rd The signatures are used in a maximum<br />
likelihood classification algorithm to group<br />
<strong>the</strong> values into classes.<br />
July 17 th , 2006 MS Thesis Defense
Topographic <strong>Classification</strong> Results<br />
BTM<br />
SIM<br />
July 17 th , 2006 MS Thesis Defense
Topographic <strong>Classification</strong> Results<br />
Class<br />
Description<br />
Topographic Classified Area<br />
1<br />
Narrow<br />
Depression<br />
500<br />
3DSIM<br />
BTM Tool<br />
2<br />
3<br />
Depression Local<br />
Crest<br />
Depression<br />
Gentle Slope<br />
4 Crest Depression<br />
5 Crest Ridgetop<br />
6 Crest Plateau<br />
Area (10^9 meters)<br />
450<br />
400<br />
350<br />
300<br />
250<br />
200<br />
150<br />
30.00<br />
25.00<br />
20.00<br />
15.00<br />
10.00<br />
5.00<br />
7 Crest Hillslope<br />
8<br />
9<br />
10<br />
Open Slope<br />
Depression<br />
Open Slope<br />
Crest<br />
Open Shelf<br />
Slope<br />
100<br />
50<br />
0<br />
0.00<br />
1 2 3 4 5 6 7 8 9<br />
1 2 3 4 5 6 7 8 9 10<br />
Class<br />
July 17 th , 2006 MS Thesis Defense
Topographic <strong>Classification</strong> Results<br />
Qualitative <strong>Comparison</strong><br />
Summary<br />
BTM<br />
Strengths<br />
• Fine structural detail<br />
Weaknesses<br />
• Bank edges<br />
SIM<br />
Strengths<br />
• Fine structural detail<br />
• Bank edges<br />
Weaknesses<br />
• Sonar Artifacts<br />
July 17 th , 2006 MS Thesis Defense
Thesis Outline<br />
• Introduction<br />
– Background & Motivation<br />
– Multibeam Sonar Principles<br />
– Benthic Habitat <strong>Classification</strong>s<br />
• <strong>Methods</strong> and Schemes<br />
• Study Site and Data Set Description<br />
– Processing<br />
– Results<br />
• <strong>Methods</strong> Tests and Results<br />
– Topographic <strong>Classification</strong><br />
– Quantitative Assessment<br />
– Backscatter <strong>Classification</strong><br />
• Discussion <strong>of</strong> Results<br />
• Conclusions and Future Implications<br />
• Acknowledgements<br />
Model <strong>of</strong> <strong>Classification</strong> Procedures<br />
Topographic<br />
BTM<br />
BTM Classified<br />
Image<br />
DEM<br />
Qualitative<br />
Assessment<br />
Reference<br />
Points<br />
Error Matrices<br />
SIM<br />
SIM Classified<br />
Image<br />
Backscatter<br />
Backscatter<br />
Image<br />
Dive<br />
Interpretation<br />
Textural<br />
Analysis<br />
Classified<br />
Image<br />
Qualitative<br />
Assessment<br />
Input Data Set<br />
Analysis Method<br />
Quantitative<br />
Assessment<br />
Result<br />
Assessment<br />
July 17 th , 2006 MS Thesis Defense
Quantitative Assessment <strong>Methods</strong><br />
• Introduction<br />
– Reference Data<br />
• <strong>Methods</strong><br />
– Reference Points Created<br />
and Interpreted<br />
– Compared to <strong>the</strong> results<br />
from <strong>the</strong> classification<br />
methods.<br />
– An error matrix was<br />
completed for each<br />
classified grid.<br />
3D Perspective View <strong>of</strong> Nehalem Bank<br />
July 17 th , 2006 MS Thesis Defense
Quantitative Assessment Results<br />
July 17 th , 2006 MS Thesis Defense
Quantitative Assessment Results<br />
Error Matrices (Simplified <strong>Classification</strong>)<br />
Error Matrices Statistics<br />
KHAT
Thesis Outline<br />
• Introduction<br />
– Background & Motivation<br />
– Multibeam Sonar Principles<br />
– Benthic Habitat <strong>Classification</strong>s<br />
• <strong>Methods</strong> and Schemes<br />
• Study Site and Data Set Description<br />
– Processing<br />
– Results<br />
• <strong>Methods</strong> Tests and Results<br />
– Topographic <strong>Classification</strong><br />
– Quantitative Assessment<br />
– Backscatter <strong>Classification</strong><br />
• Discussion <strong>of</strong> Results<br />
• Conclusions and Future Implications<br />
• Acknowledgements<br />
Model <strong>of</strong> <strong>Classification</strong> Procedures<br />
Topographic<br />
BTM<br />
BTM Classified<br />
Image<br />
DEM<br />
Qualitative<br />
Assessment<br />
Reference<br />
Points<br />
Error Matrices<br />
SIM<br />
SIM Classified<br />
Image<br />
Backscatter<br />
Backscatter<br />
Image<br />
Dive<br />
Interpretation<br />
Textural<br />
Analysis<br />
Classified<br />
Image<br />
Qualitative<br />
Assessment<br />
Input Data Set<br />
Analysis Method<br />
Quantitative<br />
Assessment<br />
Result<br />
Assessment<br />
July 17 th , 2006 MS Thesis Defense
Backscatter Image <strong>Classification</strong><br />
Textural Analysis<br />
Nehalem Bank backscatter image documents an unusual<br />
phenomenon.<br />
Textural Analysis relies only on characteristic patterns <strong>of</strong> reflectance.<br />
Grey Level Co-occurrence Matrices (GLCM)<br />
– <strong>Use</strong>d to calculate statistical indices<br />
Indices used in this study were: (based upon Cochrane & Lafferty, 2001; Diaz, 1999)<br />
– Homogeneity – How alike are <strong>the</strong> pixels within a neighborhood<br />
– Entropy – How ordered are <strong>the</strong> pixels within a neighborhood<br />
July 17 th , 2006 MS Thesis Defense
Textural Analysis <strong>Methods</strong><br />
Backscatter Image <strong>Classification</strong><br />
• Match submersible dive groundtruth data to <strong>the</strong><br />
backscatter imagery (Overlaid on DEM)<br />
Submersible Dive Interpretation<br />
by Natalie Strom, (2006)<br />
• Each Habitat is characterized using a two<br />
letter code. The first letter represents > 50%<br />
<strong>of</strong> <strong>the</strong> field <strong>of</strong> view and <strong>the</strong> second letter must<br />
represent > 20%.<br />
•Each habitat section must occur for at least<br />
10 seconds <strong>of</strong> <strong>the</strong> video transect.<br />
July 17 th , 2006 MS Thesis Defense
Backscatter Image <strong>Classification</strong><br />
<strong>Methods</strong> (cont.)<br />
Compute GLCM derived indices<br />
Create training sites<br />
Produce classification signatures<br />
Classify using <strong>the</strong> Maximum Likelihood<br />
clustering algorithm<br />
July 17 th , 2006 MS Thesis Defense
Strengths<br />
Rocky Ridges, Low Relief Mud, Mixed Class<br />
Weaknesses<br />
Shadows, Noise, Data Gaps Classified incorrectly<br />
Textural Analysis Results<br />
Strengths<br />
Rock Types Distinguished<br />
Weaknesses<br />
Low Relief Mud, Shadows<br />
July 17 th , 2006 MS Thesis Defense
Thesis Outline<br />
• Introduction<br />
– Background & Motivation<br />
– Multibeam Sonar Principles<br />
– Benthic Habitat <strong>Classification</strong>s<br />
• <strong>Methods</strong> and Schemes<br />
• Study Site and Data Set Description<br />
– Processing<br />
– Results<br />
• <strong>Methods</strong> Tests and Results<br />
– Topographic <strong>Classification</strong><br />
– Quantitative Assessment<br />
– Backscatter <strong>Classification</strong><br />
• Discussion <strong>of</strong> Results<br />
• Conclusions and Future Implications<br />
• Acknowledgements<br />
Model <strong>of</strong> <strong>Classification</strong> Procedures<br />
Topographic<br />
BTM<br />
BTM Classified<br />
Image<br />
DEM<br />
Qualitative<br />
Assessment<br />
Reference<br />
Points<br />
Error Matrices<br />
SIM<br />
SIM Classified<br />
Image<br />
Backscatter<br />
Backscatter<br />
Image<br />
Dive<br />
Interpretation<br />
Textural<br />
Analysis<br />
Classified<br />
Image<br />
Qualitative<br />
Assessment<br />
Input Data Set<br />
Analysis Method<br />
Quantitative<br />
Assessment<br />
Result<br />
Assessment<br />
July 17 th , 2006 MS Thesis Defense
Discussion<br />
Data Set<br />
• Topographic Data<br />
– Processing<br />
–Results<br />
– Knowledge extent<br />
• Backscatter Data<br />
– Processing<br />
–Results<br />
– Knowledge extent<br />
July 17 th , 2006 MS Thesis Defense
Topographic<br />
<strong>Classification</strong><br />
• Both methods<br />
– Semi-automated<br />
– Moderate success<br />
• Quality Assessments<br />
– Qualitative<br />
– Quantitative<br />
Discussion<br />
July 17 th , 2006 MS Thesis Defense
Backscatter <strong>Classification</strong><br />
Discussion<br />
Dive interpretations<br />
– Correctly sited on landscape<br />
Textural Analysis<br />
– Using GLCM’s<br />
Mixed Results<br />
– worked well for Dive 3430<br />
– somewhat poorly for Dive 3431<br />
Sidescan imagery changes <strong>the</strong><br />
picture, and our perception <strong>of</strong><br />
<strong>the</strong> area<br />
Final interpretation<br />
– EM300 imagery is likely imaging<br />
subsurface seafloor characteristics<br />
EM300 Imagery AMS 150 Sidescan Imagery<br />
July 17 th , 2006 MS Thesis Defense
Conclusions<br />
Study Goals<br />
• Identify <strong>the</strong> limitations <strong>of</strong> <strong>the</strong> multibeam sonar data<br />
set. <strong>Use</strong> <strong>the</strong> Nehalem Bank study site to address <strong>the</strong><br />
following questions:<br />
– 5m cell size resolution over <strong>the</strong> entire region, with ~ 2m<br />
cell size possible in shallow regions.<br />
• Questions addressed at beginning:<br />
– 1. Does <strong>the</strong> MBES data provide an accurate depiction <strong>of</strong><br />
<strong>the</strong> seafloor topography? What artifacts remain and<br />
propagate into <strong>the</strong> classified images and data layers?<br />
• The multibeam imagery provided a detailed view <strong>of</strong> <strong>the</strong><br />
landscape down to <strong>the</strong> Macroscale habitat features.<br />
• The artifacts that remain in <strong>the</strong> final image include nadir regions,<br />
swath overlap, turn artifacts.<br />
July 17 th , 2006 MS Thesis Defense
Conclusions<br />
Study Goals<br />
2. How do you assess <strong>the</strong> quality <strong>of</strong> a<br />
benthic classification attempt when<br />
groundtruthing information is at a<br />
different scale <strong>of</strong> observation?<br />
– Qualitative evaluation is possible<br />
– 3D GIS environment<br />
– Error matrices<br />
• can be used to iteratively evaluate<br />
<strong>the</strong> methods and results.<br />
– Limit <strong>the</strong> assessment to <strong>the</strong> areas<br />
where groundtruth information is<br />
available<br />
July 17 th , 2006 MS Thesis Defense
Future Implications and Research Directions<br />
For Sonar Image <strong>Classification</strong><br />
– Automated classification a possibility? Not yet.<br />
– Provided a method for <strong>the</strong> assessment <strong>of</strong> topographic accuracy that can<br />
be used on any multibeam data set.<br />
For Marine Resource Management<br />
– The presence <strong>of</strong> <strong>the</strong> Nehalem Bank topographic classification and<br />
bathymetric data set will play a large role in <strong>the</strong> future investigations in<br />
benthic ecology by dictating <strong>the</strong> locations where <strong>the</strong> fur<strong>the</strong>r exploration<br />
is needed.<br />
• Future investigations <strong>of</strong> EFH at a smaller scale is possible using <strong>the</strong> data<br />
sets produced from this study<br />
– Future Research Questions:<br />
• Where have <strong>the</strong> impacts <strong>of</strong> an activity like trawling been concentrated in<br />
<strong>the</strong> Nehalem Bank region?<br />
• Does <strong>the</strong> structural diversity <strong>of</strong> topographic habitats in <strong>the</strong> bank top region<br />
provide a natural refuge from those actions, and if so, what is <strong>the</strong> true<br />
population <strong>of</strong> fish in those areas?<br />
July 17 th , 2006 MS Thesis Defense
• Major Advisor: Chris Goldfinger<br />
• Committee Members: Dawn<br />
Wright, Waldo Wakefield, Skip<br />
Roechefort<br />
• Funding Agencies:<br />
NOAA NWFSC<br />
CIMRS<br />
NOAA Coastal Services Center<br />
• Active Tectonics and <strong>Seafloor</strong><br />
Mapping Crew<br />
• Fellow COAS students<br />
• My Family<br />
• Fiancé: Jessica Cardinal<br />
Acknowledgments<br />
July 17 th , 2006 MS Thesis Defense
Misc Info<br />
• Error Matrix Statistics<br />
July 17 th , 2006 MS Thesis Defense
Benthic <strong>Classification</strong><br />
Benthic habitat: is a seafloor region that can be characterized using <strong>the</strong> physical gradients <strong>of</strong> several<br />
variables, including depth, substrate, slope, roughness, and morphology, (may also include oceanographic<br />
factors such as temperature, salinity, nutrient flux, and biogenic content).<br />
Habitat <strong>Classification</strong> Schemes<br />
By Scale<br />
Using Nautical charts and existing<br />
geological maps (Greene, 2005)<br />
Towards Process<br />
An idealized scheme to reflect influence<br />
<strong>of</strong> environmental conditions (Valentine et<br />
al., 2004)<br />
Habitat classes were categorized into ei<strong>the</strong>r<br />
<strong>of</strong> four groups:<br />
• megahabitats (10’s <strong>of</strong> km’s – 1km)<br />
• mesohabitats (1km - 10’s <strong>of</strong> meters)<br />
• macrohabitats (10’s <strong>of</strong> meters to 1m)<br />
• microhabitats (1m to 1cm).<br />
A hierarchy <strong>of</strong> attributes can be associated<br />
with a single seafloor region<br />
Their scheme recognized <strong>the</strong> eight<br />
<strong>the</strong>mes <strong>of</strong>:<br />
– seabed topography<br />
– sediment dynamics<br />
– texture<br />
– grain size<br />
– Roughness<br />
– fauna and flora<br />
– habitat association and usage<br />
– habitat recovery from disturbance<br />
Those <strong>the</strong>mes are fur<strong>the</strong>r attributed by a<br />
sequence <strong>of</strong> modifiers that address habitat<br />
characteristics in increasing levels <strong>of</strong> detail<br />
July 17 th , 2006 MS Thesis Defense
Discussion<br />
Final <strong>Classification</strong> Scheme<br />
• Greene et al. (2005) scheme<br />
was chosen to define broad<br />
zones in <strong>the</strong> landscape.<br />
Based upon Mega-Habitat<br />
definitions.<br />
– Previous EFH maps use it<br />
– No process information is<br />
available (Valentine et al.,<br />
2004)<br />
• Intersect <strong>the</strong> fine scale<br />
structures delineated using <strong>the</strong><br />
BTM tool<br />
July 17 th , 2006 MS Thesis Defense
What are <strong>the</strong> benefits to classification <strong>of</strong> using a 3D perspective? Is it<br />
possible to quantitatively compare two different classifications <strong>of</strong> <strong>the</strong><br />
data using observations in a 3D environment?<br />
Can <strong>the</strong> texture <strong>of</strong> multibeam sonar backscatter imagery be used to<br />
classify homogeneous regions <strong>of</strong> substrate on <strong>the</strong> seafloor given <strong>the</strong><br />
Nehalem Bank data set and <strong>the</strong> available groundtruthing data<br />
sources?<br />
July 17 th , 2006 MS Thesis Defense
Study Goal<br />
3. What are <strong>the</strong> benefits to classification<br />
<strong>of</strong> using a 3D perspective? Is it<br />
possible to quantitatively compare two<br />
different classifications <strong>of</strong> <strong>the</strong> data<br />
using observations in a 3D<br />
environment?<br />
Conclusions<br />
Calculating error matrix statistics allows for<br />
<strong>the</strong> evaluation <strong>of</strong> each result individually,<br />
while also making it possible for comparison<br />
among different results.<br />
Dives were correctly placed in <strong>the</strong> landscape<br />
where <strong>the</strong>y could be used to guide <strong>the</strong><br />
textural classification <strong>of</strong> backscatter<br />
imagery.<br />
<strong>Use</strong> <strong>of</strong> <strong>the</strong> 3D environment helped to colocate<br />
different data sets on <strong>the</strong> bathymetry,<br />
while also providing an opportunity to<br />
perform quantitative assessments through <strong>the</strong><br />
use <strong>of</strong> error matrices.<br />
July 17 th , 2006 MS Thesis Defense
4. Can <strong>the</strong> texture <strong>of</strong> multibeam sonar<br />
backscatter imagery be used to classify<br />
homogeneous regions <strong>of</strong> substrate on <strong>the</strong><br />
seafloor given <strong>the</strong> Nehalem Bank data set<br />
and <strong>the</strong> avaailable groundtruthing data<br />
sources?<br />
– The presence <strong>of</strong> two sources <strong>of</strong><br />
imagery helped to evaluate what<br />
was actually being imaged in <strong>the</strong><br />
environment.<br />
Conclusions<br />
July 17 th , 2006 MS Thesis Defense