Box and Whisker Plots and Measures of Central Tendency - mdk12
Box and Whisker Plots and Measures of Central Tendency - mdk12
Box and Whisker Plots and Measures of Central Tendency - mdk12

Create successful ePaper yourself
Turn your PDF publications into a flip-book with our unique Google optimized e-Paper software.
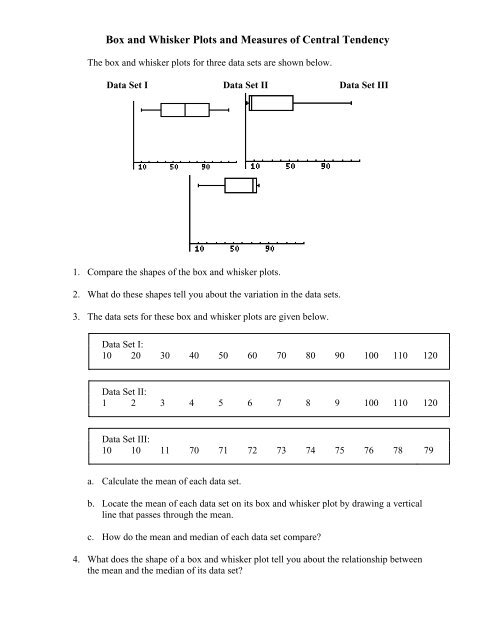
<strong>Box</strong> <strong>and</strong> <strong>Whisker</strong> <strong>Plots</strong> <strong>and</strong> <strong>Measures</strong> <strong>of</strong> <strong>Central</strong> <strong>Tendency</strong><br />
The box <strong>and</strong> whisker plots for three data sets are shown below.<br />
Data Set I Data Set II Data Set III<br />
1. Compare the shapes <strong>of</strong> the box <strong>and</strong> whisker plots.<br />
2. What do these shapes tell you about the variation in the data sets.<br />
3. The data sets for these box <strong>and</strong> whisker plots are given below.<br />
Data Set I:<br />
10 20 30 40 50 60 70 80 90 100 110 120<br />
Data Set II:<br />
1 2 3 4 5 6 7 8 9 100 110 120<br />
Data Set III:<br />
10 10 11 70 71 72 73 74 75 76 78 79<br />
a. Calculate the mean <strong>of</strong> each data set.<br />
b. Locate the mean <strong>of</strong> each data set on its box <strong>and</strong> whisker plot by drawing a vertical<br />
line that passes through the mean.<br />
c. How do the mean <strong>and</strong> median <strong>of</strong> each data set compare?<br />
4. What does the shape <strong>of</strong> a box <strong>and</strong> whisker plot tell you about the relationship between<br />
the mean <strong>and</strong> the median <strong>of</strong> its data set?
<strong>Box</strong> <strong>and</strong> <strong>Whisker</strong> <strong>Plots</strong> <strong>and</strong> <strong>Measures</strong> <strong>of</strong> <strong>Central</strong> <strong>Tendency</strong><br />
Answer Key<br />
Notes: When students are making judgements about which measure <strong>of</strong> central tendency<br />
to use, they need to underst<strong>and</strong> how variability in the data affects the values <strong>of</strong> the<br />
measures <strong>of</strong> central tendency. Generally, if you are looking for the best representative<br />
value when there is a skewed set <strong>of</strong> data, it is better to use the median rather than the<br />
mean. This is because the mean can be influenced by outliers <strong>and</strong> therefore give a false<br />
idea <strong>of</strong> the truth.<br />
1 - 2. Students should mention that Data Set I is symmetrical. They can see that the box<br />
<strong>and</strong> whisker plot is symmetrical whereas the other two plots are not. Data Set II<br />
has half the data that is 10 or less <strong>and</strong> the other half between 10 <strong>and</strong> 120, while<br />
Data Set III has half the data falling between 70 <strong>and</strong> 80 with the other half falling<br />
between 10 <strong>and</strong> 70. Students should have a solid underst<strong>and</strong>ing <strong>of</strong> median <strong>and</strong><br />
how it is represented in a box <strong>and</strong> whisker plot.<br />
3. a – b.<br />
Mean Median<br />
Data Set I 65 65<br />
Data Set II 31.25 6.5<br />
Data Set III 58.25 72.5<br />
c. If the data are symmetrical, then the mean <strong>and</strong> the median are equal. However,<br />
when the data are skewed to the right as in Data Set II, the mean is greater than<br />
the median. When the data are skewed to the left as is the case with Data Set<br />
III, the mean is less than the median. In other words, the mean is pulled in the<br />
direction <strong>of</strong> the skewedness or outliers while the median is not effected.<br />
4. If the box <strong>and</strong> whisker plot is symmetrical, the mean <strong>and</strong> the median will be the<br />
same. If the data are skewed to the right (you can tell this by a long whisker on<br />
the right side), then the mean will be greater than the median. If the data are<br />
skewed to the left (shown by a long whisker to the left side), then the mean will<br />
be less than the median.