A Rule-Based Fault Detection Algorithm for a Purge System of a ...
A Rule-Based Fault Detection Algorithm for a Purge System of a ...
A Rule-Based Fault Detection Algorithm for a Purge System of a ...

You also want an ePaper? Increase the reach of your titles
YUMPU automatically turns print PDFs into web optimized ePapers that Google loves.
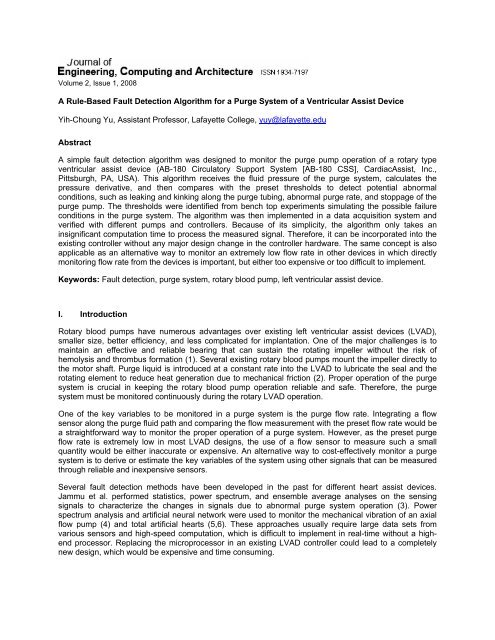
Volume 2, Issue 1, 2008<br />
A <strong>Rule</strong>-<strong>Based</strong> <strong>Fault</strong> <strong>Detection</strong> <strong>Algorithm</strong> <strong>for</strong> a <strong>Purge</strong> <strong>System</strong> <strong>of</strong> a Ventricular Assist Device<br />
Yih-Choung Yu, Assistant Pr<strong>of</strong>essor, Lafayette College, yuy@lafayette.edu<br />
Abstract<br />
A simple fault detection algorithm was designed to monitor the purge pump operation <strong>of</strong> a rotary type<br />
ventricular assist device (AB-180 Circulatory Support <strong>System</strong> [AB-180 CSS], CardiacAssist, Inc.,<br />
Pittsburgh, PA, USA). This algorithm receives the fluid pressure <strong>of</strong> the purge system, calculates the<br />
pressure derivative, and then compares with the preset thresholds to detect potential abnormal<br />
conditions, such as leaking and kinking along the purge tubing, abnormal purge rate, and stoppage <strong>of</strong> the<br />
purge pump. The thresholds were identified from bench top experiments simulating the possible failure<br />
conditions in the purge system. The algorithm was then implemented in a data acquisition system and<br />
verified with different pumps and controllers. Because <strong>of</strong> its simplicity, the algorithm only takes an<br />
insignificant computation time to process the measured signal. There<strong>for</strong>e, it can be incorporated into the<br />
existing controller without any major design change in the controller hardware. The same concept is also<br />
applicable as an alternative way to monitor an extremely low flow rate in other devices in which directly<br />
monitoring flow rate from the devices is important, but either too expensive or too difficult to implement.<br />
Keywords: <strong>Fault</strong> detection, purge system, rotary blood pump, left ventricular assist device.<br />
I. Introduction<br />
Rotary blood pumps have numerous advantages over existing left ventricular assist devices (LVAD),<br />
smaller size, better efficiency, and less complicated <strong>for</strong> implantation. One <strong>of</strong> the major challenges is to<br />
maintain an effective and reliable bearing that can sustain the rotating impeller without the risk <strong>of</strong><br />
hemolysis and thrombus <strong>for</strong>mation (1). Several existing rotary blood pumps mount the impeller directly to<br />
the motor shaft. <strong>Purge</strong> liquid is introduced at a constant rate into the LVAD to lubricate the seal and the<br />
rotating element to reduce heat generation due to mechanical friction (2). Proper operation <strong>of</strong> the purge<br />
system is crucial in keeping the rotary blood pump operation reliable and safe. There<strong>for</strong>e, the purge<br />
system must be monitored continuously during the rotary LVAD operation.<br />
One <strong>of</strong> the key variables to be monitored in a purge system is the purge flow rate. Integrating a flow<br />
sensor along the purge fluid path and comparing the flow measurement with the preset flow rate would be<br />
a straight<strong>for</strong>ward way to monitor the proper operation <strong>of</strong> a purge system. However, as the preset purge<br />
flow rate is extremely low in most LVAD designs, the use <strong>of</strong> a flow sensor to measure such a small<br />
quantity would be either inaccurate or expensive. An alternative way to cost-effectively monitor a purge<br />
system is to derive or estimate the key variables <strong>of</strong> the system using other signals that can be measured<br />
through reliable and inexpensive sensors.<br />
Several fault detection methods have been developed in the past <strong>for</strong> different heart assist devices.<br />
Jammu et al. per<strong>for</strong>med statistics, power spectrum, and ensemble average analyses on the sensing<br />
signals to characterize the changes in signals due to abnormal purge system operation (3). Power<br />
spectrum analysis and artificial neural network were used to monitor the mechanical vibration <strong>of</strong> an axial<br />
flow pump (4) and total artificial hearts (5,6). These approaches usually require large data sets from<br />
various sensors and high-speed computation, which is difficult to implement in real-time without a highend<br />
processor. Replacing the microprocessor in an existing LVAD controller could lead to a completely<br />
new design, which would be expensive and time consuming.
In this paper, a fault detection algorithm was designed to identify the possible fault conditions <strong>of</strong> the<br />
infusion system (purge system): blockage, leakage, high/low purge rate, and purge pump stoppage, <strong>for</strong><br />
the AB-180 CSS blood pump (7) using only purge pressure as the measurement. The algorithm<br />
compares the measured purge pressure and the calculated pressure derivative to the preset thresholds to<br />
detect the possible faults in the system. The thresholds were determined by the differences between the<br />
normal and fault signals under experimental conditions. This algorithm is simple and can be easily<br />
integrated with the existing device controller without major hardware or s<strong>of</strong>tware design changes.<br />
II. <strong>System</strong> Description<br />
The AB-180 CSS is an implantable LVAD <strong>for</strong> patients with post-cardiotomy cardiogenic shock who are<br />
refractory to standard treatment, such as intra-aortic balloon pump support, pharmacological treatment, or<br />
both. The intent <strong>of</strong> the AB-180 CSS is to provide temporary mechanical support by pumping blood from<br />
the left atrium to the ascending aorta until native heart function recovers. As shown in Figure 1, the AB-<br />
180 CSS is a continuous-flow LVAD, which consists <strong>of</strong> a centrifugal pump operated by a three-phase<br />
permanent magnet brushless DC motor, a purge system delivering purge fluid (infusate) <strong>for</strong> lubrication,<br />
and an occluder system preventing retrograde flow into the heart in the event <strong>of</strong> device failure (7). The<br />
pump is connected to the external control unit by a power cable that passes through the patient’s skin.<br />
Figure 1, AB-180 CSS pump assembly (7)<br />
2
The purge system delivers the infusate to the AB-180 CSS centrifugal pump. The infusate serves mainly<br />
to provide a hydrodynamic bearing <strong>for</strong> the internal moving parts <strong>of</strong> the AB-180 CSS pump. This reduces<br />
friction, heat generation, and wear. The infusate also carries anticoagulant (heparin) into the pump upper<br />
housing at the impeller shaft seal interface to reduce the risk <strong>of</strong> thrombus <strong>for</strong>mation. The configuration <strong>of</strong><br />
the purge system, shown in Figure 2, consists <strong>of</strong> a reservoir containing infusate (a mixture <strong>of</strong> sterile water<br />
and heparin), a constant speed eccentric cam rotating peristaltic purge pump, a pressure transducer,<br />
associated tubing, and a bacteriologic filter. The intravenous (IV) bag supplies infusate to the system<br />
through a pediatric drip set connected to a length <strong>of</strong> infusion tubing. The infusion tubing is threaded<br />
through the eccentric cam infusion pump mounted in the back <strong>of</strong> the AB-180 CSS controller. Once inside<br />
the lower housing, shown in Figure 3, the infusate fills the area between the lower housing, journal, and<br />
rotor. Channels in the lower housing and journal allow the infusate to pass across the rotor surfaces,<br />
providing lubrication. The interface between the seal and the impeller functions as a check valve, allowing<br />
infusate to pass into the upper housing, while preventing blood from entering the lower housing.<br />
Figure 2, AB-180 CSS infusion system (7)<br />
3
The rotational speed <strong>of</strong> the purge pump determines the infusion rate, which is set to be within ±0.1 ml/hr<br />
<strong>of</strong> the nominal 10 ml/hr specification when the AB-180 CSS controller is manufactured. Several conditions<br />
may cause an abnormal infusion rate when the AB-180 CSS pump is under operation, such as<br />
obstruction or leaking in the infusion line, purge pump speed drift from its preset speed, and purge pump<br />
stoppage. In order to increase the safety feature <strong>of</strong> the AB-180 CSS, a rule-based fault detection<br />
algorithm was designed and implemented to monitor the purge system during operation using only the<br />
measurement <strong>of</strong> infusion pressure, which can be obtained through an inexpensive pressure transducer.<br />
Figure 3, AB-180 CSS pump internal infusate flow (7)<br />
III.<br />
Method<br />
Since the infusate is delivered by a constant rotational speed <strong>of</strong> the eccentric cam purge pump, the<br />
infusion pressure measurement is a cyclic wave<strong>for</strong>m. This wave<strong>for</strong>m can be decomposed into two parts:<br />
the dc level and the major frequency content. The dc level, represented by the mean infusion pressure, is<br />
affected by the vacuum created by the rotation <strong>of</strong> the AB-180 pump and the fluid resistance due to the<br />
infusion tubing geometry and the gap between the seal and the impeller shaft. Mean infusion pressure<br />
decreases when AB-180 pump speed increases because a higher pump speed creates a stronger<br />
vacuum effect to the purge system. A tighter seal gap creates a higher fluid resistance, which results in a<br />
higher mean infusion pressure at a constant purge rate. However, the variation <strong>of</strong> mean infusion pressure<br />
due to pump speed changes and seal geometric tolerance should be within a pre-defined range (7). An<br />
excessive high infusion pressure represents high fluid resistance, which implies that an obstruction<br />
occurs along the infusion tubing. On the other hand, an extremely low infusion pressure might be due to a<br />
leakage along the infusion tubing.<br />
The major frequency <strong>of</strong> the infusion pressure wave<strong>for</strong>m is related to the rotating speed <strong>of</strong> the purge<br />
pump, which represents the infusion (purge) rate. A high major frequency means high infusion rate while<br />
low major frequency implies low infusion rate. Obtaining the major frequency from a wave<strong>for</strong>m in real-time<br />
usually requires computing the power spectrum <strong>of</strong> the wave<strong>for</strong>m (8), which requires a high-end<br />
microprocessor to execute the complicated algorithm. In order to save computation time, counting the<br />
number <strong>of</strong> zero-crossings <strong>of</strong> the instantaneous infusion pressure derivative within a certain period <strong>of</strong> time<br />
4
can be used instead. When the infusion pump is stopped, the variation <strong>of</strong> the infusion pressure<br />
measurement should be insignificant. This implies that a small amplitude <strong>of</strong> pressure derivative is an<br />
indication <strong>of</strong> infusion pump stoppage.<br />
The algorithm requires computing the time derivative <strong>of</strong> the pressure measurement. This calculation was<br />
implemented by backward Euler method (9),<br />
P(t<br />
K<br />
) - P(t<br />
K-1<br />
)<br />
P(t<br />
K<br />
) =<br />
T<br />
, (1)<br />
where P is the infusion pressure measurement and T is the sampling period.<br />
IV.<br />
Experiments<br />
A series <strong>of</strong> experiments were designed to identify the thresholds <strong>of</strong> the infusion pressure and its time<br />
derivative to the faults in the purge system. Six conditions, listed in the following,<br />
(1) Baseline: the purge system is operated normally,<br />
(2) Kinked infusion line: blockage in the infusion line at a normal purge pump speed,<br />
(3) Leaking infusion line: leakage in the infusion line at a normal purge pump speed,<br />
(4) <strong>Purge</strong> pump stoppage,<br />
(5) High infusion rate: the infusion rate is 25% higher than normal due to a high purge pump speed,<br />
(6) Low infusion rate: the infusion rate is 25% lower than normal due to a low purge pump speed,<br />
were created in the tests using a fluid circulation loop as shown in Figure 4. Data collected from these<br />
experiments were used to characterize the thresholds associated with the fault conditions. The rotational<br />
speed <strong>of</strong> the AB-180 CSS pump was controlled by the AB-180 controller. To assure normal operation <strong>of</strong><br />
this blood pump, a pressure transducer (Harvard Apparatus, Holliston, MA) and a flow sensor (Transonic<br />
<strong>System</strong>s, Ithaca, NY) were placed downstream from the pump <strong>for</strong> monitoring purpose. A tubing clamp<br />
was used to control the flow rate through the blood pump.<br />
Although the infusion rate is independent to the pressure (quantified as the mean infusion pressure)<br />
against the purge pump, the six test conditions as stated above were produced at the maximum and<br />
minimum infusion pressure so that the data collected from the experiments <strong>for</strong> developing the fault<br />
detection algorithm cover the entire pressure range <strong>of</strong> the infusion pump operation with the AB-180 CSS<br />
pump. The average infusion pressure is affected by the AB-180 CSS pump speed and the pressure<br />
difference across the blood pump. The infusion pressure is lower when the AB-180 CSS pump is<br />
operated at a higher speed due to the vacuum effect created by the blood pump. When the AB-180 CSS<br />
pump is operated at a constant speed, the infusion pressure is higher if the AB-180 CSS pumps less flow<br />
through the pump. There<strong>for</strong>e, the highest mean infusion pressure <strong>of</strong> a purge pump can be obtained by<br />
setting the AB-180 CSS pump at its minimum speed and fully occluding the blood pump outlet. The<br />
lowest mean infusion pressure <strong>of</strong> a purge pump occurs when the AB-180 pump is operated at its<br />
maximum speed with its outlet port fully open. In order to include the variations between blood pumps and<br />
controllers in the experimental data, four AB-180 CSS pumps and two controllers were used in the<br />
experiments. The infusion pump in each controller was pre-calibrated to the desired (normal, high, and<br />
low) infusion rate prior to the test. The infusion pressure was measured by a Transpac IV disposable<br />
pressure transducer (Abbott Laboratories, North Chicago, IL, USA) and acquired by a Windaq data<br />
acquisition system (Dataq Instruments, Akron, OH, USA) at the sampling rate <strong>of</strong> 1 Hz <strong>for</strong> 10 minutes at<br />
each test condition.<br />
5
Fluid<br />
Reservoir<br />
Flow<br />
Probe<br />
Tubing<br />
Clamp<br />
Flow<br />
Meter<br />
Pump<br />
Outlet<br />
Harvard<br />
Pressure<br />
Xducer<br />
AB-180<br />
CSS<br />
3-way<br />
Stopcock<br />
DAQ<br />
<strong>System</strong><br />
Pressure<br />
Xducer<br />
3-way<br />
Stopcock<br />
AB-180<br />
Controller<br />
Figure 4, Configuration <strong>of</strong> experiment setup<br />
Once the thresholds were determined, the fault detection algorithm was implemented in DasyLab<br />
(DasyTec, Amherst, NH, USA) with a data acquisition system (PCM-DAS16S/16, Computer Boards, Inc.,<br />
Mansfield, MA, USA). A different data acquisition system from the previous experiment was used to verify<br />
the consistency <strong>of</strong> the signal acquired by difference data acquisition hardware and processed by different<br />
s<strong>of</strong>tware. When a fault was detected by the algorithm, an alarm was activated by the s<strong>of</strong>tware with a<br />
message <strong>of</strong> the detected fault on the computer screen. This message was recorded to validate the<br />
effectiveness <strong>of</strong> the algorithm. The same experiments as described previously were repeated with four<br />
other AB-180 CSS pumps and two other controllers to validate the reliability and repeatability <strong>of</strong> the<br />
algorithm across different blood pumps and controllers.<br />
V. Results<br />
Equation (1) was implemented in MATLAB (Mathworks Inc., Natick, MA, USA) to calculate the time<br />
derivative <strong>of</strong> infusion pressure using data acquired in the experiments. Figure 5 shows the typical infusion<br />
pressure wave<strong>for</strong>m and its time derivative in normal operation. When the infusion line was obstructed, the<br />
infusion pressure gradually increased until it saturated the pressure sensor at 750 mmHg as shown in<br />
Figure 6(a). On the other hand, when the infusion line was leaking, the pressure measurement was lower<br />
than 20 mmHg in Figure 6(b). As the infusion pump stopped, the infusion pressure slowly decreased from<br />
the pressure level at the moment the pump stopped. This resulted in the amplitude <strong>of</strong> the pressure<br />
derivative approaching zero as shown in Figure 7.<br />
6
mmHg<br />
mmHg/sec<br />
Infusion Pressure<br />
390<br />
380<br />
370<br />
360<br />
350<br />
340<br />
330<br />
0 1 2 3 4 5 6 7 8 9 10<br />
10<br />
5<br />
0<br />
-5<br />
Pressure Derivative<br />
-10<br />
0 1 2 3 4 5 6 7 8 9 10<br />
minutes<br />
Figure 5, Infusion pressure and its time derivative wave<strong>for</strong>ms in baseline condition<br />
mmHg<br />
mmHg<br />
(a)<br />
800<br />
780<br />
760<br />
740<br />
720<br />
700<br />
0 1 2 3 4 5 6 7 8 9 10<br />
(b)<br />
16<br />
14<br />
12<br />
10<br />
8<br />
6<br />
0 1 2 3 4 5 6 7 8 9 10<br />
minutes<br />
Figure 6, Infusion pressure when the infusion tubing is (a) kinking; (b) leaking<br />
When the infusion rate was 25% higher than the normal rate, the number <strong>of</strong> zero-crossings <strong>of</strong> the<br />
pressure derivative was greater than the number counted at normal rate. On the other hand, when the<br />
infusion rate was 25% lower than the normal rate, the number <strong>of</strong> zero-crossings <strong>of</strong> the pressure derivative<br />
was less than the number counted at normal rate. Figure 8 shows the pressure derivatives at high,<br />
normal, and low infusion rate. Table 1 shows the average <strong>of</strong> experimental data obtained from 4 pumps<br />
operated by two controllers under the same test conditions. The fault detection thresholds, defined in<br />
Table 2, were obtained by characterizing the results in Table 1.<br />
7
mmHg<br />
380<br />
360<br />
340<br />
320<br />
300<br />
280<br />
260<br />
Infusion Pressure<br />
0 1 2 3 4 5 6 7 8 9 10<br />
mmHg/sec<br />
2<br />
0<br />
-2<br />
-4<br />
-6<br />
-8<br />
-10<br />
Pressure Derivative<br />
0 1 2 3 4 5 6 7 8 9 10<br />
minutes<br />
Figure 7, Infusion pressure and its time derivative wave<strong>for</strong>ms when infusion pump stopped<br />
Table 1, Test result summary<br />
Condition<br />
| P(t) |<br />
MAX<br />
Mean Infusion Pressure<br />
(mmHg)<br />
* No. <strong>of</strong> zero-crossings<br />
Baseline<br />
Kinking<br />
Leaking<br />
Pump <strong>of</strong>f<br />
High rate<br />
Low rate<br />
2200 rpm 6.10 226.75 45.0<br />
4500 rpm 4.04 158.75 45.8<br />
2200 rpm 0.00 750.00 0.0<br />
4500 rpm 0.00 750.00 0.0<br />
2200 rpm 2.21 12.00 137.5<br />
4500 rpm 2.56 11.75 160.3<br />
2200 rpm 0.32 159.25 221.3<br />
4500 rpm 0.41 78.50 117.0<br />
2200 rpm 9.52 385.75 55.3<br />
4500 rpm 5.81 162.25 55.3<br />
2200 rpm 5.03 213.50 34.0<br />
4500 rpm 3.57 151.50 34.0<br />
* Number <strong>of</strong> zero-crossings was counted <strong>for</strong> 10 minutes<br />
8
mmHg/sec<br />
mmHg/sec<br />
mmHg/sec<br />
10<br />
5<br />
0<br />
-5<br />
-10<br />
10<br />
5<br />
0<br />
-5<br />
-10<br />
10<br />
5<br />
0<br />
-5<br />
-10<br />
(a)<br />
0 1 2 3 4 5 6 7 8 9 10<br />
(b)<br />
0 1 2 3 4 5 6 7 8 9 10<br />
(c)<br />
0 1 2 3 4 5 6 7 8 9 10<br />
minutes<br />
Figure 8, Infusion pressure derivative: (a) high infusion rate; (b) normal; (c) low infusion rate<br />
Validation <strong>of</strong> the fault detection algorithm, described in Table 2, was per<strong>for</strong>med with four other pumps and<br />
two other controllers. The same experiment procedures described previously were repeated in the<br />
validation test. All the fault conditions created in the experiment were detectable by the algorithm with all<br />
test pumps and controllers. The average <strong>of</strong> the results using different pumps and controllers is<br />
summarized in Table 3. These results support the reliability <strong>of</strong> the fault detection algorithm and its<br />
robustness across pumps and controllers.<br />
Table 2, <strong>Rule</strong>s <strong>for</strong> infusion system fault detection<br />
<strong>Fault</strong><br />
Kinking<br />
Leaking<br />
Thresholds<br />
Mean pressure in a duration <strong>of</strong> 40 seconds is greater than 700 mmHg<br />
Mean pressure in a duration <strong>of</strong> 40 seconds is less than 20 mmHg<br />
Pump <strong>of</strong>f | P(t) |
Table 3, Summary <strong>of</strong> validation results<br />
Condition<br />
| P(t) |<br />
MAX<br />
Mean Infusion Pressure<br />
(mmHg)<br />
No. <strong>of</strong> zerocrossing<br />
<strong>Fault</strong> Detected<br />
Normal 9.71 167 45 No<br />
Kinking 0 750 0 Yes<br />
Leaking 1.17 -15 113 Yes<br />
Pump <strong>of</strong>f 0.82 99 10 Yes<br />
High rate 7.91 199 60 Yes<br />
Low rate 6.34 191 29 Yes<br />
VI.<br />
Discussions and Conclusions<br />
A fault detection algorithm was designed to monitor the operation <strong>of</strong> the purge system <strong>of</strong> the AB-180<br />
CSS. This algorithm uses the measured infusion pressure, calculates the pressure derivative, and then<br />
compare with the pre-defined thresholds to detect the possible faults in the purge system. Since the<br />
infusion pressure sensor is located in the controller unit, no invasive sensor is required <strong>for</strong> this algorithm.<br />
Additionally, implementing this algorithm in the controller does not require an expensive high-end<br />
processor because <strong>of</strong> its simplicity.<br />
Although all the fault conditions created in the validation experiment were detectable, nuisance alarms<br />
might be possible under certain conditions, particularly when a noisy infusion pressure signal is received.<br />
Infusion pressure is produced by the infusate flowing through the infusion tubing and the seal lip inside<br />
the pump. Infusion pressure could fall below the threshold when the seal lip is excessively worn. A worn<br />
seal could cause device damage and risk patient’s life. There<strong>for</strong>e, a nuisance alarm on the flow rate might<br />
serve as a monitor <strong>for</strong> the seal and the device safety. A non-smooth surface inside the infusion tubing<br />
could produce fluid turbulence and result in a noisy infusion pressure signal. Shifting the section <strong>of</strong> the<br />
infusion tubing, laced around the eccentric cam, regularly as suggested in the device operation manual<br />
can prevent the pressure noise due to a non-smooth tubing surface. The noise accompanied with the<br />
pressure derivative was not significant under normal pump operation because <strong>of</strong> a low sampling rate and<br />
a built-in low-pass filter in the pressure instrumentation circuitry. A digital low-pass filter (10) could be<br />
added to improve the quality <strong>of</strong> the pressure derivative signal if needed.<br />
The fault detection algorithm described herein is dedicated to the AB-180 CSS system. However, the<br />
same concept is applicable to other devices with similar type <strong>of</strong> pumping mechanism in which monitoring<br />
an extremely low flow rate is crucial but expensive, <strong>for</strong> example, insulin pumps and intravenous (IV)<br />
therapy devices.<br />
References<br />
1. Manning KB, Miller GE. Shaft/Shaft-Seal Interface Characteristics <strong>of</strong> a Multiple Disk Centrifugal Blood<br />
Pump. Artificial Organs. 1999; 23: 552-8.<br />
2. Sipin AJ, Bender B, Fabrey WJ, Keller R, Liu J, Olsen DB. <strong>Purge</strong> <strong>System</strong> <strong>for</strong> Rotary Blood Pumps.<br />
Artificial Organs. 1997; 21: 611-9.<br />
10
3. Jammu VB, Malanoski S, Walter T, Smith W. Condition Monitoring <strong>of</strong> Rotary Blood Pumps. ASAIO<br />
Journal. 1997; 43: M639-43.<br />
4. Butler KC, Dow JJ, Litwak P, Kormos RL, Borovetz HS. Development <strong>of</strong> the Nimbus/University <strong>of</strong><br />
Pittsburgh Innovative Ventricular Assist <strong>System</strong>. Annals <strong>of</strong> Thoracic Surgery. 1999; 68: 790-4.<br />
5. Kim HC, Park SK, Hindrichs HL, Bearnson GB, Khanwilkar PS, Olsen DB. Noninvasive Diagnosis <strong>of</strong><br />
Mechanical Failure <strong>of</strong> the Implanted Total Artificial Heart Using Neural Network Analysis <strong>of</strong> Acoustic<br />
Signals. ASAIO Journal. 1995; 41: M271-6.<br />
6. Lee SH, Min BG. Per<strong>for</strong>mance Evaluation <strong>of</strong> Implantable Artificial Organs by Sound Spectrum<br />
Analysis. ASAIO Journal. 1994; 40: M762-6.<br />
7. Griffin WP, Savage EB, Clark RE, Pacella JJ, Johnson GJ, Magovern JA, Magovern GJ, Sr.. AB-180<br />
Circulatory Support <strong>System</strong> Summary <strong>of</strong> Development and Phase I Clinical Trial. ASAIO Journal.<br />
1998; 44: M719-24.<br />
8. Mitra SK, Kaiser JF: Handbook <strong>for</strong> digital signal processing. New York: John Wiley and Sons, Inc.,<br />
1993: 1143-69.<br />
9. Shahian B, Hassul M. Control system design using MATLAB. Englewood Cliffs: Prentice Hall, Inc.,<br />
1993; 270-1.<br />
10. Orfanidis SJ. Introduction to signal processing. Englewood Cliffs: Prentice Hall, Inc., 1996; 604-14.<br />
11