ROI - Capgemini
ROI - Capgemini
ROI - Capgemini

Create successful ePaper yourself
Turn your PDF publications into a flip-book with our unique Google optimized e-Paper software.
SALES<br />
<strong>ROI</strong><br />
CASH-TO-CASH<br />
ECONOMIC VALUE ADDED<br />
DEMAND SIGNALS<br />
PARTNER NETWORK DISCIPLINED PLANNING<br />
DEMAND SENSINGPROMOTION OPTIMIZATION<br />
<strong>ROI</strong> <strong>ROI</strong><br />
<strong>ROI</strong><br />
<strong>ROI</strong><br />
FINANCIAL FRAMEWORK<br />
TRADE PROMOTION<br />
OPTIMIZATIONSUCCESS<br />
SALES COLLABORATION<br />
DEMAND<br />
SENSING<br />
TRADE FUNDING<br />
FUNDING STRATEGIES<br />
SALES VOLUME<br />
FORECAST ACCURACY<br />
OPTIMAL SPEND<br />
CATEGORY INNOVATIONS<br />
PERFORMANCE INDICATORS<br />
<strong>ROI</strong><br />
<strong>ROI</strong><br />
OPTIMAL<br />
<strong>ROI</strong><br />
<strong>ROI</strong><br />
SPEND<br />
<strong>ROI</strong><br />
<strong>ROI</strong><br />
<strong>ROI</strong><br />
<strong>ROI</strong> <strong>ROI</strong><br />
<strong>ROI</strong><br />
<strong>ROI</strong><br />
<strong>ROI</strong><br />
<strong>ROI</strong> <strong>ROI</strong><br />
<strong>ROI</strong><br />
<strong>ROI</strong><br />
<strong>ROI</strong> <strong>ROI</strong><br />
<strong>ROI</strong><br />
<strong>ROI</strong> <strong>ROI</strong><br />
<strong>ROI</strong><br />
<strong>ROI</strong><br />
<strong>ROI</strong><br />
OPTIMAL<br />
<strong>ROI</strong><br />
<strong>ROI</strong><br />
SPEND<br />
<strong>ROI</strong><br />
<strong>ROI</strong><br />
<strong>ROI</strong> <strong>ROI</strong><br />
<strong>ROI</strong><br />
<strong>ROI</strong><br />
<strong>ROI</strong> <strong>ROI</strong><br />
<strong>ROI</strong><br />
<strong>ROI</strong><br />
<strong>ROI</strong><br />
<strong>ROI</strong><br />
<strong>ROI</strong> <strong>ROI</strong><br />
<strong>ROI</strong><br />
MARKETING MIX<br />
SALES COLLABORATION<br />
OPTIMAL SPEND<br />
CATEGORY INNOVATIONS<br />
THE FINANCIAL FRAMEWORK FOR TRADE PROMOTION OPTIMIZATION SUCCESS<br />
BUILDING THE FOUNDATION FOR RETURN ON TRADE INVESTMENT<br />
1
CONTENTS CONTENTS<br />
CONTEN<br />
2<br />
SALES<br />
<strong>ROI</strong><br />
CASH-TO-CASH<br />
ECONOMIC VALUE ADDED<br />
DEMAND SIGNALS<br />
PARTNER NETWORK DISCIPLINED PLANNING<br />
DEMAND SENSINGPROMOTION OPTIMIZATION<br />
<strong>ROI</strong> <strong>ROI</strong><br />
<strong>ROI</strong><br />
<strong>ROI</strong><br />
FINANCIAL FRAMEWORK<br />
TRADE PROMOTION<br />
OPTIMIZATIONSUCCESS<br />
SALES COLLABORATION<br />
DEMAND<br />
SENSING<br />
TRADE FUNDING<br />
FUNDING STRATEGIES<br />
SALES VOLUME<br />
FORECAST ACCURACY<br />
OPTIMAL SPEND<br />
CATEGORY INNOVATIONS<br />
PERFORMANCE INDICATORS<br />
<strong>ROI</strong><br />
<strong>ROI</strong><br />
OPTIMAL<br />
<strong>ROI</strong><br />
<strong>ROI</strong><br />
SPEND<br />
<strong>ROI</strong><br />
<strong>ROI</strong><br />
<strong>ROI</strong><br />
<strong>ROI</strong> <strong>ROI</strong><br />
<strong>ROI</strong><br />
<strong>ROI</strong><br />
<strong>ROI</strong><br />
<strong>ROI</strong> <strong>ROI</strong><br />
<strong>ROI</strong><br />
<strong>ROI</strong><br />
<strong>ROI</strong> <strong>ROI</strong><br />
<strong>ROI</strong><br />
<strong>ROI</strong> <strong>ROI</strong><br />
<strong>ROI</strong><br />
<strong>ROI</strong><br />
<strong>ROI</strong><br />
OPTIMAL<br />
<strong>ROI</strong><br />
<strong>ROI</strong><br />
SPEND<br />
<strong>ROI</strong><br />
<strong>ROI</strong><br />
<strong>ROI</strong> <strong>ROI</strong><br />
<strong>ROI</strong><br />
<strong>ROI</strong><br />
<strong>ROI</strong> <strong>ROI</strong><br />
<strong>ROI</strong><br />
<strong>ROI</strong><br />
<strong>ROI</strong><br />
<strong>ROI</strong><br />
<strong>ROI</strong> <strong>ROI</strong><br />
<strong>ROI</strong><br />
MARKETING MIX<br />
SALES COLLABORATION<br />
OPTIMAL SPEND<br />
CATEGORY INNOVATIONS
CONTENTS<br />
CONTENTS<br />
TS<br />
CONTENTS<br />
CONTENTS<br />
CONTENTS<br />
CONTENTS<br />
CONTENTS<br />
CONTENTS<br />
CONTENTS<br />
CONTENTS<br />
CONTENTS<br />
CONTENTS<br />
CONTENTS<br />
CONTENTS<br />
CONTENTS<br />
CONTENTS<br />
CONTENTS<br />
CONTENTS<br />
CONTENTS<br />
CONTENTS<br />
CONTENTS<br />
CONTENTS<br />
CONTENTS<br />
CONTENTS<br />
CONTENTS<br />
CONTENTS<br />
CONTENTS<br />
CONT<br />
CONTEN<br />
CONTENTS<br />
Acknowledgments................................................................................................................................... 5<br />
Executive Overview................................................................................................................................. 6<br />
Study Methodology..................................................................................................................7<br />
Understanding and Addressing Today’s Trade Promotion Optimization (TPO) Challenges..................... 8<br />
Survey Findings.......................................................................................................................8<br />
Common Practices Exist Across the Industry...........................................................................8<br />
Differences in Practice Based on Size and Complexity............................................................11<br />
Research Identifies Emerging Themes....................................................................................13<br />
From Emerging Themes to Guiding Principles.......................................................................14<br />
Integrated Financial and Trade Planning: Perspectives and Approaches...............................................16<br />
Lessons Learned in Budgeting and Planning..........................................................................16<br />
Understanding the ‘As-Is’......................................................................................................17<br />
Defining the ‘To-Be’..............................................................................................................19<br />
Bridging the Gaps and Executing the Vision..........................................................................22<br />
Learning and Adjusting.........................................................................................................23<br />
The Big Ideas..........................................................................................................................................24<br />
Financial Framework Defined................................................................................................24<br />
Demand-Driven Enterprise....................................................................................................24<br />
Components of the Demand-Driven Enterprise.....................................................................26<br />
Integration Architecture.........................................................................................................29<br />
Conclusion............................................................................................................................................. 30<br />
The Influence of Sound Planning on TPO and Enterprise Results..........................................30<br />
Trade Planning and Execution Post-Adoption of TPO............................................................31<br />
How Teams Operate and Compete Differently After TPO Adoption.......................................33<br />
About the Sponsors............................................................................................................................... 35<br />
© 2011 Promotion Optimization Institute and <strong>Capgemini</strong>. All rights reserved.<br />
3
Acknowle<br />
Acknow<br />
Acknowledgm<br />
Acknowledgmen<br />
S<br />
G<br />
IMIZATION DEMAND SENSING<br />
AL SPEND<br />
<strong>ROI</strong><br />
SALES COLLABORATION<br />
FRAMEWORK<br />
4<br />
DEMAND<br />
SENSING<br />
<strong>ROI</strong><br />
CASH-TO-CASH<br />
ECONOMIC VALUE ADDED<br />
PARTNER NETWORK<br />
TING MIX<br />
X<br />
ING<br />
G STRATEGIES<br />
SALES VOLUME<br />
FORECAST ACCURACY<br />
OPTIMAL SPEND<br />
CATEGORY INNOVATIONS<br />
ANCE INDICATORS<br />
<strong>ROI</strong> <strong>ROI</strong> <strong>ROI</strong><br />
<strong>ROI</strong> <strong>ROI</strong><br />
<strong>ROI</strong><br />
<strong>ROI</strong><br />
<strong>ROI</strong><br />
<strong>ROI</strong><br />
OPTIMAL<br />
<strong>ROI</strong><br />
<strong>ROI</strong><br />
SPEND<br />
<strong>ROI</strong><br />
<strong>ROI</strong> <strong>ROI</strong><br />
<strong>ROI</strong><br />
<strong>ROI</strong><br />
<strong>ROI</strong> <strong>ROI</strong><br />
<strong>ROI</strong><br />
<strong>ROI</strong><br />
<strong>ROI</strong> <strong>ROI</strong><br />
<strong>ROI</strong><br />
SALES
dgments<br />
Acknowledgments Acknowledgments<br />
A c k n o w l e d g m e n t s<br />
Acknowledgments Acknowledgments<br />
ledgments<br />
Acknowledgments<br />
ts<br />
ents<br />
Acknowledgments<br />
Ackno<br />
Acknowledgme<br />
Acknowledgments<br />
Acknowledgments<br />
The Promotion Optimization Institute (POI) would like to thank the <strong>Capgemini</strong> team for the opportunity<br />
to collaborate on this research and for its members’ valuable support and assistance in developing this indepth<br />
report on a topic that is critical to the success of consumer products companies, retailers and their<br />
shared shoppers/customers.<br />
A special thanks to POI members for their engagement (study participation, interviews) and the POI<br />
Educational Advisory Board for their active involvement and input with the study, and throughout<br />
the research effort.<br />
POI would like to express its gratitude to the following members of the “Financial Framework for Trade<br />
Promotion Optimization Success” team:<br />
Michael Kantor, MBA, CEO and Founder, Promotion Optimization Institute, LLC<br />
Alex Kushnir, Principal, Consumer Products, Retail and Distribution, <strong>Capgemini</strong><br />
Bruce Pagliuca, Principal, Consumer Products, Retail and Distribution, <strong>Capgemini</strong><br />
Bob Fassett, VP, North America Consumer Products, Retail and Distribution Leader, <strong>Capgemini</strong><br />
Renee Duvall, Associate Director, North America Marketing, <strong>Capgemini</strong><br />
Priscilla Donegan, Marketing Director, Global Consumer Products, Retail and Distribution, <strong>Capgemini</strong><br />
POI would also like to thank the leading manufacturers, retailers and solution partners for their<br />
perspectives on the financial aspects of Trade Promotion Optimization.<br />
Special thanks to Vivek Sharma, Ashish Sakarkar and Swanand Ranade of the <strong>Capgemini</strong> North<br />
America Research Team for their expertise, attention to detail and professionalism.<br />
Most of all, POI and <strong>Capgemini</strong> thank the many consumer goods manufacturing and retailing executives<br />
who shared their time and expertise with us for this effort. Their collective wisdom, experience, focus and<br />
collaboration made this research and report successful.<br />
5
<strong>ROI</strong><br />
<strong>ROI</strong><br />
<strong>ROI</strong><br />
<strong>ROI</strong><br />
<strong>ROI</strong><br />
<strong>ROI</strong> <strong>ROI</strong><br />
<strong>ROI</strong><br />
<strong>ROI</strong><br />
<strong>ROI</strong><br />
<strong>ROI</strong><br />
<strong>ROI</strong><br />
<strong>ROI</strong><br />
<strong>ROI</strong><br />
<strong>ROI</strong><br />
<strong>ROI</strong><br />
<strong>ROI</strong> <strong>ROI</strong><br />
<strong>ROI</strong><br />
<strong>ROI</strong><br />
<strong>ROI</strong><br />
<strong>ROI</strong><br />
<strong>ROI</strong><br />
<strong>ROI</strong><br />
<strong>ROI</strong><br />
<strong>ROI</strong><br />
<strong>ROI</strong><br />
<strong>ROI</strong><br />
<strong>ROI</strong> <strong>ROI</strong><br />
<strong>ROI</strong><br />
<strong>ROI</strong><br />
<strong>ROI</strong><br />
<strong>ROI</strong><br />
<strong>ROI</strong><br />
<strong>ROI</strong><br />
<strong>ROI</strong><br />
<strong>ROI</strong><br />
<strong>ROI</strong><br />
<strong>ROI</strong> <strong>ROI</strong><br />
<strong>ROI</strong><br />
<strong>ROI</strong><br />
<strong>ROI</strong><br />
<strong>ROI</strong><br />
<strong>ROI</strong><br />
executive<br />
executiv<br />
OPTIMAL SPEND<br />
DEMAND<br />
SENSING<br />
CATEGORY INNOVATIONS<br />
PERFORMANCE INDICATORS<br />
<strong>ROI</strong><br />
<strong>ROI</strong><br />
<strong>ROI</strong> <strong>ROI</strong><br />
<strong>ROI</strong><br />
<strong>ROI</strong> <strong>ROI</strong><br />
OPTIMAL<br />
OPTIMAL<br />
SPEND<br />
SPEND<br />
<strong>ROI</strong> <strong>ROI</strong><br />
<strong>ROI</strong> <strong>ROI</strong><br />
THE FINANCIAL FRAMEWORK FOR TRADE PROMOTION OPTIMIZATION SUCCESS<br />
BUILDING THE FOUNDATION FOR RETURN ON TRADE INVESTMENT<br />
<strong>ROI</strong><br />
<strong>ROI</strong> <strong>ROI</strong> <strong>ROI</strong><br />
<strong>ROI</strong><br />
<strong>ROI</strong><br />
<strong>ROI</strong><br />
<strong>ROI</strong><br />
<strong>ROI</strong> <strong>ROI</strong> <strong>ROI</strong><br />
SALES<br />
<strong>ROI</strong><br />
CASH-TO-CASH<br />
ECONOMIC VALUE ADDED<br />
DEMAND SIGNALS<br />
PARTNER NETWORK DISCIPLINED PLANNING<br />
DEMAND SENSINGPROMOTION OPTIMIZATION<br />
FINANCIAL FRAMEWORK<br />
TRADE PROMOTION<br />
OPTIMIZATIONSUCCESS<br />
SALES COLLABORATION TRADE FUNDING<br />
FUNDING STRATEGIES<br />
SALES VOLUME<br />
FORECAST ACCURACY<br />
OPTIMAL SPEND<br />
DEMAND<br />
SENSING<br />
CATEGORY INNOVATIONS<br />
SALES COLLABORATION<br />
MARKETING MIX<br />
PERFORMANCE INDICATORS<br />
<strong>ROI</strong><br />
<strong>ROI</strong><br />
<strong>ROI</strong> <strong>ROI</strong><br />
<strong>ROI</strong><br />
OPTIMAL<br />
SPEND<br />
<strong>ROI</strong> <strong>ROI</strong><br />
<strong>ROI</strong><br />
<strong>ROI</strong> <strong>ROI</strong> <strong>ROI</strong><br />
<strong>ROI</strong> <strong>ROI</strong><br />
<strong>ROI</strong><br />
OPTIMAL<br />
SPEND<br />
<strong>ROI</strong> <strong>ROI</strong><br />
<strong>ROI</strong><br />
<strong>ROI</strong><br />
<strong>ROI</strong><br />
<strong>ROI</strong> <strong>ROI</strong> <strong>ROI</strong><br />
OPTIMAL SPEND<br />
CATEGORY INNOVATIONS<br />
Executive Overview<br />
The proliferation of social media, mobile marketing and shopper marketing have fragmented marketing<br />
goals and added complexity to the quest for optimizing trade spend and return on investment. Sales,<br />
Marketing and Finance are bombarded daily with hundreds of trade investment decisions and must<br />
deliver with trading partners through all types of media. Too many of these efforts fail decisions and<br />
to hit their targets. Additionally, opportunity cost occurs when investments are made in the wrong<br />
events/promotions due to tightly constrained human resources and budgets.<br />
Greater success can clearly be tied to those organizations/teams<br />
that are better aligned across Finance, Sales and Marketing,<br />
including funding strategies to support their goals.<br />
When it comes to forecasting, planning and executing promotional investments with trading partners,<br />
few executives across Sales and Marketing have as clear a picture as do those in other functions (such as<br />
Finance and Operations). In some cases, they suspect missed opportunities and suboptimal spending/<br />
investment. The need for improved clarity is essential given the ongoing challenges of trade and shopper<br />
marketing (for example, commodity price variations), combined with the fact that many companies still<br />
plan in spreadsheets. To help provide that clarity, POI, together with <strong>Capgemini</strong>, is pleased to present this<br />
study and new approach entitled, “The Financial Framework for Trade Promotion Optimization Success.”<br />
Before consumer goods companies can determine the effectiveness of their marketing spend, they<br />
must have a sound financial framework in place to accurately budget, plan and forecast especially<br />
on promotions. Only then can executives align internal, then external partners to assess the right<br />
marketing mix (including social media and digital), pricing and offers to optimize promotional <strong>ROI</strong>.<br />
The results of this study indicate that greater success can clearly be tied to those organizations/<br />
teams that are better aligned with process and funding strategies across Finance, Sales and<br />
Marketing. While most organizations have established and effectively communicated return on<br />
investment across teams, other financial measures critical to enterprise success such as cash-to-cash<br />
cycle and Economic Value Added are less frequently addressed. Yet they bring substantial clarity<br />
when put into the context of trade investment across teams and brands.<br />
6<br />
Cash-to-cash cycle (C2C) is largely used as a financial performance metric signifying how well the<br />
overall enterprise is managing its capital. As we look at promotional investment, we should consider<br />
the period that a company’s trade dollars and other resources are committed and spent, before that<br />
money is finally returned at settlement and/or when customers pay for the products sold.
<strong>ROI</strong><br />
<strong>ROI</strong><br />
<strong>ROI</strong> <strong>ROI</strong><br />
<strong>ROI</strong><br />
<strong>ROI</strong><br />
<strong>ROI</strong><br />
<strong>ROI</strong><br />
<strong>ROI</strong><br />
executive overview<br />
overview<br />
e overview<br />
executive overview<br />
executive overview<br />
execu<br />
e x e c u t i v e o v e rv i e w<br />
executive overview executiveoverview<br />
executive executive ove<br />
executive overvi<br />
executive overview<br />
The common use of Economic Value Added (EVA) is to indicate to an investor if the enterprise<br />
seems to be “adding value” for the shareholders or if it is deemed to be “destroying value.”<br />
When the calculation is applied to trade investment, all stakeholders (Sales, Marketing, S&OP,<br />
Merchandising, etc.) will better understand the impact (i.e., “adding value” or “destroying value”)<br />
for brands, categories and stores, (e.g. volume, share, profit, trips/trip productivity and basket<br />
volume/profitability). EVA will also consider the opportunity cost when making poor promotional<br />
investment decisions.<br />
This study addresses these issues and specifically demonstrates:<br />
• How current budgeting processes and effectiveness vary across consumer goods companies<br />
(for example, top down, bottom up processes, combination of market analysis and<br />
statistical modeling, etc.)<br />
• Effective trade funding methods that drive profitable growth<br />
• How companies with trading partners execute against plan to achieve success<br />
This report leads you and your team through an appreciation for the right financial framework<br />
(budgets, accruals, forecasts, alignment, etc.) to accurately quantify the success of Trade Promotion<br />
Optimization (TPO) and make more informed trade decisions. Additionally, it will help you<br />
understand the requisite capabilities needed to develop the framework inside your organization, and<br />
suggest a set of guiding principles to achieve its implementation.<br />
Study Methodology<br />
The analysis and counsel that appear in this report reflect input from more than 55 tier-one<br />
and tier-two companies in the consumer packaged goods (CPG)/food and beverage industry.<br />
The study team also conducted an extensive POI/<strong>Capgemini</strong> survey, which included Trade<br />
Marketing, Sales/Sales Strategy, Finance, Planning and Category Management executives to<br />
gain a cross-functional understanding of the issues. Participants were primarily at the vice<br />
president and senior management level. Additionally, the team drew upon analysis of publicly<br />
reported company data and other published materials.<br />
While enterprise resource planning (ERP) systems play an important role in trade promotion<br />
effectiveness, they are in many cases just part of a complete solution. Our research explores<br />
the impact of financial and planning processes on trade spend effectiveness, establishes a<br />
framework for success, and looks at how sound planning processes can ensure support and<br />
delivery of a customer-centric model. It also identifies some best practices around sales and<br />
marketing automation that can dramatically improve collaborative marketing and accelerate<br />
success when adopting a Demand-Driven Enterprise approach.<br />
SALES<br />
<strong>ROI</strong><br />
CASH-TO-CASH<br />
ECONOMIC VALUE ADDED<br />
PARTNER NETWORK<br />
DEMAND SENSINGPROMOT<br />
FINANCIAL FRA<br />
TRADE PRO<br />
OPTIMIZATION<br />
SALES COLLABORATION TR<br />
FUNDING STR<br />
SALES VOLUME<br />
FORECAST ACCURACY<br />
OPTIMAL SPEND<br />
DEMAND<br />
SENSING<br />
CATEGORY INNOVATIONS<br />
PERFORMANCE IN<br />
<strong>ROI</strong><br />
<strong>ROI</strong><br />
<strong>ROI</strong> <strong>ROI</strong><br />
<strong>ROI</strong> <strong>ROI</strong><br />
OPTIMAL<br />
SPEND<br />
<strong>ROI</strong><br />
<strong>ROI</strong><br />
<strong>ROI</strong><br />
<strong>ROI</strong><br />
<strong>ROI</strong><br />
<strong>ROI</strong> <strong>ROI</strong> <strong>ROI</strong><br />
7
<strong>ROI</strong><br />
<strong>ROI</strong><br />
<strong>ROI</strong><br />
<strong>ROI</strong><br />
<strong>ROI</strong><br />
<strong>ROI</strong> <strong>ROI</strong><br />
<strong>ROI</strong><br />
<strong>ROI</strong><br />
<strong>ROI</strong><br />
<strong>ROI</strong><br />
<strong>ROI</strong><br />
<strong>ROI</strong><br />
<strong>ROI</strong><br />
<strong>ROI</strong><br />
<strong>ROI</strong><br />
<strong>ROI</strong> <strong>ROI</strong><br />
<strong>ROI</strong><br />
<strong>ROI</strong><br />
<strong>ROI</strong><br />
<strong>ROI</strong><br />
<strong>ROI</strong><br />
<strong>ROI</strong><br />
<strong>ROI</strong><br />
<strong>ROI</strong><br />
<strong>ROI</strong><br />
<strong>ROI</strong><br />
<strong>ROI</strong> <strong>ROI</strong><br />
<strong>ROI</strong><br />
<strong>ROI</strong><br />
<strong>ROI</strong><br />
<strong>ROI</strong><br />
<strong>ROI</strong><br />
<strong>ROI</strong><br />
<strong>ROI</strong><br />
<strong>ROI</strong><br />
<strong>ROI</strong><br />
<strong>ROI</strong> <strong>ROI</strong><br />
<strong>ROI</strong><br />
<strong>ROI</strong><br />
<strong>ROI</strong><br />
<strong>ROI</strong><br />
<strong>ROI</strong><br />
OPTIMAL SPEND<br />
DEMAND<br />
SENSING<br />
CATEGORY INNOVATIONS<br />
PERFORMANCE INDICATORS<br />
<strong>ROI</strong><br />
<strong>ROI</strong><br />
<strong>ROI</strong> <strong>ROI</strong><br />
<strong>ROI</strong><br />
<strong>ROI</strong> <strong>ROI</strong><br />
OPTIMAL<br />
OPTIMAL<br />
SPEND<br />
SPEND<br />
<strong>ROI</strong> <strong>ROI</strong><br />
<strong>ROI</strong> <strong>ROI</strong><br />
THE FINANCIAL FRAMEWORK FOR TRADE PROMOTION OPTIMIZATION SUCCESS<br />
BUILDING THE FOUNDATION FOR RETURN ON TRADE INVESTMENT<br />
<strong>ROI</strong><br />
<strong>ROI</strong> <strong>ROI</strong> <strong>ROI</strong><br />
<strong>ROI</strong><br />
<strong>ROI</strong><br />
<strong>ROI</strong><br />
<strong>ROI</strong><br />
<strong>ROI</strong> <strong>ROI</strong> <strong>ROI</strong><br />
SALES<br />
<strong>ROI</strong><br />
CASH-TO-CASH<br />
ECONOMIC VALUE ADDED<br />
DEMAND SIGNALS<br />
PARTNER NETWORK DISCIPLINED PLANNING<br />
DEMAND SENSINGPROMOTION OPTIMIZATION<br />
FINANCIAL FRAMEWORK<br />
TRADE PROMOTION<br />
OPTIMIZATIONSUCCESS<br />
SALES COLLABORATION TRADE FUNDING<br />
FUNDING STRATEGIES<br />
SALES VOLUME<br />
FORECAST ACCURACY<br />
OPTIMAL SPEND<br />
DEMAND<br />
SENSING<br />
CATEGORY INNOVATIONS<br />
SALES COLLABORATION<br />
MARKETING MIX<br />
PERFORMANCE INDICATORS<br />
<strong>ROI</strong><br />
<strong>ROI</strong><br />
<strong>ROI</strong> <strong>ROI</strong><br />
<strong>ROI</strong><br />
OPTIMAL<br />
SPEND<br />
<strong>ROI</strong> <strong>ROI</strong><br />
<strong>ROI</strong><br />
<strong>ROI</strong> <strong>ROI</strong> <strong>ROI</strong><br />
<strong>ROI</strong> <strong>ROI</strong><br />
<strong>ROI</strong><br />
OPTIMAL<br />
SPEND<br />
<strong>ROI</strong> <strong>ROI</strong><br />
<strong>ROI</strong><br />
<strong>ROI</strong><br />
<strong>ROI</strong><br />
<strong>ROI</strong> <strong>ROI</strong> <strong>ROI</strong><br />
OPTIMAL SPEND<br />
CATEGORY INNOVATIONS<br />
Understanding and Addressing Today’s Trade Promotion<br />
Optimization (TPO) Challenges<br />
Understanding how to influence consumer demand has long been a major goal for the consumer<br />
goods industry. However, in recent years, the practice of brand building to increase distribution has<br />
become more complex. The development and dominance of national (and increasingly international)<br />
retailers, the advent of digital ubiquity, and the increase in social media and interaction have<br />
exponentially increased complexity. This presents consumer products manufacturers with new<br />
obstacles to executing trade programs as well as increased costs. It also presents companies with<br />
revolutionary opportunities to improve the effectiveness of how they interact with consumers.<br />
Survey Findings<br />
To get a better view of both the obstacles and the opportunities, POI and <strong>Capgemini</strong> conducted<br />
an industry study, focused on Trade Promotion Optimization. The purpose of the research was<br />
to understand the effectiveness of current practices around financial budgeting, planning and<br />
forecasting and how they are evolving to meet the new challenges. The majority of the survey<br />
participants were manufacturers in the food and grocery segment, with the remaining fast-moving<br />
consumer goods (FMCG) segments proportionally represented.<br />
The respondents are actively involved with trade promotions management (84%), and almost<br />
95% are are executives, directors, or in-line managers. Among the respondents, 64% work in<br />
companies with more than $2 billion in revenues, with the smallest organizations having revenues<br />
of $500 million. The responses confirm that the challenges are industry-wide, and that executives,<br />
regardless of company size, are focusing on the issue of trade promotion effectiveness.<br />
Common Practices Exist Across the Industry<br />
While the gold standard of trade funds planning argues for a high level of coordination, in reality<br />
the processes in place are often influenced by the size of the manufacturer. However, the study<br />
found some practices common among all manufacturers regardless of size. So, while there is<br />
much opportunity for improvement, the good news is that we are not starting from scratch. These<br />
common practices serve as a foundation upon which to build.<br />
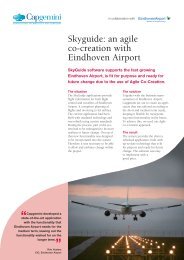
Budgeting methodology. Regardless of company size there is a fairly even split between topdown<br />
and bottom-up approaches, with business intelligence coming from Sales and input from<br />
Operations. Getting the right balance is the goal, regardless of which approach drives the process.<br />
8
understanding and addressingUnderstanding and<br />
Understanding and Addressing Tod<br />
Understanding and<br />
today’s tpo challenges<br />
Figure 1: Budgeting Methodology Mixed<br />
Source: POI and <strong>Capgemini</strong><br />
Through a combination of market analysis<br />
and statistical modeling<br />
5.5%<br />
5.0%<br />
Integration of Demand Forecasting<br />
and Sales Forecasting<br />
7.5%<br />
16.7%<br />
Other<br />
5.6%<br />
15.0%<br />
Start with current year budget<br />
and make adjustments as needed<br />
16.7%<br />
17.5%<br />
Bottom-up - Participative Development,<br />
Sales & Operations<br />
22.2%<br />
22.5%<br />
Top-down planning of trade spending budgets<br />
33.3%<br />
32.5%<br />
0% 5% 10% 15% 20% 25% 30% 35%<br />
< 2Bn revenues > 2Bn revenues<br />
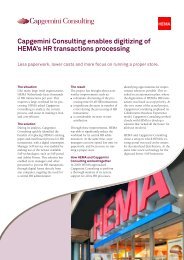
Account funding determination. Regardless of company size, an accrual funding methodology with<br />
live rates is most commonly used, cited by more than half of the respondents.<br />
Figure 2: Accrual Funding Based on Live Rates<br />
Source: POI and <strong>Capgemini</strong><br />
Fixed funds provided to accounts, based on<br />
historical spending<br />
1.7%<br />
Don't know<br />
3.4%<br />
Accrual fund based on prior year shipments<br />
5.2%<br />
Accrual funds based on consumption<br />
(from scanner data)<br />
Accrual funds based on shipments and “kicker”<br />
(i.e., additional fund after a pre-defined volume threshold)<br />
5.2%<br />
8.6%<br />
Others<br />
20.7%<br />
Accrual fund based on live/current year shipments<br />
55.2%<br />
0% 10% 20% 30% 40% 50% 60%<br />
9
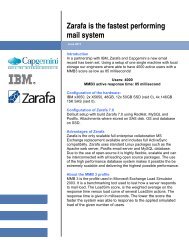
Fund allocation decision ownership and participation. Sales, Marketing and Trade Marketing drive<br />
the allocation of funds to the account level; Finance and Category Management are involved to a<br />
lesser extent. This was the case regardless of company size. Cooperation among departments is the<br />
industry norm, although the specific departments involved may vary depending on company size.<br />
Figure 3: Sales, Trade Marketing and Marketing Drive Trade Funding<br />
Source: POI and <strong>Capgemini</strong><br />
Supply Chain<br />
Consumer<br />
Other<br />
Demand Planning<br />
1.8%<br />
3.5%<br />
3.5%<br />
8.8%<br />
Category Management<br />
21.1%<br />
Finance<br />
Sales Finance<br />
50.9%<br />
52.6%<br />
Marketing<br />
Trade Marketing<br />
64.9%<br />
71.9%<br />
Sales<br />
84.2%<br />
0%<br />
10% 20% 30% 40% 50% 60% 70% 80% 90%<br />
Design and communication of objectives/KPIs. <strong>ROI</strong> is broadly used, while cash flow KPIs are either<br />
used to a lesser extent or are not defined as key. Economic Value Added may suggest the next area<br />
of focus. Based on our experience, this is often dictated by constraints in data availability and<br />
analytics coordination.<br />
From the foundation of TPM, movement to TPO is no longer<br />
just a business differentiator, but an essential requirement to<br />
compete effectively.<br />
Technology platforms. Standardized planning with KPIs and scorecards represents the majority of<br />
the deployed capabilities, with lesser emphasis on inter-functional integration and collaboration.<br />
Use of technology is broad, but the consistency, depth and integration vary. While there is good<br />
news here, most dashboards are backward looking and siloed. They have not been operationalized<br />
to assist in getting the right “mix” of spend decisions.<br />
10
understanding and addressingUnderstanding and<br />
Understanding and Addressing Tod<br />
Understanding and<br />
today’s tpo challenges<br />
Need for analytics. All respondents say it is essential to determine the right forecasting method.<br />
However, while there is agreement on the need for forecast accuracy, there is less agreement on<br />
usage of, and dependence on, integrating forecasts and scenario analysis with different internal and<br />
external stakeholders.<br />
Differences in Practice Based on Size and Complexity<br />
While it is clear that some industry norms have developed, significant differences in practice<br />
continue to exist based on a company’s size and complexity.<br />
Goals, strategy and tools alignment. Respondents from large CPG manufacturers ($2 billion+<br />
revenues) indicated there is an alignment among departments, as well as reporting capabilities to<br />
combine multiple financial tracking and reconciliation of KPIs. However, smaller organizations (less<br />
than $2 billion revenues) reported less alignment between headquarters and Field Sales, and lessthan-adequate<br />
reporting capabilities for financial tracking and reconciliation across functions. The<br />
reasons for this may include a lack of tools, less availability of data, or the need for more flexibility<br />
due to capacity constraints.<br />
Sales forecasting, budgeting and planning. Smaller CPG manufacturers use and trust syndicated<br />
data. Also, forecast accuracy and promotion lift models are generally accepted. Larger CPG<br />
companies seem to have better processes and tools to analyze trade spend effectiveness as an input<br />
into the financial budgeting process. Respondents had mixed views about the incorporation of<br />
shopper insights into forecasting. We expect that the increasing availability of technology at lower<br />
price points will close this gap.<br />
Figure 4: Sales Forecasting, Budgeting and Planning<br />
Source: POI and <strong>Capgemini</strong><br />
The baseline sales estimates we receive through<br />
our syndicated data suppliers are accurate.<br />
15.8%<br />
29.8%<br />
36.8%<br />
15.8%<br />
1.8%<br />
Our promotion lift models are accurate (to an<br />
acceptable degree).<br />
8.8%<br />
42.1%<br />
15.8%<br />
26.3%<br />
7.0%<br />
We have a regular process, corporately, where<br />
we analyze promotional effectiveness and make<br />
the necessary changes to our future plans<br />
based on that analysis.<br />
21.1%<br />
21.1%<br />
35.1%<br />
12.3%<br />
10.5%<br />
Our current planning processes can support the<br />
delivery of a customer-centric<br />
shopping experience.<br />
5.3%<br />
28.1%<br />
28.1%<br />
22.8%<br />
15.8%<br />
0% 20% 40% 60% 80% 100%<br />
1 2 3 4 5<br />
1-Totally Agree and 5-Totally Disagree<br />
11
Top three KPIs. While respondents agreed that profit, revenue and <strong>ROI</strong> are the most important KPIs<br />
to track progress against plan, forecast accuracy is more important for smaller CPG manufacturers.<br />
Perhaps this is because there is a smaller asset base, which places greater emphasis on supply chain<br />
effectiveness, or because metrics are readily available from current Trade Promotion Management<br />
(TPM) systems and processes. While all three KPIs are important, progressive companies are moving<br />
beyond these basics. By measuring the cash-to-cash cycle, Economic Value Added, decrease in overall<br />
trade spend, trade vs. marketing <strong>ROI</strong> and in-season variance to plan, these companies are leveraging<br />
their investments in a more agile supply capability to respond to market variations as they occur.<br />
Figure 5: Top KPIs Used to Track Progress Against Plan<br />
Source: POI and <strong>Capgemini</strong><br />
Decrease in time spent<br />
Other<br />
0.0%<br />
2.6%<br />
5.0%<br />
10.5%<br />
Decrease in trade spend<br />
Better forecast accuracy<br />
23.7%<br />
30.0%<br />
36.8%<br />
45.0%<br />
Return on investment<br />
Increase in profitability<br />
Increase in revenue<br />
55.0%<br />
60.5%<br />
60.0%<br />
75.0%<br />
76.3%<br />
81.6%<br />
0% 10% 20% 30% 40% 50% 60% 70% 80% 90%<br />
< 2Bn revenues > 2Bn revenues<br />
The majority of responding companies have implemented<br />
processes that align goals, but system support for unified<br />
decision making lags behind.<br />
12
understanding and addressingUnderstanding and<br />
Understanding and Addressing Tod<br />
Understanding and<br />
today’s tpo challenges<br />
Figure 6: New Financial KPIs to Measure Success<br />
“Our organization has established, and effectively communicates (to<br />
sales/marketing), key objectives expressed in financial measures, such as ...”<br />
Source: POI and <strong>Capgemini</strong><br />
Return on investment<br />
26.8%<br />
26.8%<br />
19.6%<br />
19.6%<br />
7.1%<br />
Cash-to-cash cycle<br />
12.5%<br />
21.4%<br />
26.8%<br />
23.2%<br />
16.1%<br />
Economic Value Added<br />
7.1%<br />
21.4%<br />
28.6%<br />
30.4%<br />
12.5%<br />
0% 20% 40% 60% 80% 100%<br />
1 2 3 4 5<br />
1-Totally Agree and 5-Totally Disagree<br />
Research Identifies Emerging Themes<br />
These survey findings as well as our client experience suggest that, as the industry evolves, a number<br />
of key themes are emerging. These include:<br />
• Communication between internal and external partners varies in both frequency and<br />
effectiveness, as often KPIs and the data behind decisions are not shared. A common<br />
communication language and mechanism is required.<br />
• Inputs used in determining trade decisions are often not within an agreed financial<br />
framework between partners. This is typically caused by siloed decisions and disparate<br />
methods and tools used in decision making.<br />
• Trade decisions are better made based on consumer demand. Traditional decision making<br />
needs to incorporate consumer actions and sentiments, and be location specific.<br />
• An integrated response between retailer and manufacturer is required to effectively meet<br />
the current challenges. A prerequisite to this is internal coordination among stakeholders.<br />
• While siloed analytics are better than no analytics, uncoordinated inputs to decisions no<br />
longer are enough.<br />
• Analytics, forecasting and decision-support processes must be integrated and operationalized.<br />
13
From Emerging Themes to Guiding Principles<br />
These emerging themes make it clear that from the foundation of TPM, movement to TPO is no<br />
longer just a business differentiator, but an essential requirement to compete effectively. Financial<br />
planning must be broadened to include specific operational actions that can be taken to respond to<br />
forecasted changes in demand.<br />
When considering how to effectively optimize promotions, guiding principles emerge in four key areas.<br />
Budgeting: Budgeting should incorporate top-down financial target setting along with reconciliation<br />
mechanisms to determine and resolve bottom-up budgeting gaps. Technology platforms should<br />
incorporate both types of methodologies with inputs from Sales and Operations, in addition to<br />
Finance, Marketing, Trade Marketing, Shopper Marketing and Category Management.<br />
Integration of TPM solutions with financial planning is also critical to improve data accuracy and<br />
signal latency from Marketing, Sales and Operations. Forecast accuracy should be considered<br />
as one of the key influencers in the fund budgeting process, since greater accuracy improves trade<br />
spend effectiveness and reduces misallocation of funds. In addition, the advent of customer marketing<br />
techniques means companies need to understand how to allocate direct marketing costs differently,<br />
as well as the return they would achieve on those investments.<br />
Funding: Account funding determination should include a combination of fixed and accrual<br />
methodologies. Accrual-based programs rely on accuracy of live rates to include “hidden” costs<br />
(e.g., logistical efficiencies, retail support, unsaleables, unauthorized deductions), whereas fixed<br />
funding can be used effectively for tiering and new item introductions. In addition, fund allocation<br />
decision ownership should incorporate Category Management and Operations to a larger extent. As<br />
a result, platforms should factor in competitive intelligence and cost of supply on an account-byaccount<br />
basis (in other words, localization).<br />
KPIs: Economic Value Added (a broader view of the profitability for customer and product) and cashflow<br />
KPIs should be considered among the account trade fund determination criteria. Additionally,<br />
shopper insights and various forms of demand signals (e.g., consumer loyalty and POS/syndicated<br />
data) would increase return on trade, if factored in upfront during the budgeting process.<br />
Enabling Tools: Tools and processes should take into account mechanisms to automate repetitive<br />
transactional activities and continue developing scorecards/reports to communicate decision criteria<br />
14
understanding and addressingUnderstanding and<br />
Understanding and Addressing Tod<br />
Understanding and<br />
today’s tpo challenges<br />
and outcomes internally and externally. A comprehensive approach to integrating multiple planning<br />
constituents is the next evolutionary step for larger CPG manufacturers. The development of tools and<br />
processes should focus on integration of multiple functions to collaborate internally and externally<br />
in order to establish a cross-functional view of anticipated market demand.<br />
Tools also need to mature by incorporating broader metrics, KPIs and success criteria. This<br />
puts more pressure on organizations to provide tools to accurately forecast and make it easy to<br />
understand variances at a more detailed level than exists today. The industry is evolving to require the<br />
same level of forecast accuracy on demand as it has traditionally placed on the supply chain.<br />
The industry today is in transition: The response to the dislocation driven by the advent of the<br />
“Consumer Demand Era” has been anything but uniform. The majority of responding companies have<br />
implemented processes that align goals (56% to 89% agree or agree somewhat), but system support for<br />
unified decision making lags behind (70% say they lack integrated systems). We believe the root cause<br />
of this is the traditional siloed approach to decision support with analytics systems and processes built<br />
for a specific purpose. However, this is changing. Our experiences with clients who have taken on the<br />
challenge of finding the efficient frontier between level of detail and spend finds that they have been<br />
able to cost effectively produce valuable insights at reasonable price points.<br />
Agreeing on the measures and accuracy of the data is a<br />
foundational, enabling function required for coordinating TPO<br />
with the financial framework.<br />
Over 70% of the respondents believe forecasting methods must be aligned to data availability<br />
and say that choosing the best method is key. In our experience, we have seen that these two key<br />
elements are related and often confused. They have their root cause in the lack of supporting tools and<br />
process coordination between the specific, for-purpose analytics. These analytics have traditionally<br />
not been driven from a common data, analytics or decision-support framework. The underlying<br />
causes of forecast inaccuracies have more to do with the inputs and drivers feeding the forecasts<br />
and not the forecasting methods themselves.<br />
Agreeing on the measures and accuracy of the data is a foundational, enabling function required<br />
for coordinating TPO with the financial framework. Challenges obtaining this are evidenced by the<br />
reliance on <strong>ROI</strong> as the key financial metric tracked. Cash-to-cash and Economic Value Added — key<br />
financial indicators in difficult economic times — are relied on less often.<br />
15
Integrated Financial and Trade Planning:<br />
Perspectives and Approaches<br />
How companies successfully integrate budgeting, planning and execution of informed and optimized trade<br />
plans depends on how realistic they are when implementing the processes. In our experience, the most<br />
effective and efficient way to achieve this monumental change is to take industry best practices and<br />
map those against current practices in order to define a flexible end state that can adapt to market changes.<br />
Once the process is defined, companies then can determine how to implement practically — and<br />
measure, refine and tune the process to meet changing business and customer demands.<br />
The following section outlines key lessons learned from both the research and experiences with our<br />
clients, as well as a process to implement and tools to enable integrated financial and trade planning.<br />
How companies successfully integrate budgeting, planning and<br />
execution of informed and optimized trade plans depends on how<br />
realistic they are when implementing the processes.<br />
Lessons Learned in Budgeting and Planning<br />
When looking to integrate promotional and financial plans, a number of key components need to<br />
be considered.<br />
Incorporate business intelligence into the process as early and often as possible. This will help balance<br />
the “underspend vs. overspend” dilemma and minimize uncertainty around fund support. The richer<br />
the set of demand signals incorporated into the process, the more accurate the KPIs necessary for<br />
budget coordination will be. Standardized business intelligence provides the common language for<br />
communication between internal and external partners.<br />
Trade rates should be structured to promote the desired results, integrated with and across category<br />
assortment plans. In addition, they should incorporate quantitative benchmarks for growth,<br />
incremental product supply costs, cost-to-serve, retailer support and retail execution.<br />
Financial information has to move beyond defining plans, rates and tracking against them. It must<br />
be integrated into the operational decision-making process, and tools must enable this integration<br />
and operationalization.<br />
16
Integrated financial and trade planning: Inte<br />
Integrated financial a<br />
Integrated F<br />
perspectives and approaches<br />
Rules for funding and accruals should be easily measured/understood. They should be structured,<br />
as much as possible, to react to demand changes. The ability to balance complexity with flexibility<br />
is critical.<br />
Communication is essential between internal and external partners. Technology platforms must<br />
enable a common language and visibility into the financial impact on all participants. Tools must<br />
enable integration and joint business planning discussions with customers around traditional vs.<br />
incremental funding support.<br />
Agreed measures up front improve processes in all aspects of the cycle. This is true during the<br />
current year as well as next year.<br />
Performance indicators need to be part of the process. Scorecards must provide useful information<br />
in addition to a grade after the fact. Reporting and analytical tools drive not only a financial plan<br />
“single view of the truth,” but also provide the basis for future planning cycles and data accuracy.<br />
With these imperatives in mind, the goalposts and frameworks for successful integration of financial<br />
and trade planning can be established. Following are four steps that can significantly improve the<br />
success of implementing an integrated process.<br />
Step 1: Understanding the ‘As-Is’<br />
Understanding the current capability, successes, strengths and limitations should serve as the<br />
starting point. An important element in this step is to identify the gaps and pain points, including<br />
the following:<br />
• Trade strategy: regional vs. global; performance-based funding; “base + incremental” vs.<br />
total volume forecasting; new item funding<br />
• Process/operations: Trade terms and structures; activity ownership and collaboration<br />
touchpoints among Marketing, Trade Marketing, Sales Management, Field Sales, Finance,<br />
Operations and Customer Service; retail execution ownership; time lags between each<br />
activity; KPIs driving the completion/agreement of each step and acceptable latency<br />
• Technology: Supporting applications functionality/reporting; integration with ERP,<br />
Demand Planning (DP), Data Warehouse (DW), TPO, mobile apps; multi-dimensional data<br />
filtering; automation capability/exception notification; rapid functionality deployment<br />
• Organizational structure: Process and data accuracy bottlenecks that require additional<br />
support; staffing mix to support internal and external collaboration<br />
17
A number of key factors should be identified for each pain point. For example, it is important to<br />
know all the KPIs that are used, both formal and informal. All organizations have specific measures<br />
used to understand position, but many of those have either not been or have been loosely quantified.<br />
Teams should make sure all KPIs are defined, and the measures used are articulated.<br />
It is also important to understand what is useful and achieved with existing processes and<br />
technology. Key questions to ask of each include:<br />
• Can it support demand as well as supply and distribution inputs?<br />
• How adaptable is it to continual change driven by mobility and direct consumer input?<br />
• How well does the process or technology communicate outside of its current purpose?<br />
• How easily can it be changed to adapt?<br />
Also essential is an understanding of what information, and with what frequency, is required from<br />
the current year to make next year’s plan more effective (Figure 7). And, finally, how does each<br />
process integrate or communicate with the financial plan and budget, and what are the mechanisms and<br />
frequency for quantifying actual vs. plan?<br />
An organization should think of its to-be state in terms of<br />
how consumer demand affects its operations.<br />
Figure 7: The Trade Planning Cycle<br />
Source: <strong>Capgemini</strong><br />
Supply Chain Optimization<br />
Current<br />
Year<br />
Tracking Settlement Analysis/ Reporting<br />
Next<br />
Year<br />
Central Planning<br />
Field Sales Planning<br />
Execution<br />
Tracking<br />
Settlement<br />
Trade Spend Effectiveness Analysis from Prior Year<br />
Adjustments to Current Plans<br />
Performance Tracking<br />
Liability Reconciliation<br />
Time<br />
Fiscal Year Begins<br />
18
Integrated financial and trade planning: Inte<br />
Integrated financial a<br />
Integrated F<br />
perspectives and approaches<br />
Step 2: Defining the ‘To-Be’<br />
The to-be exercise should be grounded in practicality. Key steps are:<br />
• Outline and agree on fundamental objectives, goals and KPIs that align with corporate<br />
objectives, looking out two to five years, and taking into account Marketing and Sales<br />
strategy across all channels and markets.<br />
• Develop a business case for change. Define tangible financial improvement opportunities,<br />
with quantifiable competitive advantage.<br />
• Define the framework for achieving the business case.<br />
• Determine the framework, processes and tools that enable the business case.<br />
• Prioritize the approach to achievement.<br />
• Review and decide which processes and tools will best support this process, and<br />
incorporate them into an implementation plan.<br />
An organization should think of its to-be state in terms of how consumer demand affects its<br />
operations. This means that every operational decision that responds to changes in consumer<br />
behavior must take into account how it will affect the whole brand plan — Trade, Marketing,<br />
Category/Assortment — in the context of the original financial plan.<br />
A number of guiding principles for design can be effective (Figure 8). For example, to-be states<br />
should define as many common coordination points as possible between these plans, and look to<br />
enable the operational decisions with a coordinated set of analysis. In addition, to-be states should<br />
evolve to take advantage of technological advances that can provide a standardized set of analysis that<br />
models the future based on a common set of drivers. That analysis should be conducted against an<br />
integrated set of interdepartmental KPIs, driven from a consistent modeling framework.<br />
Additionally, the decision-support dashboard should be driven from a data set that<br />
incorporates operational, historical and sensory data. And the to-be must define how to<br />
continually improve the timeliness of feedback which reduces reaction time and determines<br />
proactive approaches to demand stimulation.<br />
Relying on history alone to inform forecasts for specific purposes has been common practice for<br />
many years. The benefits of this approach must now be supported with the ability to respond<br />
to demand signals as close to when they occur as possible. Forecasts today should be capable of<br />
incorporating more immediate demand signals and consumer data.<br />
19
Figure 8: Developing the Future-State Operating Model<br />
Source: <strong>Capgemini</strong><br />
Pain<br />
Points<br />
Strategic<br />
Aspirations<br />
KPI Reporting Frequency<br />
and Latency<br />
Supporting Technology<br />
Opportunities<br />
Organizational Design & Staffing<br />
Allocation Opportunities<br />
• Corporate<br />
priorities for the<br />
next 2-5 years<br />
• Marketing and<br />
Sales strategy<br />
across channels<br />
and markets<br />
Corporate<br />
Goals<br />
• Experiential process<br />
design options and<br />
alternatives<br />
• Leading vs. bleeding<br />
Leading<br />
Practices<br />
Business Case<br />
• Tangible financial<br />
improvement<br />
opportunities<br />
• Qualitative<br />
competitive<br />
advantages<br />
Future<br />
Capabilities<br />
Requirements<br />
• High-level<br />
integrated<br />
conceptual<br />
design<br />
• Clear design<br />
considerations<br />
and impact<br />
on KPIs<br />
Future-State<br />
Operating<br />
Straw Model<br />
• Key focus areas<br />
that differentiate<br />
alternative<br />
solutions<br />
• Business<br />
scenarios<br />
focusing on<br />
differentiating<br />
requirements<br />
Key Business<br />
Requirements<br />
• Deep dive<br />
sessions<br />
to cover<br />
identified<br />
gaps<br />
• 20/80 rule<br />
Software<br />
Validation/<br />
Selection<br />
• Best-of- breed vs.<br />
single platform<br />
corporate vision<br />
• Service level<br />
agreements with<br />
the business<br />
IT Strategy<br />
• Distinct competitive advantage KPIs<br />
• Core competency vs. “must have<br />
to play”<br />
• Tie- in with the business case drivers<br />
• Consistent Analytics framework to improve decisions against planned budget and trade spend<br />
• Realistic plan to achieve defined criteria across Process, Technology and People dimensions<br />
The use of for-purpose models in isolation is no longer effective. Modeling must now be done in a<br />
framework driven from the same data using a consistent set of modeling disciplines that allow for use of<br />
common drivers. This type of Predictive Decision Framework (Figure 9) allows for common metrics to<br />
emerge that inform forecasts which become meaningful to all stakeholders.<br />
There are specific analytics activities, long done in silos, which if done within a common framework,<br />
using standardized modeling processes and a common set of data informed by demand signals,<br />
can provide a unified language that enables coordination between operational and financial plans.<br />
This framework becomes the foundation for incorporating predictive information into operational<br />
decisions. It can enable optimization across the product portfolio, corporate/customer trade plans,<br />
category/assortment plans, calendars, competition and price.<br />
20
Integrated financial and trade planning: Inte<br />
Integrated financial a<br />
Integrated F<br />
perspectives and approaches<br />
Figure 9: Predictive Decision Framework<br />
Source: <strong>Capgemini</strong><br />
Consumer Sensitive Demand Actions<br />
Financial Plans<br />
Headquarters<br />
Trade Plan<br />
Marketing Plan<br />
Customer Trade<br />
Plans<br />
Category/<br />
Assortment<br />
Plans<br />
Coordinated Scenario Analysis<br />
Optimize<br />
Portfolio<br />
Optimize<br />
Promotions<br />
Optimize<br />
Category/<br />
Assortment Plan<br />
Cross-Elasticity<br />
Analysis<br />
Optimize<br />
Promotion<br />
Calendar<br />
Optimize Price<br />
Consistent Modeling Framework<br />
Sensory Data<br />
Data<br />
Transformation<br />
Past<br />
Performance<br />
Operational Data, Financial Plans, Trade Plans<br />
Outputs for each optimization can inform coordinated scenario analysis, allowing for each<br />
promotional decision to be made in the context of the financial KPIs and operational plans. This<br />
information makes true collaboration between operational stakeholders possible by removing<br />
debates and discussions about specific trade actions taken.<br />
Combining visibility, proven historical analytics processes and demand signals into a common<br />
framework can help coordinate financial, marketing, brand, assortment and trade plans for both<br />
CPG companies and their retail partners.<br />
To-be states should evolve to take advantage of technological<br />
advances that can provide a standardized set of analysis that models<br />
the future based on a common set of drivers.<br />
21
Step 3: Bridging the Gaps and Executing the Vision<br />
Making this happen is not as daunting as it may seem. Companies have started to leverage their<br />
investments in a common transactional infrastructure as a solid starting point for establishing the<br />
same level of effectiveness when influencing and responding to demand (Figure 10).<br />
Moving from a to-be definition to an integrated financial and operational decision-support process is<br />
possible. We have found the following principles to be key to executing the vision:<br />
• Goals for each stage of the process should be measured against key KPIs and prioritized<br />
for benefit.<br />
• Roll-out of functionality should be completed in stages that support those priorities, and<br />
continually measured against those KPIs.<br />
• Roll-outs should not be pilots. The business requirement is to develop informed, predictive<br />
and demand-driven plans coordinated with financial KPIs. The focus of a measured rollout<br />
vs. a pilot test encourages the behavioral changes necessary to incorporate quantitative<br />
influences into what historically has been a largely qualitative process.<br />
• Organizational impact cannot be ignored. The effects on individuals, compensation and<br />
responsibilities should be well planned, and teams should work to manage business impact.<br />
• Key drivers should be speed, accuracy and coordination.<br />
Figure 10: Executing the Vision<br />
Source: <strong>Capgemini</strong><br />
Consistent Analytics framework to improve decisions<br />
against planned budget and trade spend<br />
Realistic plan to achieve defined criteria across Process,<br />
Technology and People dimensions<br />
Project<br />
Preparation<br />
Design<br />
Configuration<br />
Final Preparation<br />
& Testing<br />
Go-Live &<br />
Support<br />
Regular Live<br />
Support<br />
Focus on process<br />
that will maximize<br />
increments to defined<br />
financial targets<br />
Build organizational<br />
buy-in and adjust<br />
process accordingly<br />
Clearly defined goals tied to financial framework<br />
Staged roll-out approach<br />
Key principles<br />
• Staged roll-out vs. pilot<br />
• Align stages to minimize business disruption<br />
Allow for transition over<br />
time from current to<br />
end-state goal<br />
Make fact-based<br />
decisions based on<br />
identified constraints<br />
Standardized Measurement Process<br />
22
Integrated financial and trade planning: Inte<br />
Integrated financial a<br />
Integrated F<br />
perspectives and approaches<br />
Step 4: Learning and Adjusting<br />
Implementation of a coordinated decision-making framework makes course correction based on<br />
market activity not only easier, but timelier. Having consistent information, driven from coordinated<br />
modeling forms and data sources, removes confusion about the interpretation of what consumer actions<br />
mean. Adjustments can be made quickly — always within the context of the original plan.<br />
Each adjustment should be taken after understanding the effect it will have on achieving the plan.<br />
Each should look to determine how consumer demand will affect the plan, model actions that are<br />
contemplated, and coordinate response across the entire brand plan (Figure 11).<br />
Integrated scenario analysis driven by a consistent set of forecasting inputs should be the basis for<br />
all responses, proactive and reactive, to consumer demand.<br />
Figure 11: Feedback Process to Fine-Tune Strategy and Execution<br />
Source: <strong>Capgemini</strong><br />
Financial Plans<br />
Consumer Sensitive Demand Actions<br />
Planned vs. Actual<br />
Coordinated Responses to Consumer Behavior<br />
Headquarters<br />
Trade Plan<br />
Marketing Plan<br />
Customer Trade<br />
Plans<br />
Category/<br />
Assortment<br />
Plans<br />
Coordinated Scenario Analysis<br />
Optimize<br />
Portfolio<br />
Optimize<br />
Promotions<br />
Optimize<br />
Category/<br />
Assortment Plan<br />
Cross-Elasticity<br />
Analysis<br />
Optimize<br />
Promotion<br />
Calendar<br />
Optimize Price<br />
Consistent Modeling Framework<br />
Sensory Data<br />
Data<br />
Transformation<br />
Past<br />
Performance<br />
Operational Data, Financial Plans, Trade Plans<br />
23
T<br />
The Big Ideas<br />
The financial framework serves as a way to evaluate trade investment decisions, performance and<br />
efficiency of resources in your organization. It is a foundational capability of promotion optimization,<br />
including appropriating inventory and the necessary execution to serve shoppers/consumers.<br />
As trading partners demand more of each other, TPO is a continual process, providing insight<br />
into your organization’s ongoing efforts to improve sales, operations and systems. The financial<br />
framework acts as a visible commitment of your company’s TPO results.<br />
The financial framework serves as a way of evaluating trade investment<br />
decisions, performance and efficiency of resources in your organization.<br />
Financial Framework Defined<br />
POI defines a Financial Framework for Trade Promotion Optimization as a metrics-based process<br />
that enables companies to determine how best to approach trade investment decisions with trading<br />
partners. This approach increases the likelihood of success (regardless of tactic, medium, goal/<br />
measure). Measures such as forecast accuracy on promotion, incremental lift and mutual profitability<br />
are based on the achievement of results that are predicted. The framework also utilizes data and<br />
technologies to improve trade spend efficiency and effectiveness, and, thus, profitability.<br />
With the proper framework in place, executives better understand the role of variables (promotion<br />
type, tactic, date, duration, price point, settlement time) and their leverage points, and can regularly<br />
monitor all changes, externally and internally, with regard to its constraints (for example, raw<br />
goods suppliers, customer segments, etc.). It is also important to calculate category effects, store<br />
brands and competitive concerns as well as industry benchmarks to help improve trade <strong>ROI</strong>. This<br />
framework also provides the basis for identifying areas of opportunity to guide strategic goals for<br />
continual improvement.<br />
Demand-Driven Enterprise<br />
Industry dynamics are leading many companies to better understand the financial impact of their<br />
decisions and to focus on the consumer as the driver of activities within their organization. Our<br />
experiences helping CPG organizations develop flexible financial frameworks to optimize trade<br />
suggest that the holistic approach to enterprise design lowers the risk of margin leakage.<br />
<br />
24
the big ideas<br />
HE BIG IDEAS<br />
THE BIG IDEAS<br />
THE BIG IDEASTHE BIG ID<br />
THE BIG IDEAS<br />
THE BIG IDEAS<br />
THE BIG IDEAS<br />
THE BIG IDEAS<br />
THE BIG IDEAS<br />
THE BIG IDEAS<br />
THE BIG IDEAS<br />
THE BIG IDEAS<br />
THE BIG IDE<br />
THE BIG IDE<br />
The Demand-Driven Enterprise (Figure 12) is intended to integrate the planning and execution<br />
processes across both CPG manufacturers and retailers to drive revenue and margin increases<br />
by better supporting assortment optimization, space optimization, trade funds management and<br />
demand planning while simultaneously streamlining the supply chain. The power of the Demand-<br />
Driven Enterprise is driven by four core concepts:<br />
• Pulse – Demand Sensing<br />
• Shelf Strategy – Localized Assortment Optimization<br />
• Collaboration – Sales and Marketing Strategy and Planning<br />
• Manufacturing – Demand-Driven Supply Network<br />
These concepts work together as enablers to leverage the full breadth of consumer data available to<br />
maximize market share, revenue and <strong>ROI</strong>, while driving efficiency and agility in goods production.<br />
Figure 12: Demand-Driven Enterprise<br />
Source: <strong>Capgemini</strong><br />
Demand<br />
Sensing<br />
(Pulse)<br />
Local Assortment<br />
Optimization<br />
(Shelf Strategy)<br />
Demand-Driven Enterprise (DDE)<br />
Sales & Marketing Planning<br />
(Consumer, Shopper, Retailer Collaboration)<br />
Financial Planning<br />
Manufacturing Planning<br />
(Demand-Driven Supply Network)<br />
Sensory<br />
Data<br />
Cleansing<br />
Floor/<br />
Space<br />
Planning<br />
Category<br />
Planning,<br />
Store<br />
Clustering,<br />
&<br />
Assortment<br />
Planning<br />
Store Level<br />
Forecasting,<br />
Replenishment<br />
& VMI<br />
New Product Development<br />
Retail<br />
Execution/<br />
DSD<br />
Marketing<br />
Optimization<br />
Trade Promotion<br />
Management &<br />
Optimization<br />
HQ Planning &<br />
Pricing<br />
Optimization<br />
Network, Sourcing and Inventory Optimization<br />
Demand and<br />
Replenishment<br />
Planning<br />
S&OP<br />
Supply<br />
Planning<br />
(incl. DRP,<br />
MPS, RCCP)<br />
Production<br />
Planning &<br />
Scheduling<br />
Supplier<br />
Collaboration<br />
Analytics (Demand Signal Repository, Portfolio Optimization, Marketing Spend Effectiveness,<br />
Trade Spend Effectiveness, Sales Force Effectiveness, Cost to Serve, Operational Reporting)<br />
Order Promising, Inventory Deployment, Logistics and Distribution<br />
Internet Mobile Device Store<br />
Retail DC Manufacturer DC Factory Supplier<br />
Social Media Data eCommerce Data In-Store Traffic Data<br />
POS Data Assortments Withdrawals Customer Orders<br />
Shipments Production Orders Procurement Orders<br />
25
T<br />
Components of the Demand-Driven Enterprise<br />
Pulse – Demand Sensing: Understanding demand today is more complex than ever; no longer is<br />
consolidated syndicated data a full representation of how consumers behave. Loyalty and social media<br />
data can enhance traditional segmentation methods. Information access is more immediate than ever<br />
before. The opportunity exists for CPG companies to leverage their unique position as recipients<br />
of this data to re-establish intimacy with consumers in direct marketing programs, and to drive, with<br />
much more specificity, the demand creation and fulfillment processes.<br />
This visibility enables CPG companies to have a truly agile supply chain response capability and<br />
the ability to react in a synchronized fashion with retailer inventory strategies to reduce disruptions<br />
in the extended supply chain. Together, the CPG companies and the retailer can now identify and<br />
prioritize the different types of demand signals and deploy inventory from the most cost-effective<br />
supply location. The demand signals can also form a baseline for inventory rebalancing strategies,<br />
which provide opportunities to further improve inventory volume and performance across the two<br />
networks. Inventory requirements that are aggregated from the store and distribution centers (DCs)<br />
provide Manufacturing and Logistics with the ability to plan and support short-term and long-term<br />
production plans across raw materials, carrier requirements and labor schedules.<br />
Shelf Strategy – Localized Assortment Optimization: CPG account management teams will<br />
collaborate with the retailer and come to a consensus on final store-level assortments, plan-o-grams<br />
and a joint execution plan. The retailer’s insights on future promotions, such as planned price<br />
discounts or advertised specials, which could cause consumer purchasing behavior to change,<br />
are incorporated into the forecast that is used to generate assortment plans and plan-o-grams.<br />
Both parties can further adjust the assortment and plan-o-gram parameters and regenerate plans<br />
systemically. The assortments and plan-o-grams will also take into account seasonality, details on new<br />
product introductions and adjustments based on emerging consumer trends.<br />
The Demand-Driven Enterprise is intended to integrate the planning and<br />
execution processes across both CPG manufacturers and retailers to<br />
drive revenue and margin increases.<br />
The Demand-Driven Enterprise proposes a greater level of CPG manufacturer involvement in<br />
managing the initial planning of assortments and shelf space and further collaboration to reduce<br />
risk with retailer workload around detailed product analysis in planning the shelf.<br />
26
the big ideas<br />
HE BIG IDEAS<br />
THE BIG IDEAS<br />
THE BIG IDEASTHE BIG ID<br />
THE BIG IDEAS<br />
THE BIG IDEAS<br />
THE BIG IDEAS<br />
THE BIG IDEAS<br />
THE BIG IDEAS<br />
THE BIG IDEAS<br />
THE BIG IDEAS<br />
THE BIG IDEAS<br />
THE BIG IDE<br />
THE BIG IDE<br />
Collaboration – Sales and Marketing Strategy and Planning: The Demand-Driven Enterprise<br />
takes into account leading trends in how CPG manufacturers differentiate themselves in a competitive<br />
marketplace. It does not encompass all business functions for a manufacturer to successfully<br />
collaborate with a retailer. Collaborative Category Management, Demand and Inventory Planning<br />
Synchronization, Trade Promotion Management and Supply Chain Execution Collaboration require<br />
alignment with the overall value chain, including Sales, Marketing, Product Development and Finance.<br />
Following are additional areas that must be aligned within the Demand-Driven Enterprise and how<br />
they would benefit.<br />
• Financial Planning: Improved forecast accuracy will provide category management teams<br />
with more accurate budget for planning purposes. Increased collaboration on retailer DC<br />
and store receipt plans will allow more optimal use of capital.<br />
• New Product Development: Increased collaboration internally among Product<br />
Development, Sales, Marketing and Supply Chain and external collaboration with retailers<br />
will provide strong feedback for improvement or variation of the current product mix.<br />
• Marketing Optimization: Visibility of inventory requirements (base and lift) across store,<br />
catalog and web sales channels will be improved. In addition, integration of the shopper<br />
marketing strategy will better align consumer marketing programs with trade strategies<br />
and incentives that lead a shopper to purchase.<br />
• HQ Planning and Pricing Optimization: Store POS data will assist in managing price<br />
elasticity and determine optimal pricing strategies throughout the product’s lifecycle; assist<br />
with segmentation strategies (national vs. account based); and identify the most effective<br />
promotions and tailor budget to drive growth.<br />
• Linking Available-to-Promise (ATP), Capable-to-Promise (CTP) and Available Allocatedto-Promise<br />
(AATP): ATP and CTP capabilities are not new practices. By linking the actual<br />
production schedules with the demand forecast, inventory and shelf plans, a real-time<br />
view of product availability can be used for in-season inventory management to better meet<br />
customer needs.<br />
• Network & Inventory Optimization: Synchronizing demand and inventory strategies in<br />
the Demand-Driven Enterprise can help facilitate that correct inventory, production and<br />
distribution decisions are made throughout the supply network.<br />
• Sales & Operations Planning (S&OP): The ability to share demand forecasts, inventory<br />
plans and production schedules through a Demand-Driven Enterprise is paramount to<br />
enabling S&OP planning processes and gaining a mechanism for resolving issues as well<br />
as capitalizing on opportunities.<br />
• Production Planning & Scheduling: Production and raw material requirements are more<br />
closely linked to consumer demand. New processes and technology enable planners to make<br />
more informed decisions when developing plans and making changes to their schedules.<br />
27
T<br />
Manufacturing – Demand-Driven Supply Network: Demand synchronization entails tapping<br />
into POS data directly from the retailer. POS data provides CPG companies with the ability to<br />
understand trends at the shelf level. POS data enables more informed and accurate analytics to be<br />
performed by Sales, Marketing and Demand Planning departments. Additional forecasting and<br />
demand-sensing processes and technologies can further evaluate daily shipment history, POS and<br />
customer orders, better identify both short- and long-term demand patterns, and enable timelier<br />
in-season response.<br />
A higher degree of forecast accuracy has a direct impact on the rest of the supply chain since an<br />
accurate forecast is the foundation for developing a time-phased, multi-echelon replenishment<br />
plan. The forecast can be combined with other key data points from the retailer — such as product<br />
inventory levels at the store, product already in transit or on-order, product at the retailer’s<br />
warehouses, desired customer service levels and supporting safety-stock policies — to calculate net<br />
inventory requirement for each node within the retailer and CPG supply chain.<br />
To ensure the consistent success of the demand-driven plan, retailers and CPG companies must<br />
collaborate on demand and shipment plans within the execution window. Retailers have vital<br />
information on demand influencers such as discounts, promotions and ad campaigns, and these<br />
programs are constantly changing, often within the manufacturing freeze window duration. Having<br />
visibility into the retailer’s inventory strategy and POS data enables CPG companies to manage<br />
inventory and resource constraints and produce an executable deployment plan to meet projected<br />
consumer demand.<br />
While no company in the marketplace has fully implemented a Demand-Driven Enterprise, many<br />
are exploring how they can bring to the “demand-creation” functions the same standardization,<br />
interoperability and flexibility they have brought to their supply chain functions. The continued<br />
market pressure distancing CPG companies from direct access to consumers will require<br />
organizations to have this capability to remain competitive. The key to implementing the<br />
capabilities required for a Demand-Driven Enterprise is to use an integrated approach. Past<br />
technology and analytics constraints are now removed, making the use of a common set of metrics<br />
as the basis of communication possible.<br />
Integration Architecture<br />
The financial accuracy of trade planning can be improved by leveraging process and technology to<br />
focus all decisions within the context of the financial framework. When focusing on demand, the<br />
sequence and timing of incorporating various forms of demand signals into the financial planning<br />
28
the big ideas<br />
HE BIG IDEAS<br />
THE BIG IDEAS<br />
THE BIG IDEASTHE BIG ID<br />
THE BIG IDEAS<br />
THE BIG IDEAS<br />
THE BIG IDEAS<br />
THE BIG IDEAS<br />
THE BIG IDEAS<br />
THE BIG IDEAS<br />
THE BIG IDEAS<br />
THE BIG IDEAS<br />
THE BIG IDE<br />
THE BIG IDE<br />
activities is perhaps the secret weapon to improve information flow. Figure 13 shows how different<br />
processes within financial planning and customer planning integrate around the creation of the<br />
demand plan. Key process interface points include:<br />
Incorporating sales and marketing intelligence: Taking the broader financial targets developed<br />
within the financial framework as context, incorporating sales and marketing intelligence identified by<br />
an integrated analytic framework enables a consensus demand plan to be developed. This plan can<br />
then use business intelligence insights produced in the financial planning process to identify and<br />
close gaps. Using agreed-upon metrics driven from a coordinated framework makes it possible to<br />
revise the plan as required.<br />
Incorporating S&OP inputs: An informed demand plan can drive a more accurate cost plan during<br />
the final stages of the financial planning process. Again, the broader set of common metrics enables<br />
faster, more efficient iterations of S&OP variances as they occur.<br />
Thus the informed demand plan serves as the unifying driver across the enterprise. Driven by the<br />
consumer, informed by agreed-upon data and forecasts, and using common metrics to communicate<br />
enables each participant to spend more time focusing on increasing profit.<br />
Figure 13: Financial Framework Architecture<br />
Source: <strong>Capgemini</strong><br />
Financial<br />
Planning<br />
Prepare Data<br />
Create<br />
Financial<br />
Targets<br />
Incorporate<br />
Business<br />
Intelligence<br />
Review and<br />
Close Gaps<br />
Define<br />
Operational &<br />
Indirect Costs<br />
Sign -Off<br />
Financial<br />
Plan<br />
Monitor<br />
Performance<br />
Demand<br />
Planning<br />
Prepare Data<br />
Generate<br />
Base<br />
Forecast<br />
Incorporate<br />
Sales &<br />
Marketing<br />
Intelligence<br />
Develop<br />
Consensus<br />
Demand Plan<br />
Communicate<br />
with Supply<br />
Planning<br />
Monitor<br />
Performance<br />
Marketing and<br />
Customer<br />
Planning<br />
Price Setting<br />
and<br />
Optimization<br />
Marketing<br />
Resource<br />
Management<br />
(MRM)<br />
Marketing<br />
Mix Modeling<br />
Category<br />
Management<br />
Trade<br />
Promotion<br />
Management<br />
Trade<br />
Promotion<br />
Optimization<br />
Sales &<br />
Operations<br />
Planning<br />
(S&OP)<br />
Source: <strong>Capgemini</strong> Frameworks<br />
29
CO<br />
Conclusion<br />
The Influence of Sound Planning on TPO and Enterprise Results<br />
The Financial Framework for Trade Promotion Optimization enables consumer products<br />
companies to focus on any combination of trade promotion, supply chain or financial key<br />
performance indicators to improve their cash-to-cash cycle, including: improved sales volume<br />
(reduces inventory carrying costs), reduction of days deductions outstanding, improvement in<br />
forecast accuracy and trade spend <strong>ROI</strong>. While it is difficult to estimate the effect of change from<br />
adjusting an individual variable, because all are interrelated, improving any one will result in a<br />
shorter C2C cycle for a company.<br />
Alignment of strategy, goals and tools, a cornerstone of TPO, was investigated for trade marketing<br />
at each stage from budgeting/planning through sales. High performers’ results suggest that a<br />
disciplined planning process within a financial framework is positively related to performance not<br />
only at the field level, but also at the very earliest stages of planning, Financial influence at the last<br />
stage only (post-deal/event) can have a negative effect on organizational performance, due to the<br />
opportunity costs associated with poor trade investment decisions and vehicles.<br />
In addition to directly affecting a manufacturer’s bottom line,<br />
trade planning and execution will determine brand health and<br />
competitive effectiveness going forward.<br />
Demand signal determination and internal communication of measures related to better forecasting<br />
method determination is critical. Emphasis on communication of the results to the rest of the<br />
constituents inside an organization seems to be occurring along the value chain so that Sales,<br />
Marketing and Supply Chain play increasingly overlapping roles to achieve more integrated ways of<br />
driving Trade Promotion Optimization.<br />
This research explored the necessary components for effective use of budgeting and planning<br />
methods to align internal, then external partners to assess the right marketing mix (including social<br />
media and digital), pricing and offers to optimize promotional <strong>ROI</strong>.<br />
30
conclusion<br />
NCLUSION<br />
CONCLUSION<br />
C<br />
CO<br />
conclu<br />
CONCLUSION CONCLUSION<br />
CONCLUSION<br />
CONCLUSION<br />
CONCLUSION<br />
CONCLUSION<br />
CONCLUSION<br />
CONCLUSION<br />
CONCLUSION CONCLUSION<br />
CONCLUSION CONCLUSION<br />
Today, responsibility for innovation has become more widely diffused. Brand and category<br />
innovations are conducted simultaneously to create a competitive advantage. In a Demand-Driven<br />
Enterprise, functions along the value chain are sharing responsibility to achieve higher levels of<br />
enterprise integration, from concept to customer, to drive greater return on marketing investment.<br />
Companies using the Financial Framework for TPO and experimenting with new media will benefit<br />
from a better understanding and improved retail execution and hence will more quickly adjust for<br />
continual improvement.<br />
Trade Planning and Execution Post-Adoption of TPO<br />
There is one fact that has changed the way we look at trade planning. Technology has enabled<br />
consumers to have access to information on a scale and with directness that has never been possible<br />
before. In addition to directly affecting a manufacturer’s bottom line, trade planning and execution will<br />
determine brand health and competitive effectiveness going forward. Trade Promotion Optimization has<br />
moved from a stretch goal to an essential capability all organizations must master.<br />
To leverage TPO, we believe the following practices will become industry standard:<br />
• Use of real-time, consumer-oriented data, or “demand signals” — including consumer<br />
demographics, purchasing behaviors, social and direct inputs, crowdsourcing, point-of-sale<br />
transactions and syndicated research — will be incorporated into predictive techniques.<br />
• Modeling techniques, driven from data common and agreed to across the Demand-<br />
Driven Enterprise, will be used to predict the financial and supply impacts of<br />
promotional programs.<br />
• Feedback mechanisms will be more real time and will allow for more timely adjustments to<br />
promotional programs. As a result, promotional programs will become more results based<br />
and have the ability to be modified mid-promotion.<br />
• The traditional definition of promotion will be expanded. Direct-to-consumer promotions<br />
will now join traditional marketing and retail trade programs. This offers an opportunity<br />
for manufacturers to connect to their consumers and build brands that have been diluted<br />
by the advent of multiple media outlets and national retailers.<br />
• Data-driven scenario planning will become the norm. Statistical modeling provides the<br />
insights to do a better job balancing the trade-offs in trade promotions, including discount,<br />
price, time frame, product mix and in-store placement. The analysis is performed by<br />
customer and deal, by store and individual week. This output enables appropriate tactical<br />
actions such as the elimination or curtailing of unsuccessful events or the improvement of<br />
future events.<br />
31
CO<br />
• At the same time, a greater understanding of how and why consumers respond to different<br />
attributes within a promotion will allow for improved event design in the future.<br />
• Core trade promotion management activities (planning, execution and tracking) will<br />
be integrated with retail execution through a merchandising audit and retail audit. This<br />
capability serves two purposes. First, it provides checks and balances for making sure that<br />
the promotion is executed in the store as planned. Second, it helps identify the gaps that<br />
exist between planning and execution activities and how key learnings can be fed back<br />
into the planning and negotiations next time around.<br />
The ability to manage these diverse dynamics will force companies to look beyond <strong>ROI</strong> as the primary<br />
driver in trade decisions, and tie all decisions to an integrated financial framework that looks at the<br />
full effect of those decisions on the enterprise. Today’s typical <strong>ROI</strong> analysis skews both the cost and<br />
revenue because of hidden expenses, mark-downs, scrap and returns. The analyses of pocket margin by<br />
customer/product combinations, cash-to cash and Economic Value Added are now feasible.<br />
These enabling processes and technology will move trade<br />
planning and execution from an inward and distributionfocused<br />
activity to one that is integral to building successful and<br />
profitable brands.<br />
With a Demand-Driven Enterprise, hidden costs are exposed and the CPG manufacturer views the<br />
total event cost and true event lift, as well as the effectiveness of promotions on consumer demand.<br />
The additional analysis by Sales/Marketing/Account Management of existing promotions and future<br />
promotions allows planners to provide Supply Chain with a more informed picture of normal demand<br />
vs. lift demand due to promotional activity. Collaboration on the full demand plan translates to a<br />
better, timelier response to consumer activities.<br />
These enabling processes and technology will move trade planning and execution from an inward and<br />
distribution-focused activity to one that is integral to building successful and profitable brands.<br />
We expect you will apply the research findings, strategies and tactical plans outlined in this paper<br />
to your existing processes, enabling you, your team and your trading partners to achieve maximum<br />
results from your collaborative promotion optimization efforts.<br />
32
conclusion<br />
NCLUSION<br />
CONCLUSION<br />
C<br />
CO<br />
conclu<br />
CONCLUSION CONCLUSION<br />
CONCLUSION<br />
CONCLUSION<br />
CONCLUSION<br />
CONCLUSION<br />
CONCLUSION<br />
CONCLUSION<br />
CONCLUSION CONCLUSION<br />
CONCLUSION CONCLUSION<br />
How Teams Operate and Compete Differently After TPO Adoption<br />
One of the most important steps when adopting TPO is developing a strong strategy; a plan<br />
of action designed to achieve your goals. The most common mistake companies make when<br />
deciding to adopt TPO is to rush through the planning process. A TPO implementation is not<br />
just about improved reporting, charts and automating processes. TPO is a tool to help you make<br />
critical promotion investment decisions with your trading partners, and enhance profitability<br />
and shopper/consumer service and value. Just as each company or channel is different, each TPO<br />
adoption strategy must also be different, designed to effectively enhance the workflow of your<br />
company, brands and trading partners.<br />
Define your current workflow. Take time to document the daily work flow of Sales, Marketing,<br />
Finance and Supply Chain. Collect details on current paper processes and determine what<br />
information is being accessed, reviewed and shared/analyzed.<br />
Identify what works well and what doesn’t. This step will define what your TPO solution<br />
needs to do for you. Discuss where you’d like to see changes in work flow and performance and<br />
what they would look like.<br />
Define your desired outcome. Think of the future and what you are trying to accomplish. Define<br />
your plans for growth, such as identifying new partners, new media and/or customer segments.<br />
Recognize at any given time, your desired outcomes are volume, profit, share or other. Ask yourself<br />
if your long-term trading partner performance and financial goals will require additional or more<br />
timely data, and evaluate how efficient data integration will impact these goals.<br />
Do your research. Conceptualize how TPO can help you meet your goals. Talk to those who are<br />
migrating to/using TPO. Learn which systems can provide you with the features you need. Get<br />
hands-on experience with the systems you are considering, and learn for yourself if the system is<br />
easy to use and right for your team. The best place to learn, network and derive value is through<br />
membership and participation with POI.<br />
33
I<br />
OI<strong>ROI</strong><br />
<strong>ROI</strong><br />
O<br />
S<br />
R<br />
THE FINANCIAL FRA<br />
SPONSOR<br />
SPONSO<br />
I<br />
H-TO-CASH<br />
NOMIC VALUE ADDED<br />
DEMAND SIGNALS<br />
PARTNER NETWORK DISCIPLINED PLANNING<br />
DEMAND SENSINGPROMOTION OPTIMIZATION<br />
34<br />
FINANCIAL FRAMEWORK<br />
TRADE PROMOTION<br />
OPTIMIZATIONSUCCESS<br />
SALES COLLABORATION<br />
DEMAND<br />
SENSING<br />
TRADE FUNDING<br />
FUNDING STRATEGIES<br />
SALES VOLUME<br />
FORECAST ACCURACY<br />
OPTIMAL SPEND<br />
CATEGORY INNOVATIONS<br />
PERFORMANCE INDICATORS<br />
<strong>ROI</strong><br />
<strong>ROI</strong><br />
<strong>ROI</strong><br />
<strong>ROI</strong><br />
TIMAL<br />
<strong>ROI</strong><br />
<strong>ROI</strong><br />
PEND<br />
<strong>ROI</strong><br />
<strong>ROI</strong> <strong>ROI</strong><br />
<strong>ROI</strong><br />
<strong>ROI</strong><br />
<strong>ROI</strong><br />
<strong>ROI</strong> <strong>ROI</strong><br />
<strong>ROI</strong><br />
<strong>ROI</strong><br />
<strong>ROI</strong> <strong>ROI</strong><br />
<strong>ROI</strong><br />
<strong>ROI</strong> <strong>ROI</strong><br />
<strong>ROI</strong><br />
<strong>ROI</strong><br />
<strong>ROI</strong><br />
OPTIMAL<br />
<strong>ROI</strong><br />
<strong>ROI</strong><br />
SPEND<br />
<strong>ROI</strong><br />
<strong>ROI</strong><br />
<strong>ROI</strong> <strong>ROI</strong><br />
<strong>ROI</strong><br />
<strong>ROI</strong><br />
<strong>ROI</strong> <strong>ROI</strong><br />
<strong>ROI</strong><br />
<strong>ROI</strong><br />
<strong>ROI</strong><br />
<strong>ROI</strong><br />
<strong>ROI</strong> <strong>ROI</strong><br />
<strong>ROI</strong><br />
MARKETING MIX<br />
SALES COLLABORATION<br />
OPTIMAL SPEND<br />
CATEGORY INNOVATIONS
S<br />
SPONSORS<br />
SPONSORS SPONSORS<br />
SPONSORS<br />
SPONSORS SPONSORS<br />
SPON<br />
SPONSORS<br />
SPONSORS<br />
SPONSO<br />
SPONSORS<br />
SPONSORS<br />
RS<br />
SPONSORS<br />
SPONSORS<br />
SPONSORS<br />
SPONSORS<br />
SPONSORS<br />
SPONSORS<br />
SPONSORS<br />
SPONSORS<br />
SPONSORS<br />
SPONSORS<br />
SPONSOR<br />
SPONSORS<br />
SPONSORS<br />
SPONSORS<br />
About the Sponsors<br />
About the Promotion Optimization Institute (POI)<br />
POI brings together manufacturers, retailers, solution providers, analysts, academics and other<br />
industry leaders. Members of POI share cross-functional best practices in both structured and<br />
informal settings. Additionally, members benefit through our industry alliances, the CCM program,<br />
and the Promotional Collaboration Capability Matrix (PCCM).<br />
POI aims to instill a financial and metrics-based discipline not typically found with other trade<br />
groups. The goal of our innovative approach is collaborative promotion optimization. The focus<br />
is on the customer/shopper through sales, marketing, and merchandising strategies. Executive<br />
advisory boards keep us apprised of industry needs and help us provide desired outcomes for<br />
members, sponsors, and academia. For more information: www.P-O-I.org.<br />
About <strong>Capgemini</strong><br />
With 115,000 people in 40 countries, <strong>Capgemini</strong> is one of the world’s foremost providers of<br />
consulting, technology and outsourcing services. The Group reported 2010 global revenues of EUR<br />
8.7 billion.<br />
Together with its clients, <strong>Capgemini</strong> creates and delivers business and technology solutions that<br />
fit their needs and drive the results they want. A deeply multicultural organization, <strong>Capgemini</strong><br />
has developed its own way of working, the Collaborative Business Experience, and draws on<br />
Rightshore ® , its worldwide delivery model. More information is available at www.capgemini.com.<br />
Rightshore ® is a trademark belonging to <strong>Capgemini</strong><br />
35
www.p-o-i.org<br />
www.capgemini.com<br />
36<br />
CASH-TO-CASH<br />
SALES COLLABORATION<br />
CATEGORY INNOVATIONS<br />
DEMAND SIGNALS<br />
DISCIPLINED PLANNING<br />
PROMOTION OPTIMIZATION DEMAND SENSING<br />
OPTIMAL SPEND<br />
FINANCIAL FRAMEWORK<br />
<strong>ROI</strong><br />
SALES COLLABORATION<br />
DEMAND<br />
SENSING<br />
<strong>ROI</strong><br />
CASH-TO-CASH<br />
ECONOMIC VALUE ADDED<br />
PARTNER NETWORK<br />
MARKETING MIX<br />
TRADE FUNDING<br />
FUNDING STRATEGIES<br />
DEMAND SIGNALS<br />
MARKETING MIX<br />
SALES VOLUME<br />
FORECAST ACCURACY<br />
OPTIMAL SPEND<br />
CATEGORY INNOVATIONS<br />
PERFORMANCE INDICATORS<br />
<strong>ROI</strong> <strong>ROI</strong><br />
<strong>ROI</strong> <strong>ROI</strong><br />
OPTIMAL<br />
<strong>ROI</strong><br />
<strong>ROI</strong><br />
<strong>ROI</strong><br />
SPEND<br />
<strong>ROI</strong><br />
<strong>ROI</strong><br />
<strong>ROI</strong> <strong>ROI</strong><br />
<strong>ROI</strong><br />
<strong>ROI</strong><br />
<strong>ROI</strong> <strong>ROI</strong><br />
<strong>ROI</strong><br />
<strong>ROI</strong><br />
<strong>ROI</strong> <strong>ROI</strong><br />
<strong>ROI</strong><br />
<strong>ROI</strong><br />
<strong>ROI</strong><br />
<strong>ROI</strong><br />
<strong>ROI</strong><br />
<strong>ROI</strong> <strong>ROI</strong> <strong>ROI</strong><br />
<strong>ROI</strong><br />
<strong>ROI</strong><br />
<strong>ROI</strong> <strong>ROI</strong><br />
<strong>ROI</strong><br />
OPTIMAL<br />
<strong>ROI</strong><br />
SALES