BIOINFORMATICS APPLICATIONS NOTE - EMBL
BIOINFORMATICS APPLICATIONS NOTE - EMBL
BIOINFORMATICS APPLICATIONS NOTE - EMBL

You also want an ePaper? Increase the reach of your titles
YUMPU automatically turns print PDFs into web optimized ePapers that Google loves.
<strong>BIOINFORMATICS</strong> <strong>APPLICATIONS</strong> <strong>NOTE</strong><br />
Vol. 26 no. 7 2010, pages 979–981<br />
doi:10.1093/bioinformatics/btq046<br />
Data and text mining<br />
EBImage—an R package for image processing with applications<br />
to cellular phenotypes<br />
Grégoire Pau 1,∗ , Florian Fuchs 2 , Oleg Sklyar 1 , Michael Boutros 2 and Wolfgang Huber 1<br />
1 <strong>EMBL</strong>—European Bioinformatics Institute, Cambridge, UK and 2 German Cancer Research Center (DKFZ), Division<br />
of Signaling and Functional Genomics, University of Heidelberg, Heidelberg, Germany<br />
Associate Editor: Thomas Lengauer<br />
ABSTRACT<br />
Summary: EBImage provides general purpose functionality for<br />
reading, writing, processing and analysis of images. Furthermore,<br />
in the context of microscopy-based cellular assays, EBImage offers<br />
tools to segment cells and extract quantitative cellular descriptors.<br />
This allows the automation of such tasks using the R programming<br />
language and use of existing tools in the R environment for<br />
signal processing, statistical modeling, machine learning and data<br />
visualization.<br />
Availability: EBImage is free and open source, released under the<br />
LGPL license and available from the Bioconductor project (http://<br />
www.bioconductor.org/packages/release/bioc/html/EBImage.html).<br />
Contact: gregoire.pau@ebi.ac.uk<br />
Received on June 18, 2009; revised on November 26, 2009; accepted<br />
on February 1, 2010<br />
1 INTRODUCTION<br />
Imaging cells labeled with specific markers is a powerful method<br />
to localize cellular structures and proteins, and to characterize cell<br />
morphological changes during population progression or induced<br />
by perturbing agents. Automated phenotyping from such images<br />
generates quantitative descriptors of cellular phenotypes, which are<br />
computationally analysed to infer biological roles or functional<br />
relationships. Recent examples include characterization of genes<br />
involved in cell division by analysing time-lapse image sequences<br />
of human cells (Neumann et al., 2006), estimation of drug effects<br />
based on phenotypic changes measured in human HeLa cells (Loo<br />
et al., 2007) and identification of genes involved in cell morphology<br />
in Drosophila using RNA interference (RNAi) (Kiger et al., 2003).<br />
Cell segmentation and feature extraction are well-established<br />
steps, realized by dedicated software such as CellProfiler (Carpenter<br />
et al., 2006) or generic image processing platforms like Matlab,<br />
Labview or ImageJ. However, the analysis and interpretation of<br />
multi-parametric cellular descriptors is a more challenging task.<br />
It requires powerful statistical and machine learning methods and<br />
can be facilitated by the possibility of producing visualizations of<br />
intermediate results, by the automation of complex workflows such<br />
as cross-validation or parameter searches, and by easy access to<br />
biological metadata and genomic databases. These points motivate<br />
the use of Bioconductor (Gentleman et al., 2004), a software project<br />
∗ To whom correspondence should be addressed.<br />
based on the feature-rich R programming language, providing tools<br />
for the analysis and comprehension of genomic data.<br />
Several R packages provide some level of functionality for<br />
processing and analysing images. Rimage offers diverse filtering<br />
functions but supports only the JPEG format and cannot save images.<br />
The package ripa is dedicated to the analysis of hyperspectral images<br />
but does not provide for image segmentation. biOps offers a wide<br />
range of image filters, but only supports the JPEG and TIFF formats<br />
and lacks a fast interactive display interface. The recent package<br />
RImageJ provides R bindings to ImageJ, but does not allow easy<br />
access to the image data by R.<br />
EBImage is an image processing toolbox for R, which has been<br />
developed over the past 4 years (Sklyar and Huber, 2006). The<br />
current release 3.0 is a major redesign whose features include multidimensional<br />
image processing, a range of fast image processing<br />
functions, support of more than 80 image formats, fast interactive<br />
image display, seamless integration with R’s native array data<br />
structures and coherence of the user interface.<br />
2 DESCRIPTION<br />
Images are represented in EBImage as multi-dimensional arrays<br />
containing pixel intensity values. The two first dimensions are<br />
typically meant to be spatial, while the other ones are unspecified<br />
and can contain, e.g. colour channels, z-slices, replicates, time points<br />
or combinations of different conditions. Image representation is<br />
dissociated from rendering, and multi-dimensional arrays can be<br />
displayed as animated sequences of images in greyscale or colour<br />
mode. The interactive display interface is powered by GTK+ and<br />
supports animation, zoom and pan.<br />
As matrices, images can be manipulated in R with algebraic<br />
operators such as sum, product, comparison or convolution. These<br />
elementary operators allow a broad range of image transformations.<br />
For example, if we denote by x an image, α+βx γ is an enhanced<br />
image where the parameter α controls the brightness, β the contrast<br />
and γ the γ-factor of the transformed image. Another example<br />
includes adaptive thresholding, performed by x >x⋆m+µ, where ⋆<br />
is the fast convolution product, m a neighbourhood mask and µ<br />
an offset parameter. R also offers statistical tools to model images<br />
with natural 2D splines and provides Fourier analysis tools to detect<br />
regular patterns and deconvolute noisy images using Wiener filters.<br />
EBImage uses ImageMagick to read and save images, and<br />
supports more than 80 image formats, including JPEG, TIFF, TGA,<br />
GIF and PNG. The package also supports standard geometric<br />
transformations such as rotation, reflection, cropping, translation<br />
© The Author(s) 2010. Published by Oxford University Press.<br />
This is an Open Access article distributed under the terms of the Creative Commons Attribution Non-Commercial License (http://creativecommons.org/licenses/<br />
by-nc/2.5), which permits unrestricted non-commercial use, distribution, and reproduction in any medium, provided the original work is properly cited.
G.Pau et al.<br />
and resizing. Classical image processing tools are available: linear<br />
filtering, morphological erosion and dilation, fast distance map<br />
computation, contour delineation and area filling.<br />
Object segmentation can be performed with global or adaptive<br />
thresholding followed by connected set labeling. Specific algorithms<br />
such as watershed transform or Voronoi segmentation (Jones et al.,<br />
2005) are provided to segment touching objects. Computation of<br />
geometric and texture features (image moments, Haralick features,<br />
Zernike moments) from segmented objects is supported.<br />
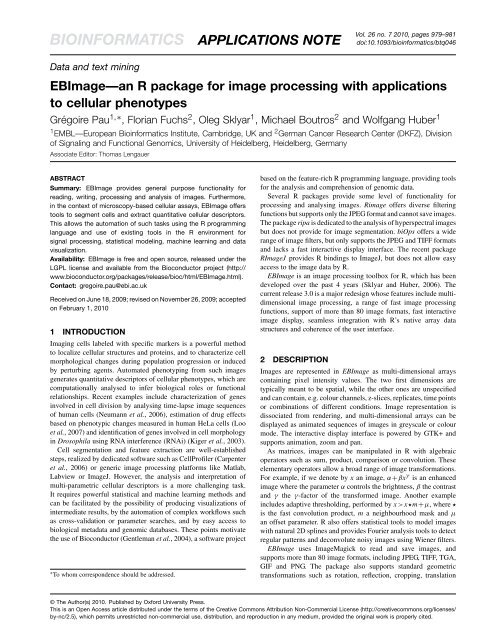
(a)<br />
Actin<br />
Tubulin<br />
DNA<br />
3 ANALYSIS OF CELLULAR PHENOTYPES<br />
RNAi is a powerful method to study the role of genes in lossof-function<br />
phenotypes. We measured the effects of two RNAi<br />
reagents on human HeLa cells by fluorescence microscopy. One cell<br />
population was transfected by a negative control, siRluc, a small<br />
interfering RNA (siRNA) targeting the Renilla firefly luciferase<br />
gene that is not present in the HeLa genome. The other population<br />
was treated with siCLSPN, an siRNA targeting the CLSPN mRNA,<br />
whose protein is involved in DNA damage response mediation. Cells<br />
were grown for 48 h, stained with immunofluorescent markers and<br />
imaged (Fig. 1).<br />
For visualization, the three channels were combined (Fig. 1a)<br />
into a colour image (Fig. 1b). Nuclei were segmented by<br />
adaptive thresholding, morphological opening and connected set<br />
labeling (Fig. 1c). Cell boundaries were determined by Voronoi<br />
segmentation, using nuclei as seeds and propagating the boundaries<br />
using a Riemann metric based on the image gradient (Fig. 1d;<br />
Jones et al., 2005). Quantitative descriptors were extracted from<br />
the cell shapes and fluorescence distributions. Negative control<br />
cells treated with siRluc showed a median cell size of 1024 µm 2 ,<br />
while targeting CLSPN led to a population of significantly enlarged<br />
cells with a median cell size of 1577 µm 2 (Wilcoxon rank sum<br />
test, P
EBImage<br />
REFERENCES<br />
Carpenter,A.E. et al. (2006) CellProfiler: image analysis software for identifying and<br />
quantifying cell phenotypes. Genome Biol., 7, R100.<br />
Gentleman,R.C. et al. (2004) Bioconductor: open software development for computational<br />
biology and bioinformatics. Genome Biol., 5, R80.<br />
Jones,T.R. et al. (2005) Voronoi-based segmentation of cells on image manifolds.<br />
Computer Vision for Biomedical Image Applications, 3765, 535–543.<br />
Kiger,A.A. et al. (2003) A functional genomic analysis of cell morphology using RNA<br />
interference. J. Biol., 2, 27.<br />
Loo,L.H. et al. (2007) Image-based multivariate profiling of drug responses from single<br />
cells. Nat. Methods, 4, 445–453.<br />
Neumann,B. et al. (2006) High-throughput RNAi screening by time-lapse imaging of<br />
live human cells. Nat. Methods, 3, 385–390.<br />
Sklyar,O. and Huber,W. (2006). Image analysis for microscopy screens. RNews, 6,<br />
12–16.<br />
981