Analysis of microarray gene expression data - EMBL
Analysis of microarray gene expression data - EMBL
Analysis of microarray gene expression data - EMBL

You also want an ePaper? Increase the reach of your titles
YUMPU automatically turns print PDFs into web optimized ePapers that Google loves.
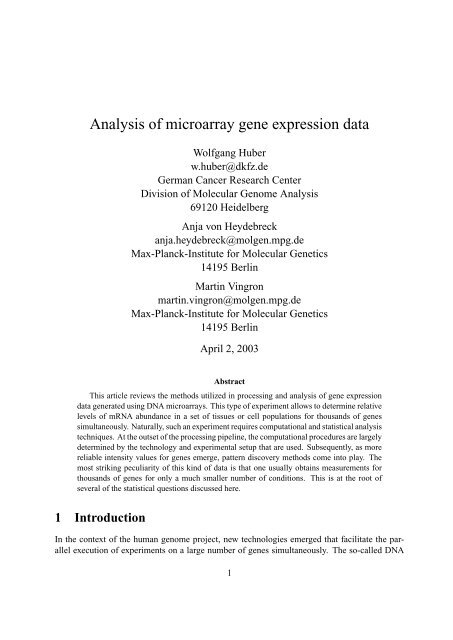
<strong>Analysis</strong> <strong>of</strong> <strong>microarray</strong> <strong>gene</strong> <strong>expression</strong> <strong>data</strong>Wolfgang Huberw.huber@dkfz.deGerman Cancer Research CenterDivision <strong>of</strong> Molecular Genome <strong>Analysis</strong>69120 HeidelbergAnja von Heydebreckanja.heydebreck@molgen.mpg.deMax-Planck-Institute for Molecular Genetics14195 BerlinMartin Vingronmartin.vingron@molgen.mpg.deMax-Planck-Institute for Molecular Genetics14195 BerlinApril 2, 2003AbstractThis article reviews the methods utilized in processing and analysis <strong>of</strong> <strong>gene</strong> <strong>expression</strong><strong>data</strong> <strong>gene</strong>rated using DNA <strong>microarray</strong>s. This type <strong>of</strong> experiment allows to determine relativelevels <strong>of</strong> mRNA abundance in a set <strong>of</strong> tissues or cell populations for thousands <strong>of</strong> <strong>gene</strong>ssimultaneously. Naturally, such an experiment requires computational and statistical analysistechniques. At the outset <strong>of</strong> the processing pipeline, the computational procedures are largelydetermined by the technology and experimental setup that are used. Subsequently, as morereliable intensity values for <strong>gene</strong>s emerge, pattern discovery methods come into play. Themost striking peculiarity <strong>of</strong> this kind <strong>of</strong> <strong>data</strong> is that one usually obtains measurements forthousands <strong>of</strong> <strong>gene</strong>s for only a much smaller number <strong>of</strong> conditions. This is at the root <strong>of</strong>several <strong>of</strong> the statistical questions discussed here.1 IntroductionIn the context <strong>of</strong> the human genome project, new technologies emerged that facilitate the parallelexecution <strong>of</strong> experiments on a large number <strong>of</strong> <strong>gene</strong>s simultaneously. The so-called DNA1
<strong>microarray</strong>s, or DNA chips, constitute a prominent example. This technology aims at the measurement<strong>of</strong> mRNA levels in particular cells or tissues for many <strong>gene</strong>s at once. To this end, singlestrands <strong>of</strong> complementary DNA for the <strong>gene</strong>s <strong>of</strong> interest - which can be many thousands - are immobilizedon spots arranged in a grid (”array”) on a support which will typically be a glass slide,a quartz wafer, or a nylon membrane. From a sample <strong>of</strong> interest, e.g. a tumor biopsy, the mRNAis extracted, labeled and hybridized to the array. Measuring the quantity <strong>of</strong> label on each spotthen yields an intensity value that should be correlated to the abundance <strong>of</strong> the correspondingRNA transcript in the sample.Two schemes <strong>of</strong> labeling are in common use today. One variant labels a single sample, either radioactivelyor fluorescently. Radioactive labeling is used, e.g., in conjunction with hybridizationon nylon membranes [1]. The company Affymetrix synthesizes sets <strong>of</strong> short oligomers on a glasswafer and uses a single fluorescent label ([2], see also www.affymetrix.com). Alternatively, twosamples are labeled with a green and a red fluorescent dye, respectively. The mixture <strong>of</strong> the twomRNA preparations is then hybridized simultaneously to a common array on a glass slide. Thistechnology is usually refered to as the Stanford technology [3]. Quantification utilizes a laserscanner that determines the intensities <strong>of</strong> each <strong>of</strong> the two labels over the entire array. Recently,companies like Agilent have immobilized long oligomers <strong>of</strong> 60 to 70 basepairs length and usedtwo-color labeling.The parallelism in this kind <strong>of</strong> experiment lies in the hybridization <strong>of</strong> mRNA extracted from asingle sample to many <strong>gene</strong>s simultaneously. The measured abundances, though, are not obtainedon an absolute scale. This is because they depend on many hard to control factors such as theefficiencies <strong>of</strong> the various chemical reactions involved in the sample preparation, as well as onthe amount <strong>of</strong> immobilized DNA available for hybridization.The class <strong>of</strong> transcripts that is probed by a spot may differ in different applications. Most commonly,each spot is meant to probe a particular <strong>gene</strong>. The representative sequence <strong>of</strong> DNA onthe spot may be either a carefully selected fragment <strong>of</strong> cDNA, a more arbitrary PCR product amplifiedfrom a clone matching the <strong>gene</strong>, or one <strong>of</strong> a set <strong>of</strong> oligonucleotides specific for the <strong>gene</strong>.Another level <strong>of</strong> sophistication is reached when a spot represents, e.g., a particular transcript <strong>of</strong>a <strong>gene</strong>. In this case, or for the distinction <strong>of</strong> mRNA abundances <strong>of</strong> <strong>gene</strong>s from closely related<strong>gene</strong> families, careful design and/or selection <strong>of</strong> the immobilized DNA is required. Likewise,the selection <strong>of</strong> samples to study and to compare to each other using DNA <strong>microarray</strong>s requirescareful planning as will become clear upon consideration <strong>of</strong> the statistical questions arising fromthis technology [4, 5, 6].There are many different ways for the outline <strong>of</strong> a <strong>microarray</strong> experiment. In many cases, adevelopment in time is studied leading to a series <strong>of</strong> hybridizations following each other. Alternatively,different conditions like healthy/diseased or different disease types may be studied. We<strong>gene</strong>rally refer to a time point or a state as a condition and typically for each condition severalreplicate hybridizations are performed. The replicates should provide the information necessaryto judge the significance <strong>of</strong> the conclusions one wishes to draw from the comparison <strong>of</strong> the differentconditions. When going deeper into the subject it soon becomes clear that this simpleoutline constitutes a rather challenging program.This article is organized along the various steps <strong>of</strong> analysis <strong>of</strong> a <strong>microarray</strong> experiment. Statisticalproblems arise firstly as a consequence <strong>of</strong> the many technical peculiarities and their solution is a2
prerequisite to any meaningful subsequent interpretation <strong>of</strong> the experiment. Section 2 describessome <strong>of</strong> the issues related to quality control. Visualization methods are introduced because theymay greatly help both in detecting and removing obviously failed measurements, as well as infinding more subtle systematic biases associated with variations in experimental conditions.Microarray measurements are subject to multiple sources <strong>of</strong> experimental variation, the mathematicaltreatment <strong>of</strong> which are discussed in Section 3. Some <strong>of</strong> the variations are systematic,and may be explicitly corrected for, others are random, and may be accounted for through anerror model. The correction for systematic effects is refered to as calibration or normalization.We will discuss two error models: One involving a constant coefficient <strong>of</strong> variation, i. e. a purelymultiplicative noise term, and one allowing for a more <strong>gene</strong>ral variance-to-mean dependence,with a noise term that has both multiplicative and additive components. From these models wederive measures <strong>of</strong> relative abundance <strong>of</strong> mRNA.The goal <strong>of</strong> many <strong>microarray</strong> experiments is to identify <strong>gene</strong>s that are differentially transcribedwith respect to different biological conditions <strong>of</strong> cell cultures or tissue samples. Section 4 focuseson these issues, paying particular attention to the notoriously low numbers <strong>of</strong> repeatedhybridizations per condition in relation to the high numbers <strong>of</strong> <strong>gene</strong>s about which one wants tomake conclusions. Section 5 proceeds to highlight some <strong>of</strong> the issues in pattern discovery in<strong>microarray</strong> <strong>data</strong>. Here, again, classical methods <strong>of</strong> <strong>data</strong> analysis need to be carefully evaluatedwith respect to their applicability to the particular type <strong>of</strong> <strong>data</strong> at hand. A short summary will begiven <strong>of</strong> the methods that have so far been successfully applied. Emphasis is given to exploratoryapproaches that allow the subsequent formulation <strong>of</strong> hypothesis that can be tested either throughfurther analysis or further experiments.2 Data visualization and quality controlA <strong>microarray</strong> experiment consists <strong>of</strong> the following components: a set <strong>of</strong> probes, an array onwhich these probes are immobilised at specified locations, a sample containing a complex mixture<strong>of</strong> labeled biomolecules that can bind to the probes, and a detector that is able to measurethe spatially resolved distribution <strong>of</strong> label after it has bound to the array [7]. The probes arechosen such that they bind to specific sample molecules; for DNA arrays, this is ensured by thehigh sequence-specificity <strong>of</strong> the hybridization reaction between complementary DNA strands.The array is typically a glass slide or a nylon membrane. The sample molecules may be labeledthrough the incorporation <strong>of</strong> radioactive markers, such as 33 P, or <strong>of</strong> fluorescent dyes, such as phycoerythrin,Cy3, or Cy5. After exposure <strong>of</strong> the array to the sample, the abundance <strong>of</strong> individualspecies <strong>of</strong> sample molecules can be quantified through the signal intensity at the matching probesites. To facilitate direct comparison, the spotted array technology developed in Stanford [3]involves the simultaneous hybridization <strong>of</strong> two samples labeled with different fluorescent dyes,and detection at the two corresponding wavelengths. Fig. 1 shows an example.3
Figure 1: The detected intensity distributions from a cDNA <strong>microarray</strong> for a region comprisingaround 80 probes. The total number <strong>of</strong> probes on an array may range from a few dozens to tens<strong>of</strong> thousands. Left panel: grey-scale representation <strong>of</strong> the detected label fluorescence at 635 nm(red), corresponding to mRNA sample A. Right panel: label fluorescence at 532 nm (green),corresponding to mRNA sample B. Spots that light up in only one <strong>of</strong> the two images correspondto <strong>gene</strong>s that are only transcribed in one <strong>of</strong> the two samples. Middle panel: false-color overlayimage from the two intensity distributions. The spots are red, green, or yellow, depending onwhether the <strong>gene</strong> is transcribed only in sample A, sample B, or both.2.1 Image quantification.The intensity images are scanned by the detector at a high spatial resolution, such that each probespot is represented by many pixels. In order to obtain a single overall intensity value for eachprobe, the corresponding pixels need to be identified (segmentation), and the intensities needto be summarized (quantification). In addition to the overall probe intensity, further auxiliaryquantities may be calculated, such as an estimate <strong>of</strong> apparent unspecific “local background”intensity, or a spot quality measure. A variety <strong>of</strong> segmentation and quantification methods isimplemented in available s<strong>of</strong>tware packages. They differ in their robustness against irregularitiesand in the amount <strong>of</strong> human interaction that they require. Different types <strong>of</strong> irregularities mayoccur in different types <strong>of</strong> <strong>microarray</strong> technology, and a segmentation or quantification algorithmthat is good for one platform is not necessarily suitable for another. For instance, the variation <strong>of</strong>spot shapes and positions that the segmentation has to deal with depends on the properties <strong>of</strong> thesupport (e. g. glass or nylon), on the probe delivery mechanism (e. g. quill-pen type, pin and ringsystems, ink jetting), and on the detection method (optical or radioactive). Furthermore, largervariations in the spot positioning from array to array can be expected in home-made arrays thanin mass produced ones. An evaluation <strong>of</strong> image analysis methods for spotted cDNA arrays wasreported by Yang et al. [8].For a <strong>microarray</strong> project, the image quantification marks the transition in the work flow from“wet lab” procedures to computational ones. Hence, this is a good point to spend some effortlooking at the quality and plausibility <strong>of</strong> the <strong>data</strong>. This has several aspects: confirm that positiveand negative controls behave as expected; verify that replicates yield measurements close to eachother; and check for the occurrence <strong>of</strong> artifacts, biases, or errors. In the following we present a4
0 100 300−200 0 200 400 600 800Figure 2: Histogram <strong>of</strong> probe intensities at the green wavelength for a cDNA <strong>microarray</strong> similarto the one depicted in Fig. 1. The intensities were determined, in arbitrary units, by an imagequantification method, and “local background” intensities were subtracted. Due to measurementnoise, this lead to non-positive probe intensities for part <strong>of</strong> the <strong>gene</strong>s with low or zero abundance.The x-axis has been cut <strong>of</strong>f at the 99% quantile <strong>of</strong> the distribution. The maximum value is about4000.number <strong>of</strong> <strong>data</strong> exploration and visualization methods that may be useful for these tasks.2.2 Dynamic range and spatial effectsA simple and fundamental property <strong>of</strong> the <strong>data</strong> is the dynamic range and the distribution <strong>of</strong>intensities. Since many experimental problems occur at the level <strong>of</strong> a whole array or the samplepreparation, it is instructive to look at the histogram <strong>of</strong> intensities from each sample. An exampleis shown in Fig. 2. Typically, for arrays that contain quasi-random <strong>gene</strong> selections, one observesa unimodal distribution with most <strong>of</strong> its mass at small intensities, corresponding to <strong>gene</strong>s thatare not or only weakly transcribed in the sample, and a long tail to the right, corresponding to<strong>gene</strong>s that are transcribed at various levels. In most cases, the occurence <strong>of</strong> multiple peaks inthe histogram indicates an experimental artifact. To get an overview over multiple arrays, it isinstructive to look at the box plots <strong>of</strong> the intensities from each sample. Problematic arrays shouldbe excluded from further analysis.Crude artifacts, such as scratches or spatial inhomo<strong>gene</strong>ities, will usually be noticed alreadyfrom the scanner image at the stage <strong>of</strong> the image quantification. Nevertheless, to get a quickand potentially more sensitive view <strong>of</strong> spatial effects, a false color representation <strong>of</strong> the probeintensities as a function <strong>of</strong> their spatial coordinates can be useful. There are different optionsfor the intensity scaling, among them the linear, logarithmic, and rank scales. Each one willhighlight different features <strong>of</strong> the spatial distribution. Examples are shown in Fig. 3.2.3 ScatterplotUsually, the samples hybridized to a series <strong>of</strong> arrays are biologically related, such that the transcriptionlevels <strong>of</strong> a large fraction <strong>of</strong> <strong>gene</strong>s are approximately the same across the samples. Thiscan be expected e. g. for cell cultures exposed to different conditions or for cells from biopsies <strong>of</strong>5
maxa) b) c) d) e) f)Figure 3: False color representations <strong>of</strong> the spatial intensity distributions from three different64 × 136 spot cDNA <strong>microarray</strong>s from one experiment series. a) probe intensities in the redcolor channel, b) local background intensities, c) background-subtracted probe intensities. In a)and b), there is an artifactual intensity gradient, which is mostly removed in c). For visualization,the color scale was chosen in each image to be proportional to the ranks <strong>of</strong> the intensities. d)For a second array, probe intensities in the green color channel. There is a rectangular region<strong>of</strong> low intensity in the top left corner, corresponding to one print-tip. Apparently, there was asporadic failure <strong>of</strong> the tip for this particular array. Panels e) and f) show the probe intensitiesin the green color channel from a third array. The color scale was chosen proportional to thelogarithms <strong>of</strong> intensities in e) and proportional to the ranks in f). Here, the latter provides bettercontrast. Interestingly, the bright blob in the lower right corner appears only in the green colorchannel, while the half moon shaped region appears both in green and red (not shown).min6
R0 2000 4000 60000 2000 4000 6000GFigure 4: Scatterplot <strong>of</strong> probe intensities in the red and the green color channel from a cDNAarray containing 8000 probes.M = log 2 R − log 2 G−4 −2 0 210 15 20 25A = log 2 R + log 2 GM = log 2 (R + c) − log 2 G−4 −2 0 210 15 20 25A = log 2 (R + c) + log 2 Ga)Figure 5: a) the same <strong>data</strong> as in Fig. 4, after logarithmic transformation and clockwise rotation by45 ◦ . The dashed line shows a local regression estimate <strong>of</strong> the systematic effect M 0 (A), see text.b) similar to a), however a constant value c = 42 has been added to the red intensities before logtransformation. After this, the estimated curve for the systematic effect M 0 (A) is approximatelyconstant.b)the same tissue type, possibly subject to different disease conditions. We call this the majority <strong>of</strong><strong>gene</strong>s unchanged property. Visually, it can be verified from the scatterplot <strong>of</strong> the probe intensitiesfor a pair <strong>of</strong> samples. An example is shown in Fig. 4.The scatterplot allows to assess both measurement noise and systematic biases. Ideally, the <strong>data</strong>from the majority <strong>of</strong> the <strong>gene</strong>s that are unchanged should lie on the bisector <strong>of</strong> the scatterplot. Inreality, there are both systematic and random deviations from this [9]. For instance, if the labelincorporation rate and photoefficiency <strong>of</strong> the red dye were systematically lower than that <strong>of</strong> thegreen dye by a factor <strong>of</strong> 0.75, the <strong>data</strong> would be expected not to lie on the bisector, but rather onthe line y = 0.75x.Most <strong>of</strong> the <strong>data</strong> in Fig. 4 is squeezed into a tiny corner in the bottom left <strong>of</strong> the plot. Moreinformative displays may be obtained from other axis scalings. A frequently used choice is thedouble-logarithmic scale. An example is shown in Fig. 5. It is customary to transform to new7
variables A = log R+log G, M = log R−log G [10]. Up to a scale factor <strong>of</strong> √ 2, this correspondsto a clockwise coordinate system rotation by 45 ◦ . The horizontal coordinate A is a measure <strong>of</strong>average transcription level, while the log-ratio M is a measure for differential transcription.If the majority <strong>of</strong> <strong>gene</strong>s are not differentially transcribed, the scatter <strong>of</strong> the <strong>data</strong> points in thevertical direction may be considered a measure <strong>of</strong> the random variation. Fig. 5a also shows asystematic deviation <strong>of</strong> the observed values <strong>of</strong> M from the line M = 0, estimated through a localregression line 1 . There is an apparent dependence M 0 (A) <strong>of</strong> this deviation on the mean intensityA. However, this is most likely an artifact <strong>of</strong> applying the logarithmic transformation: as shownin Fig. 5b, the deviation may be explained sufficiently well through a constant M 0 (A) = M 0 ifan appropriate <strong>of</strong>fset is added to the R values before taking the logarithm. Note that a horizontalline at M = M 0 in Fig. 5b corresponds to a straight line <strong>of</strong> slope 2 M 0and with intercept c inFig. 4.Fig. 5 shows the heteroskedasticity <strong>of</strong> log-ratios: while the variance <strong>of</strong> M is relatively smalland approximately constant for large average intensities A, it becomes larger as A decreases.Conversely, examination <strong>of</strong> the differences R − G, for example through plots like in Fig. 4,shows that their variance is smallest for small values <strong>of</strong> the average intensity R+G and increaseswith R + G. Sometimes, one wishes to visualize the <strong>data</strong> in a manner such that the variance isconstant along the whole dynamic range. A <strong>data</strong> transformation that achieves this goal is calleda variance-stabilizing transformation. In fact, homoskedastic representations <strong>of</strong> the <strong>data</strong> are notonly useful for visualization, but also for further statistical analyses. This will be discussed inmore detail in Section 3.Two extensions <strong>of</strong> the scatterplot are shown in Figs. 6 and 7. Rather than plotting a symbol forevery <strong>data</strong> point, they use a density representation, which may be useful for larger arrays. For example,Fig. 6 shows the scatterplot from the comparison <strong>of</strong> two tissue samples based on 152,000probes 2 . The point density in the central region <strong>of</strong> the plot is estimated by a kernel density estimator.Three-way comparisons may be performed through a projection such as in Fig. 7. Thisuses the fact that the (1, 1, 1)-component <strong>of</strong> a three-way <strong>microarray</strong> measurement corresponds toaverage intensity, and hence is not directly informative with respect to differential transcription.Note that if the plotted <strong>data</strong> was pre-processed through a variance-stabilizing transformation, itsvariance does not depend on the (1, 1, 1)-component.2.4 Batch effectsPresent day <strong>microarray</strong> technology measures abundances only in terms <strong>of</strong> relative probe intensities,and <strong>gene</strong>rally provides no calibration to absolute physical units. Hence, the comparison<strong>of</strong> measurements between different studies is difficult. Moreover, even within a single study,the measurements are highly susceptible to batch effects. By this term, we refer to experimentalfactors that (i) add systematic biases to the measurements, and (ii) may vary between differentsubsets or stages <strong>of</strong> an experiment. Some examples are [9]:1 We used loess [11] with default parameters span=0.75, degree=2.2 The arrays used were RZPD Uni<strong>gene</strong>-II arrays (www.rzpd.de).8
4N0 − normal20−2−4nme1c−myctrail−60 2 4 6 8 10 12 14 16 18N0 + normalFigure 6: Scatterplot <strong>of</strong> a pairwise comparison <strong>of</strong> non-cancerous colon tissue and a colorectaltumor. Individual transcripts are represented by ’x’ symbols. The x-coordinate is the average<strong>of</strong> the appropriately calibrated and transformed intensities (cf. Section 3). The y-coordinate istheir difference, and is a measure <strong>of</strong> differential transcription. The array used in this experimentcontained 152,000 probes representing around 70,000 different clones. Since plotting all <strong>of</strong> thesewould lead to an uninformative solid black blob in the centre <strong>of</strong> the plot, the point density isvisualized by a color scale, and only 1500 <strong>data</strong> points in sparser regions are individually plotted.1. spotting: to manufacture spotted <strong>microarray</strong>s, the probe DNA is deposited on the surfacethrough spotting pins. Usually, the robot works with multiple pins in parallel, and the efficiency<strong>of</strong> their probe delivery may be quite different (e. g. Fig. 3d or [10]). Furthermore,the efficiency <strong>of</strong> a pin may change over time through mechanical wear, and the quality <strong>of</strong>the spotting process as a whole may be different at different times, due to varying temperatureand humidity conditions.2. PCR amplification: for cDNA arrays, the probes are synthesized through PCR, whoseyield varies from instance to instance. Typically, the reactions are carried out in parallelin 384-well plates, and probes that have been synthesized in the same plate tend to havehighly correlated variations in concentration and quality. An example is shown in Fig. 8.3. sample preparation protocols: The reverse transcription and the labeling are complex biochemicalreactions, whose efficiencies are variable and may depend sensitively on a number<strong>of</strong> hard-to-control circumstances. Furthermore, RNA can quickly degrade, hence theoutcome <strong>of</strong> the experiment can depend sensitively on when and how conditions that preventRNA degradation are applied to the tissue samples.4. array coating: both the efficiency <strong>of</strong> the probe fixation on the array, as well as the amount<strong>of</strong> unspecific background fluorescence strongly depend on the array coating.5. scanner and image analysis9
6tumor N14(−X −Y + 2Z) / 320−2normalnme1c−myctrailtumor N0−4−6 −5 −4 −3 −2 −1 0 1 2 3 4 5Y − XFigure 7: Scatterplot <strong>of</strong> a triple comparison between non-cancerous colon tissue, a lymph-nodenegative colorectal tumor (N0), and a lymph-node positive tumor (N1). The measurements fromeach probe correspond to a point in three-dimensional space, and are projected orthogonally on aplane perpendicular to the (1,1,1)-axis. The three coordinate axes <strong>of</strong> the <strong>data</strong> space correspond tothe vectors from the origin <strong>of</strong> the plot to the three labels “normal”, “tumor N0”, and “tumor N1”.The (1,1,1)-axis corresponds to average intensity, while differences between the three tissues arerepresented by the position <strong>of</strong> the measurements in the two-dimensional plot plane. For instance,both c-myc and nme1 are higher transcribed in the N0 and in the N1 tumor, compared to the noncanceroustissue. However, while the increase is approximately balanced for c-myc in the twotumors, nme1 (nucleoside diphosphate kinase A) is more upregulated in the N1 tumor than in theN0 tumor, a behavior that is consistent with a <strong>gene</strong> involved in tumor progression. On the otherside, the apoptosis inducing receptor trail-r2 is down-regulated specifically in the N1 tumors,while it has about the same intermediate-high transcription level in the non-cancerous tissue andthe N0 tumor. Similar behavior <strong>of</strong> these <strong>gene</strong>s was observed over repeated experiments.10
These considerations have important consequences for the experimental design: first, any variationthat can at any means be avoided within an experiment should be avoided. Second, anyvariation that cannot be avoided should be organized in such a manner that it does not confoundthe biological question <strong>of</strong> interest. Clearly, when looking for differences between two tumortypes, it would not be wise to have samples <strong>of</strong> one tumor type processed by one laboratory, andsamples <strong>of</strong> the other type by another laboratory.Points 1 and 2 are specific for spotted cDNA arrays. To be less sensitive against these variations,the two-color labeling protocol is used, which employs the simultaneous hybridization <strong>of</strong> twosamples to the same array [3]. Ideally, if only ratios <strong>of</strong> intensities between the two color channelsare considered, variations in probe abundance should cancel out. Empirically, they do not quite,which may, for example, be attributed to the fact that observed intensities are the sum <strong>of</strong> probespecificsignal and unspecific background [12]. Furthermore, in the extreme case <strong>of</strong> total failure<strong>of</strong> the PCR amplification or the DNA deposition for probes on some, but not all arrays in anexperimental series, artifactual results are hardly avoidable.If any <strong>of</strong> the factors 3–5 is changed within an experiment, there is a good chance that this willlater show up in the <strong>data</strong> as one <strong>of</strong> the most pronounced sources <strong>of</strong> variation. A simple andinstructive visual tool to explore such variations is the correlation plot: Given a set <strong>of</strong> d arrays,each represented through a high-dimensional vector ⃗ Y i <strong>of</strong> suitably transformed and filtered probeintensities, calculate the d×d correlation matrix corr( ⃗ Y i , ⃗ Y j ), sort its rows and columns accordingto different experimental factors, and visualize the resulting false color images.3 Error models, calibration and measures <strong>of</strong> differential <strong>expression</strong>The relation between a measured intensity y ki <strong>of</strong> probe k and the true abundance x ki <strong>of</strong> moleculetype k in sample i may be described asy ki = a ki + b ki x ki . (1)The gain factor b ki represents the net result <strong>of</strong> the various experimental effects that come betweenthe count <strong>of</strong> molecules per cell in the sample and the final readout <strong>of</strong> the probe intensity, suchas: number <strong>of</strong> cells in the sample, the mean number <strong>of</strong> label molecules attaching to a samplemolecule, hybridization efficiency, label efficiency, and detector gain. The additive term a kiaccounts for that part <strong>of</strong> the measured intensity that does not result from x ki , but from effectssuch as unspecific hybridization, background fluorescence, stray signal from neighboring probes,and detector <strong>of</strong>fset.The parameters a ki and b ki are different for each probe k and for each hybridization i. It isnot practical to determine them exactly, but neither is it necessary. Rather, one is content withobtaining statistical statements about relative abundances. To this end, one may build stochasticmodels for the effects a ki and b ki . Different variations on this theme have been proposed, as willbe presented below.First, however, we would like to discuss the functional form <strong>of</strong> Eqn. (1), whose major statementis that when the true abundance x ki increases, the measured signal y ki increases proportionally.12
Could it be necessary to consider more complex non-linear relationships? Clearly, this cannotbe ruled out for all possible experiments, or for future technologies. However, a linear operatingrange over several orders <strong>of</strong> magnitude has been reported by a number <strong>of</strong> authors for current<strong>microarray</strong> technologies (e. g. [13, 14, 15]). At the lower end, this range is limited only by therequirement that x ki be non-negative. At the upper end, the linear range is limited by saturationeffects such as quenching, limited probe abundance, and detector saturation. However, forrealistic concentrations <strong>of</strong> sample molecules, the upper limit is not reached in well-conductedexperiments.3.1 Multiplicative calibration and noiseIn a seminal paper in 1997, Chen et al. [16] introduced a decomposition <strong>of</strong> the multiplicativeeffect (cf. Eqn. (1)),b ki = b i β k (1 + ε ki ). (2)Here, β k is a probe-specific coefficient, the same for all samples. For each sample i, the normalizationfactor b i is applied across all probes. The remaining variation in b ki that cannot beaccounted for by β k and b i is absorbed by ε ki . Furthermore, since the measured intensities y ki arealready “background-corrected” by the image analysis s<strong>of</strong>tware’s local background estimation,Chen et al. assumed the additive effects a ki to be negligibly small. They further simplified theproblem in two steps:First, they noted that one is mainly interested in relative comparisons between the levels <strong>of</strong> thesame <strong>gene</strong> under different conditions, i. e. , in the ratios x ki /x kj . Hence the probe-specific effectsβ k can be absorbed, µ ki = β k x ki , simply rescaling the units in which molecule abundances aremeasured, and need not be determined.Second, they turned to a stochastic description, and modeled ε ki as a normally distributed noiseterm with mean zero and standard deviation c, independent <strong>of</strong> i and k. Thus, in the model <strong>of</strong>Chen et al. the measured intensity Y ki is a random variable and depends on the true level µ ki asfollows:Y ki = b i µ ki (1 + ε ki ), ε ki ∼ N(0, c 2 ). (3)Note that Y ki has constant coefficient <strong>of</strong> variation c.Chen et al. specifically considered two-color cDNA <strong>microarray</strong>s, where i = 1, 2 represents thered and the green color channel, respectively. For a given true ratio µ k1 /µ k2 , Chen et al. derivedthe distribution <strong>of</strong> the observed, normalized ratio M k = Y k2 /Y k1 × b 1 /b 2 . It only depends onthe values <strong>of</strong> c and b 1 /b 2 , and Chen et al. gave an algorithm for the estimation <strong>of</strong> these parametersfrom the <strong>data</strong>. Based on this, they were able to formulate a statistical test for differential<strong>expression</strong>, i. e. a test against the hypothesis µ k1 = µ k2 . Hence, the ratios M k were regarded asa sufficient summary <strong>of</strong> the results from a single <strong>microarray</strong> slide, and they, or their logarithms,would then be used as the input for further higher level analyses <strong>of</strong> <strong>data</strong> from multiple slides.To allow for a more systematic analysis <strong>of</strong> multiple slide experiments, Kerr et al. proposed anapproach based on the ANOVA technique [17]. They modeled the measured intensity Y kjlm <strong>of</strong>probe k on slide j, in the color channel <strong>of</strong> dye l, from a sample that received treatment m, aslog Y kjlm = g k + s j + d l + v m + [gs] kj + [gv] km + ε kjlm . (4)13
Here, g k , s j , d l , v m are main effects for probe, array, dye, and treatment, respectively. The probearrayinteraction [gs] kj accounts for variations <strong>of</strong> probe quality in the array manufacture, andthe probe-treatment interaction [gv] km for differential levels <strong>of</strong> transcription <strong>of</strong> <strong>gene</strong> g betweendifferent treatment groups m. The noise terms ε kjlm account for all other variations and areassumed to be independent and identically distributed. The ANOVA model (4) is related toEqn. (1) by settinga ki = 0 (5)log b ki + log x ki = (s j + d l + [gs] kj ) + (g k + v m + [gv] km ) + ε kjlm (6)where j ≡ j(i), l ≡ l(i) and m ≡ m(i) are slide, dye, and treatment associated with sample i,respectively. The terms in the first pair <strong>of</strong> parentheses on the right hand side <strong>of</strong> Eqn. (6) may beattributed to the measurement gain b ki , and the terms in the second pair to the actual abundancex ki , but <strong>gene</strong>rally such a decomposition is not unique.Both the models <strong>of</strong> Chen et al. and <strong>of</strong> Kerr et al. were formulated with reference to the two-colorcDNA array technology. However, Eqn. (4) can be adapted (in fact, simplified) in a straightforwardmanner to <strong>data</strong> from one-color array technologies, such as Affymetrix <strong>gene</strong>chips or cDNAmembranes with radioactive labeling. Furthermore, to represent more complex experimentaldesigns than simple two-way comparisons, more detailed terms than the single factor v m canbe introduced into (4), and the efficiencies <strong>of</strong> different designs can be compared using standardtechniques for linear models [4].3.2 LimitationsThe concepts <strong>of</strong> Section 3.1 have been widely used for <strong>microarray</strong> <strong>data</strong> analysis. However, it hasalso become clear that, for many <strong>data</strong> sets that are encountered in practice, they are not sufficient.The following points are worth noting:1. Robustness. In order to make model (3) identifiable, Chen et al. assumed that the transcriptionlevels <strong>of</strong> all <strong>gene</strong>s were unchanged, and set µ k1 = µ k2 for all k. Thus, theirmodel is misspecified for the part <strong>of</strong> the <strong>data</strong> arising from truely differentially transcribed<strong>gene</strong>s, which act as outliers. However, their parameter estimation is based on least-squarescriteria,and may be sensitive to the presence <strong>of</strong> such outliers. Besides that, outliers maybe caused by technical artifacts.2. Heteroskedasticity. The significance <strong>of</strong> log-ratios depends on the absolute values <strong>of</strong> theintensities in the numerator and denominator [18, 19, 20, 21, 22]. Typically, the variance<strong>of</strong> log-transformed intensities increases as their mean decreases.3. Apparent non-linearities. According to the above models, the <strong>data</strong> from a pair <strong>of</strong> samplesshould lie along a straight line in the scatterplot <strong>of</strong> the log-transformed intensities. However,in real <strong>data</strong>, several authors have observed <strong>data</strong> that follows a curved line, e. g. Fig. 5,[18, 20, 10].14
4. Negative values. While the image quantification’s estimates for probe “foreground” and“background” intensities are <strong>gene</strong>rally positive, this is usually not true for their difference.If a <strong>gene</strong> is weakly or not expressed, it can happen by chance that the background estimateis larger than the foreground estimate (cf. Fig. 2). However, non-positive values makesense neither for ratios nor for the log-transformation.To address these problems, various fixes have been proposed. We give a brief and incompletereview.1. Robustness. Robust estimation techniques in the context <strong>of</strong> <strong>microarray</strong> <strong>data</strong> have been describedby many authors (e. g. [18, 20, 10, 23, 24]). A <strong>gene</strong>ral overview is given in [25].2. Heteroskedasticity. It is <strong>of</strong>ten observed that the variance <strong>of</strong> the log-ratio is a monotonouslydecreasing function <strong>of</strong> the mean intensity. One common practice has been to discard the logratioscalculated from intensities below a certain threshold and to treat the rest as if they werehomoskedastic.Newton et al. [19] proposed a shrinkage estimatory ′ k1 + νy ′ k2 + ν (7)to replace the naive ratio y ′ k1 /y′ k2 . Here, y′ ki = y ki/b i are the normalized intensities. Similar toChen et al., they neglected the additive terms a ki and used a model <strong>of</strong> the measurement error witha constant coefficient <strong>of</strong> variation. To arrive at (7), they enclosed this in a hierarchical Bayesianmodel, using a prior distribution for the mRNA abundances, and, in particular, their positivity.The form <strong>of</strong> this distribution is reflected by the shrinkage parameter ν, which is estimated fromthe <strong>data</strong>. To infer differential transcription, they derived “posterior odds <strong>of</strong> change”, which,however, are no simple function <strong>of</strong> the log-ratio or <strong>of</strong> (7).Several authors have addressed the problem <strong>of</strong> heteroskedasticity by estimating the variance <strong>of</strong>the log-ratios or <strong>of</strong> log-transformed intensities separately for each <strong>gene</strong> (e. g. [10, 23]). However,in many applications the number <strong>of</strong> samples available is too small for reliable estimates <strong>of</strong> <strong>gene</strong>specificvariance, hence it has been proposed to estimate the variance as a non-parametric smoothfunction <strong>of</strong> the mean intensity, through a local regression. The log-ratios may then be studentizedby dividing them by their locally estimated standard deviation [20]. Baggerly et al. [22] providedsome theoretical foundation for this from models <strong>of</strong> the measurement error for different levels <strong>of</strong>replication. According to these, the variance <strong>of</strong> the log-ratio is largest for small intensities andexponentially decreases towards an asymptotic positive value as the intensity increases.3. Apparent non-linearities. To correct for the curved appearence <strong>of</strong> the scatterplot <strong>of</strong> logtransformed<strong>data</strong>, Dudoit et al. [10] proposed to replace the normalization factor b 1 /b 2 in Eqn. (3)by a smooth function M 0 (A) (cf. Fig. 5). It is estimated through robust local regression [11] and,by construction, this correction makes the scatterplot look straight.A similar correction was proposed by Kepler et al. [20], in the framework <strong>of</strong> a model similarto Eqn. (4). In their approach, the terms s j + d l (slide and dye effects) are replaced by smoothfunctions <strong>of</strong> g k (mean logarithmic abundance <strong>of</strong> <strong>gene</strong> k), which are again estimated throughrobust local regression.15
4. Negative values. In order to be able to calculate ratios and logarithms from real <strong>microarray</strong><strong>data</strong>, different fixes have been proposed to deal with non-positive values: mark them as invalidor missing; replace them by a fixed, small positive value; use an imputation algorithm to replacethem by a more acceptable value; add pseudocounts, such that the whole set <strong>of</strong> intensitiesbecomes positive; ignore the local background estimate (cDNA arrays) or the mismatch probes(Affymetrix <strong>gene</strong>chips) and use only the strictly positive foreground or perfect match intensities.All <strong>of</strong> these approaches seem to reflect the common wisdom that molecule abundances are notnegative. However, probe intensities are only measurements <strong>of</strong> abundance, and in the presence <strong>of</strong>an additive component <strong>of</strong> the measurement noise negative measurements may well be consistentwith zero or positive abundance. In any experiment, a certain proportion <strong>of</strong> <strong>gene</strong>s will have zeroor low abundance in some samples but not in others, hence the treatment <strong>of</strong> the non-positiveintensity measurements may affect a large and potentially informative fraction <strong>of</strong> the <strong>data</strong>.3.3 Multiplicative and additive calibration and noiseInterestingly, points 2.-4. <strong>of</strong> the previous section can be related to a rather basic assumption <strong>of</strong>the models (3) and (4), and it appears that in many cases the associated problems can be resolvedby using a more <strong>gene</strong>ral model. Chen et al. as well as Kerr et al. assumed that the additive termsa ki in Eqn. (1) were negligible, or at least sufficiently accounted for by the image quantification’slocal background estimation algorithm. One way to arrive at a more realistic model is to seta ki = a i + b i η ki , (8)b ki = b i β k (1 + ε ki ), (9)where the decomposition <strong>of</strong> the multiplicative effect (9) is the same as in Eqn. (2), a i is a samplespecificadditive parameter, and η ki are independent and normally distributed random variableswith zero mean and common variance. Hence, model (3) is replaced byY ki − a ib i= µ ki e ε ki+ η ki , ε ki ∼ N(0, c 2 ), η ki ∼ N(0, s 2 ). (10)Model (10) was proposed by Rocke and Durbin [26] and, using different distributional assumptions,by Ideker et al. [13]. The latter authors used a more detailed parameterization <strong>of</strong> the noiseterms, allowing for different values <strong>of</strong> the standard deviations c and s for the red and green colorchannels i = 1, 2 and for correlation between ε k1 and ε k2 , as well as between η k1 and η k2 . In bothcases, the authors did not try to estimate the calibration parameters a i , b i , but rather assumed thata calibration had already been performed through some other means.Consequences. First, the intensities Y ki are no longer supposed to have a constant coefficient<strong>of</strong> variation. Rather, they obey a variance-to-mean dependencev(u) = c 2 (u − a i ) 2 + b 2 i s 2 (11)where, in a slight abuse <strong>of</strong> notation, v ≡ Var(Y ki ) and u ≡ E(Y ki ), and the equation holds for allprobes k for sample i. Recall that a constant coefficient <strong>of</strong> variation corresponds to a dependence16
−2 −1 0 1 2arsinh(x)log(x) + log(2)−2 0 2 4Figure 9: Solid line: graph <strong>of</strong> the function arsinh(x). Dashed line: graph <strong>of</strong> log(2x). The verticalline marks the singularity <strong>of</strong> the logarithm function at x = 0. The arsinh function is symmetric,arsinh(x) = − arsinh(−x), however, most relevant for Eqn. (12) is its behaviour in an x-rangeas depicted here.v(u) = c 2 u 2 , which is a special case <strong>of</strong> (11) for a i = s = 0. In this case, the logarithm is avariance-stabilizing transformation, i. e. the log-transformed <strong>data</strong> have approximately constantvariance. For the more <strong>gene</strong>ral variance-to-mean dependence (11), such a transformation canalso be found, as will be explained below.Second, the ratio <strong>of</strong> intensities y k1 /y k2 is no longer the best estimator for the true fold changeµ k1 /µ k2 . This was addressed by Dror et al. [27], who estimated log(µ k1 /µ k2 ) by the posteriormean <strong>of</strong> a hierarchical model that consists <strong>of</strong> Eqn. (10) together with an empirical prior for thedistribution <strong>of</strong> µ ki . Their estimator coincides with the log-ratio if both y k1 and y k2 are large, andremains well-behaved for small or non-positive values <strong>of</strong> y k1 and y k2 .The appropriate variance stabilizing transformation was described by Huber et al. [24] and byRocke and Durbin [28]. It has the form( )ch i (y ki ) = arsinhs · yki − a i. (12)b iThe parameters a i and b i may be interpreted as array-specific calibration parameters, while thecoefficient <strong>of</strong> variation c and the background noise level s parametrize the overall error model.The graph <strong>of</strong> the arsinh function is depicted in Fig. 9. The following two relations hold betweenthe arsinh and the log function:arsinh(x) = log(x + √ x 2 + 1) (13)lim {arsinh(x) − log(2x)} = 0. (14)x→∞In the framework <strong>of</strong> Section 3.1, log-ratios, the differences between the logarithms <strong>of</strong> normalizedintensities, were the appropriate measure <strong>of</strong> differential transcription to be used in downstreamanalyses. In analogy, we define [24]∆h k;ij = h i (y ki ) − h j (y kj ). (15)17
For intensities that are much larger than the additive noise level, (15) becomes equivalent to thelog-ratio, as is seen from Eqn. (14). But, in contrast to the log-ratio, ∆h k;ij is well-defined andhas constant variance c 2 across the whole range <strong>of</strong> intensities. In fact, ∆h k;ij /c may be thought<strong>of</strong> as a “studentized log-ratio”.To estimate the model and transformation parameters, one could directly fit model (10) to the<strong>data</strong>, using the majority <strong>of</strong> <strong>gene</strong>s unchanged assumption µ ki = µ k for most <strong>gene</strong>s k. A computationallysimpler approach is to fit the modelh i (Y ki ) = ˜µ k + ˜ε ki , ˜ε ki ∼ N(0, c 2 ). (16)Up to first and second moments, models (10) and (16) are equivalent. Parameter estimates canbe obtained from a robust variant <strong>of</strong> the maximum likelihood estimator. A robust estimatorwith high breakdown point is needed not only because there may be technical outliers, but alsobecause the assumption µ ki = µ k does not hold for a minority <strong>of</strong> <strong>gene</strong>s that have biologicallydifferent transcription levels in different samples [24].The identification <strong>of</strong> differentially transcribed <strong>gene</strong>s through statistical tests on ∆h k values wasshown to have higher sensitivity and specificity than that through tests on log-ratios [24]. Thismay be explained by the fact that for non-differentially transcribed <strong>gene</strong>s the ∆h k values haveunimodal distributions with mean zero and variances independent <strong>of</strong> the <strong>gene</strong>s’ mean transcriptionlevels. Hence, within the limits <strong>of</strong> the error model, all available information with respect todifferential transcription <strong>of</strong> <strong>gene</strong> k is contained in the values <strong>of</strong> ∆h k;ij . On the other side, thedistributions <strong>of</strong> log-ratios may have, even for some <strong>of</strong> the non-differentially transcribed <strong>gene</strong>s,mean values different from zero due to sensitive dependence on calibration errors, they may havevariances that strongly depend on the mean transcription levels, and they involve missing values,if there are non-positive net probe intensities. These points are illustrated in Fig. 10.Probe set summaries. A <strong>gene</strong> transcript may be represented by multiple probes on an array.To obtain an overall measure <strong>of</strong> abundance per <strong>gene</strong>, a straightforward approach is to take theaverage <strong>of</strong> the corresponding calibrated and transformed probe intensities (12). If additionalinformation on the reliability <strong>of</strong> the probe measurements is available, a weighted average may beused. This has been investigated most extensively in the context <strong>of</strong> Affymetrix <strong>gene</strong>chip <strong>data</strong> [2].On these chips, each transcript is represented by 16 to 20 pairs <strong>of</strong> oligonucleotide probes referredto as probe sets. Each probe pair consists <strong>of</strong> an oligonucleotide <strong>of</strong> 25 bases that exactly matchesthe target sequence, and <strong>of</strong> one that has a mismatch in the middle. The mismatch probes arethought to provide estimates <strong>of</strong> unspecific contributions to the signal measured from the perfectmatch probes. A good overview, with many further references, was given by Irizarry et al. [15].4 Identification <strong>of</strong> differentially expressed <strong>gene</strong>sOne <strong>of</strong> the basic goals in the analysis <strong>of</strong> <strong>microarray</strong> <strong>gene</strong> <strong>expression</strong> <strong>data</strong> is the identification <strong>of</strong>differentially expressed <strong>gene</strong>s in the comparison <strong>of</strong> different types <strong>of</strong> cell or tissue samples. Inorder to control the biological and experimental variability <strong>of</strong> the measurements, statistical inferencehas to be based on an adequate number <strong>of</strong> replicate experiments. Here one may distinguish18
log R − log G−4 −2 0 2 45 10 15log R + log Gh(R) − h(G)−4 −2 0 2 45 10 15h(R) + h(G)Figure 10: Scatterplot <strong>of</strong> differential versus total intensities from a two-color-cDNA array, usingtwo different transformations: logarithmic, upper panel, and Eqn. (12), lower panel. The horizontallines correspond to the z-score ∆h/ĉ = 0, ±1, ±2, ±3. The z-score <strong>of</strong> a pair <strong>of</strong> red andgreen probe intensities is their difference divided by its expected standard deviation accordingto the variance-versus-mean function v(u). The z-score is a statistical measure for how stronglyan observed pair <strong>of</strong> intensities is indicative <strong>of</strong> true differential abundance. While the contours<strong>of</strong> the z-score are functions <strong>of</strong> both log-ratio and total intensity (upper panel), they are independent<strong>of</strong> total intensity in the coordinate system <strong>of</strong> the lower panel. Due to a local backgroundsubtraction, this <strong>data</strong> set contained small and negative net intensities. The top panel shows measurementswith R, G > 0 and log(RG) > 2.5. All <strong>data</strong> is shown in the lower panel, with thesubset <strong>of</strong> the upper panel to the right <strong>of</strong> the dashed line.19
etween cases in which one wishes to make statements on a particular cell population and casesin which one wants to make statements that hold in the presence <strong>of</strong> biological variability, such aswith biopsy studies <strong>of</strong> diseased tissues. In the first case, independent replications can be obtainedon the level <strong>of</strong> multiple mRNA isolations, in the second, they may be provided by samples fromdifferent patients.For the following, we assume that the <strong>data</strong> are given either as absolute intensities or as relativevalues with respect to a common reference sample, and have been calibrated (see Section 3).To identify differentially expressed <strong>gene</strong>s with respect to a certain biological question, a suitablestatistical test may be performed for each <strong>gene</strong> [29]. The choice <strong>of</strong> the test statistic depends onthe biological question and on the nature <strong>of</strong> the available experimental <strong>data</strong>. In the simplest case,one asks for <strong>gene</strong>s that show different transcript abundance between two conditions. In morecomplex situations, one may look for <strong>gene</strong>s whose abundance is associated with multiple factorlevels <strong>of</strong> one or more sample characteristics. Furthermore, one may consider continuous-valuedsample characteristics and test for <strong>gene</strong>s which show non-zero coefficients in a regression model,such as a linear model or a Cox proportional hazards model on patient survival <strong>data</strong>.Different statistical tests may make more or less strong assumptions on the distributions <strong>of</strong> replicatemeasurements. Important questions are whether the distributions are symmetric, how similaror dissimilar they are to normal distributions, what their behavior at the tails is like, and whetheror how their variance (or another appropriate measure <strong>of</strong> scale) varies between different <strong>gene</strong>s orbetween different conditions. Such differences in the variance may occur for several reasons: InSection 3, we have discussed the dependence <strong>of</strong> the variance on the mean, an example for whichis given in Eqn. (11). There may be other technological effects that can influence the variance <strong>of</strong>the measurement distributions in a <strong>gene</strong>- or condition-dependent manner, such as GC-content, orprobe length. Finally, there may be genuine biological differences, such as different tightness <strong>of</strong>the regulatory control for different <strong>gene</strong>s or for the same <strong>gene</strong> under different physiological ordisease conditions.Data transformations, such as the logarithmic transformation or a variance stabilizing transformationlike Eqn. (12) may be used to make the distributions more symmetric and possibly closeto normal, and to remove the systematic dependence <strong>of</strong> the variance on the mean (see Section 3).In the comparison <strong>of</strong> two conditions, one might use Student’s t–test or the Wilcoxon rank sumtest. Both tests assume that the distributions <strong>of</strong> the replicate measurements under the two conditionshave the same shape and test for differences in the location, with the t–test additionallyassuming normal distributions. To account for possibly unequal variances in the two groups,Welch’s version <strong>of</strong> the t–test may be preferred [30, 31]. In order to avoid distributional assumptions,Dudoit et al. proposed to estimate the null distribution <strong>of</strong> the t–statistic (or, equivalently,<strong>of</strong> the difference <strong>of</strong> means) for each <strong>gene</strong> using permutations <strong>of</strong> the sample labels. Comparativeanalyses <strong>of</strong> different univariate statistical tests in the analysis <strong>of</strong> <strong>gene</strong> <strong>expression</strong> <strong>data</strong> werepresented in [32, 23, 33], however without a conclusive result.In addition to standard aspects <strong>of</strong> hypothesis testing, two specific properties <strong>of</strong> <strong>microarray</strong> <strong>data</strong>have motivated the development <strong>of</strong> novel strategies:1. Variance estimation: in one extreme, one may estimate the variances <strong>of</strong> the distributions separatelyfor each <strong>gene</strong>, and possibly for each condition. This requires a large number <strong>of</strong> repetitions,which are not always available. In the other extreme, one may use a pooled estimate <strong>of</strong> the vari-20
ance over all conditions and <strong>gene</strong>s. After the application <strong>of</strong> a variance-stabilizing transformationsuch as Eqn. (12), the assumption <strong>of</strong> constant variance may result in tolerable bias and, due tothe large number <strong>of</strong> <strong>gene</strong>s represented on an array, in very low variance <strong>of</strong> the estimator. Thisis the case especially if few repetitions are available. In-between the two extremes, a number <strong>of</strong>methods have been proposed that pool the variance estimation over some <strong>gene</strong>s, but also retainsome <strong>gene</strong>-dependence.2. Multiple testing: Due to the large number <strong>of</strong> <strong>gene</strong>s on an array and thus the large number <strong>of</strong>tests performed, a considerable number <strong>of</strong> <strong>gene</strong>s may show differential signal intensities simplyby chance. Several concepts <strong>of</strong> assessing the statistical significance <strong>of</strong> test results obtained from<strong>microarray</strong> <strong>data</strong> have been developed.4.1 Regularized t-statisticsTo overcome the instability <strong>of</strong> the <strong>gene</strong>-specific variance estimate in the case <strong>of</strong> few replicateexperiments per condition, several authors have proposed methods where a value estimated froma larger set <strong>of</strong> <strong>gene</strong>s is used to augment the <strong>gene</strong>-specific standard deviation estimate, thus providinga regularized version <strong>of</strong> the t-statistic.Baldi and Long [34] suggested to replace the within-group empirical variance s 2 k <strong>of</strong> <strong>gene</strong> k in thetwo-sample t-statistic obtained from d observations by an <strong>expression</strong> <strong>of</strong> the form˜σ k 2 = ν 0σ0 2 + (d − 1)s 2 k.ν 0 + d − 2This variance estimate results as the posterior mean from a Bayesian hierarchical model for themeasurements <strong>of</strong> each <strong>gene</strong> under an experimental condition. The measured values are assumedto be normally distributed, and ν 0 and σ 0 are hyperparameters <strong>of</strong> the prior for the parameters <strong>of</strong>the normal distribution. For practical purposes, the authors recommended to choose σ 0 as theempirical standard deviation obtained from averaging over all <strong>gene</strong>s within a certain intensityrange. If a variance stabilizing transformation has been applied to the <strong>data</strong>, σ 0 may be obtainedfrom the pooled variance over all <strong>gene</strong>s on the array. The value ν 0 is chosen as an integerdetermining the weight <strong>of</strong> σ 0 compared to the <strong>gene</strong>-specific standard deviation. Thus the largenumber <strong>of</strong> <strong>gene</strong>s interrogated is exploited to obtain potentially biased, but more stable varianceestimates for each single <strong>gene</strong>. The resulting regularized t-statistic, used with a t-distributionwith ν 0 +d−2 degrees <strong>of</strong> freedom as null distribution, is shown to perform better than the standardt-test on real and simulated <strong>data</strong> when there are less than about 5 replications per condition. Asimilar approach was pursued by Lönnstedt and Speed [35]. Tusher et al. [36, 37] also proposedto use a regularized version <strong>of</strong> the t-statistic, where the empirical standard deviation s k <strong>of</strong> <strong>gene</strong>k is replaced by ˜σ k = s k + s 0 , with s 0 determined from the <strong>data</strong> in a heuristic fashion.4.2 Multiple testingAssume that for each <strong>gene</strong> a statistical test for differential <strong>expression</strong> has been conducted. If onefixes a <strong>gene</strong>-wise significance level <strong>of</strong> e.g. α = 0.05, on average one in every 20 <strong>gene</strong>s that are21
actually not differentially expressed will show a p-value below α just by chance. Due to the largenumber <strong>of</strong> <strong>gene</strong>s represented on a <strong>microarray</strong>, this may lead to a large number <strong>of</strong> false positivecalls. For this reason, Dudoit et al. [10] suggested to choose a procedure that controls the family–wise error rate (FWER). The FWER is defined as the probability that the selected set <strong>of</strong> <strong>gene</strong>scontains at least one false positive. A multiple testing procedure is said to provide strong control<strong>of</strong> the FWER if it controls the FWER for any combination <strong>of</strong> true and false null hypotheses. Ifp-values for the test statistics T 1 , . . . , T n <strong>of</strong> n <strong>gene</strong>s are available, a simple adjustment that givesstrong control <strong>of</strong> the FWER is the Bonferroni correction, which amounts to multiplying theunadjusted p-values by n. Dudoit et al. [10] described the use <strong>of</strong> a step-wise p-value adjustmentthat is due to Westfall and Young [38]. This procedure is less conservative than the Bonferronicorrection, and in contrast to the latter, it takes possible dependences between the test statisticsinto account. The adjusted p-values are estimated by a permutation algorithm.For many applications however, control <strong>of</strong> the FWER is too conservative, with the danger <strong>of</strong>many interesting <strong>gene</strong>s being missed. As <strong>microarray</strong>s are <strong>of</strong>ten used to screen for candidate<strong>gene</strong>s that may then be validated through further experiments, the researcher may be willing toaccept a certain fraction <strong>of</strong> false positives. This demand is addressed by the concept <strong>of</strong> the FalseDiscovery Rate (FDR, [39]). For a family <strong>of</strong> hypothesis tests, let R denote the number <strong>of</strong> rejectednull hypotheses, and V the number <strong>of</strong> falsely rejected null hypotheses. The FDR is defined asF DR = E[ V R ∣ R > 0] · Pr(R > 0).Benjamini and Hochberg described a procedure to control the FDR under the assumption that thetest statistics arising from the true null hypotheses are independent. More precisely, given the set<strong>of</strong> p-values from all individual hypothesis tests and a desired upper bound q for the FDR, theygive a bound p ∗ such that rejecting all null hypotheses with p-value smaller than p ∗ guaranteesan FDR <strong>of</strong> at most q for any possible combination <strong>of</strong> true and false null hypotheses.Another approach based on the FDR was presented by Storey and Tibshirani [40], see also [36].For a given rejection region <strong>of</strong> the statistical tests, the authors estimated the FDR and the positiveFalse Discovery Rate (pFDR), which is defined as 3pF DR = E[ V R ∣ R > 0].Rather than computing a rejection region that guarantees an upper bound for the FDR, Storeyand Tibshirani assumed that a rejection region was fixed and estimated the FDR on the basis <strong>of</strong>the distribution <strong>of</strong> the test statistics. The estimation procedure has been designed for any kind<strong>of</strong> dependence between the test statistics and does not require p-values for the single hypothesistests. The algorithm <strong>of</strong> Storey and Tibshirani works as follows. They assumed that all nullhypotheses were identical and that the same rejection region Γ was used for all test statisticsT 1 , . . . , T n , leading to a number R(Γ) <strong>of</strong> rejections. Furthermore, they assumed that the joint3 In contrast to the method <strong>of</strong> Benjamini and Hochberg, where arbitrary, but fixed combinations <strong>of</strong> true and falsenull hypotheses are allowed, here the null hypotheses are considered as i.i.d. Bernoulli random variables that aretrue with probability π 0 .22
0 40 800 10 20 30 40 50 60R 0 (Γ)Figure 11: Estimation <strong>of</strong> the false discovery rate: Using 24 arrays with 32,000 cDNA probeseach, 12 pairs <strong>of</strong> matched breast cancer tissues dissected before and after neoadjuvant chemotherapywere compared. Differentially transcribed <strong>gene</strong>s were selected according to the absolutevalue <strong>of</strong> the one-sample t-statistic. The rejection region Γ was fixed such that 50 <strong>gene</strong>s wereselected (solid line). The histogram shows the distribution <strong>of</strong> R 0 (Γ), estimated from all 924balanced sign flips. The dashed and dotted lines show median and mean, respectively. Themean may be used as an estimate for E[R 0 (Γ)] in Eqns. (17) and (18). Note the skewness <strong>of</strong> thedistribution <strong>of</strong> R 0 (Γ).23
null distribution <strong>of</strong> the test statistics could be simulated by permutations <strong>of</strong> the sample labels.From this, the authors obtained estimates for the expected number <strong>of</strong> rejections given that allnull hypotheses are true,Ê[R 0 (Γ)],as well as for the probability <strong>of</strong> at least one rejection,The pFDR is then estimated byand similarly for the FDR:̂pFDR(Γ) =̂Pr[R 0 (Γ) > 0].ˆπ 0 · Ê[R 0 (Γ)]̂Pr[R 0 (Γ) > 0] · max(R(Γ), 1)) , (17)̂FDR(Γ) = ˆπ 0 · Ê[R 0 (Γ)]max(R(Γ), 1) . (18)The expected proportion ˆπ 0 <strong>of</strong> true null hypotheses is estimated as follows. Let Γ ′ be a rejectionregion whose complement is likely to be achieved mostly for true null hypotheses. The estimatefor π 0 is obtained asˆπ 0 = n − R(Γ′ )Ê[n − R 0 (Γ ′ )] .In order to determine how many falsely significant <strong>gene</strong>s may appear with a certain probability,or how likely it is that all <strong>gene</strong>s with test statistics in the rejection region are false positives, it isinteresting to estimate not only the pFDR, but also quantiles <strong>of</strong> the distribution <strong>of</strong> V/R. This isillustrated in Fig. 11.Under certain conditions on the dependence structure between the test statistics, it was shownin [40] that for all π 0 , the estimates are greater or equal than the true values <strong>of</strong> the FDR andpFDR in expectation. In [41] (see also [42]), it is shown that in the case <strong>of</strong> independent teststatistics (and asymptotically also for some forms <strong>of</strong> dependence) the pFDR can be interpretedin a Bayesian framework as the posterior probability that a <strong>gene</strong> is not differentially expressed,given its test statistic lies in the rejection region:pFDR(Γ) = Pr(H = 0|T ∈ Γ).A special property <strong>of</strong> the approach <strong>of</strong> Storey and Tibshirani and Tusher et al. is how it makes use<strong>of</strong> the assumption that the null distributions <strong>of</strong> the test statistics are identical for all <strong>gene</strong>s: Thefact that the estimation procedure is based on the test statistics <strong>of</strong> all <strong>gene</strong>s under permutation <strong>of</strong>the sample labels gives accurate estimates already for relatively few replicate experiments, whileat the same time it preserves the dependence structure between <strong>gene</strong>s. On the other hand, thistype <strong>of</strong> procedure is not able to take possibly unequal variances in the two classes into account.24
5 Pattern discoveryUnsupervised as well as supervised learning methods play a central role in the analysis <strong>of</strong> <strong>microarray</strong><strong>gene</strong> <strong>expression</strong> <strong>data</strong>. Supervised methods aim at inferring information from the <strong>data</strong>with respect to a pre-defined response variable. For instance, in the context <strong>of</strong> tumor diagnosticsone tries to classify mRNA samples obtained from tumor cells with respect to giventumor types. The application <strong>of</strong> classification methods to <strong>microarray</strong> <strong>data</strong> was discussed e. g. in[43, 44, 45, 46]. In the following, we focus on unsupervised methods, which aim at detectingstructures in the <strong>data</strong> without making use <strong>of</strong> <strong>gene</strong> or sample annotations. A primary purpose <strong>of</strong>such methods is to provide a visualization <strong>of</strong> the <strong>data</strong> in which conspicuous structures can easilybe recognized. These may be relations among <strong>gene</strong>s, among samples, or between <strong>gene</strong>s andsamples. The perception <strong>of</strong> such structures can lead the researcher to develop new hypotheses:e.g. the result <strong>of</strong> a clustering <strong>of</strong> <strong>gene</strong>s may indicate the putative involvement <strong>of</strong> uncharacterized<strong>gene</strong>s in a biological process <strong>of</strong> interest, whereas a separation <strong>of</strong> the <strong>expression</strong> pr<strong>of</strong>iles <strong>of</strong> a set<strong>of</strong> patient tissue samples into clusters may point to a possible refinement <strong>of</strong> disease taxonomy.On the other hand, unsupervised methods are <strong>of</strong>ten used to confirm known differences between<strong>gene</strong>s or samples on the level <strong>of</strong> <strong>gene</strong> <strong>expression</strong>: If a clustering algorithm groups samples frome.g. two different tumor types into distinct clusters without using prior knowledge, this providesevidence that the tumor types do indeed show clearly detectable differences in their global <strong>gene</strong><strong>expression</strong> pr<strong>of</strong>iles.For all <strong>of</strong> the following methods, we assume that we have a <strong>gene</strong> <strong>expression</strong> <strong>data</strong> matrix <strong>of</strong>suitably calibrated and transformed <strong>expression</strong> levels with, say, the rows corresponding to <strong>gene</strong>sand the columns corresponding to cell or tissue samples.5.1 Projection methodsAn important class <strong>of</strong> unsupervised methods works through dimension reduction. The row orcolumn vectors <strong>of</strong> a <strong>gene</strong> <strong>expression</strong> <strong>data</strong> matrix are projected onto a low-dimensional spacesuch that some measure <strong>of</strong> similarity between the vectors is optimally preserved. The projected<strong>data</strong> may be visualised through one or more scatterplots, in the hope that these convey importantinformation contained in the <strong>data</strong>.In principal component analysis, mutually orthogonal linear combinations <strong>of</strong> the row or columnvectors (the principal components) are computed, such that the ith principal componenthas maximal variance among all vectors orthogonal to the first i − 1 principal components. Inapplications, one may hope that the first few principal components carry most <strong>of</strong> the informationcontained in the <strong>data</strong>, which can then be displayed in scatterplots. Alter et al. [47] demonstratedthe use <strong>of</strong> principal component analysis for a <strong>gene</strong> <strong>expression</strong> study <strong>of</strong> the cell cycle in yeast. Thefirst principal component was found to reflect experimental artifacts and was consequently filteredout. After that, the authors found that the first two principal components (“eigen<strong>gene</strong>s”) arewell described by a sine and cosine function <strong>of</strong> time, respectively. The interpretation is that these“eigen<strong>gene</strong>s” reflect oscillating <strong>gene</strong> <strong>expression</strong> patterns, while the corresponding “eigenarrays”define a two–dimensional coordinate system for the cell cycle phases.25
Figure 12: Correspondence analysis applied to an experiment that searched for <strong>gene</strong>s expressedas a consequence <strong>of</strong> induction <strong>of</strong> the yeast cell cycle <strong>gene</strong> CDC14 [48]. A yeast trans<strong>gene</strong> wasconstructed with the CDC14 <strong>gene</strong> under a galactose dependent promotor that allows induction <strong>of</strong>the CDC14 <strong>gene</strong> through the addition <strong>of</strong> galactose. As a consequence, one observes upregulation<strong>of</strong> <strong>gene</strong>s both due to CDC14 induction and due to the natural reaction to galactose. Four conditionswere studied: wildtype yeast with and without galactose, and the yeast trans<strong>gene</strong> with andwithout galactose. For each condition several replicates were made. The correspondence analysisbiplot shows an embedding <strong>of</strong> rows and columns <strong>of</strong> the entire <strong>data</strong> matrix with <strong>gene</strong>s depictedas black dots and hybridizations depicted as small squares. Replicates for each condition clustertogether, and each <strong>of</strong> the 4 clusters defines a direction in which the <strong>gene</strong>s that are typical forthe condition can be found. The bisection between the two galactose conditions points to twoGAL <strong>gene</strong>s, known to be involved in the galactose pathway. Genes in the trans<strong>gene</strong>+galactosecondition that are turned on in response to the addition <strong>of</strong> galactose are attracted also by the wildtype+galactosecondition. Thus, the lower left direction highlights <strong>gene</strong>s that are exclusively dueto the CDC14 induction. Genes are encircled which show up in a related experiment [49], too,where they are also seen to be linked to CDC14.26
In correspondence analysis, the rows and the columns <strong>of</strong> a non-negative <strong>data</strong> matrix are simultaneouslyprojected onto a low-dimensional space [50]. The method decomposes the deviationsfrom homo<strong>gene</strong>ity between rows and columns, as we will explain now. For the <strong>data</strong> matrix Y ,let y k+ and y +i be the sum <strong>of</strong> the kth row and the ith column, respectively, y ++ the grand total,and r k = y k+ /y ++ and c i = y +i /y ++ the mass <strong>of</strong> the kth row and the ith column. The matrix Swith elementss ki = (y ki /y ++ − r k c i )/ √ r k c iis submitted to singular value decomposition, S = UΛV T . Note that the sum <strong>of</strong> the squaredelements <strong>of</strong> S is just the χ 2 –statistic <strong>of</strong> Y . Suitably normalized columns <strong>of</strong> U and V providethe principal coordinates for the rows and the columns <strong>of</strong> Y , respectively:f kj = λ j u kj / √ r k , g ij = λ j v ij / √ c i .Usually, only the first two or three principal coordinates are used for a simultaneous display <strong>of</strong>the rows and columns <strong>of</strong> the <strong>data</strong> matrix. The corresponding entries <strong>of</strong> Λ reflect which proportion<strong>of</strong> the χ 2 -statistic <strong>of</strong> Y is represented in the low-dimensional projection. The distancesbetween rows and between columns approximate their χ 2 -distances, and moreover, the associationbetween rows and columns is reflected in a biplot: A row and a column that are positively(negatively) associated will approximately lie on the same (opposite) half-ray through the origin,with the distance from the origin reflecting the strength <strong>of</strong> the association. An example is shownin Fig. 12.5.2 Cluster algorithmsCluster algorithms <strong>gene</strong>rally aim at grouping objects according to some notion <strong>of</strong> similarity. Anoverview <strong>of</strong> questions and methods in cluster analysis is given in [51]. For <strong>microarray</strong> <strong>data</strong>,clustering may be applied to the <strong>gene</strong>s whose <strong>expression</strong> levels are measured, with the expectationthat functionally related or co–regulated <strong>gene</strong>s will show similar <strong>expression</strong> patterns. On theother hand, one may use clustering to analyse the <strong>expression</strong> pr<strong>of</strong>iles <strong>of</strong> a set <strong>of</strong> cell or tissue sampleswith the hope that samples with similar biological characteristics will be grouped together.Cluster algorithms are explicitly or implicitly based on a quantitative measure <strong>of</strong> dissimilaritybetween the objects <strong>of</strong> interest. In the case <strong>of</strong> row and column vectors <strong>of</strong> a <strong>gene</strong> <strong>expression</strong> <strong>data</strong>matrix, typical examples are the Euclidean distance or 1 minus the correlation coefficient. Forthe clustering <strong>of</strong> <strong>gene</strong>s based on their <strong>expression</strong> patterns, the latter is <strong>of</strong>ten used because it isinvariant under affine–linear transformations <strong>of</strong> the input vectors and focuses on the pattern <strong>of</strong>relative changes.In hierarchical clustering algorithms, a tree structure (dendrogram) is computed that contains theobjects as leaves. Agglomerative methods build the tree starting with the leaves ([52]), whereasin divisive methods ([53]), the set <strong>of</strong> objects is iteratively partitioned into subsets. To obtaina partition <strong>of</strong> the set <strong>of</strong> objects into clusters, the resulting dendrogram may be cut at a certainheight. In the analysis <strong>of</strong> <strong>microarray</strong> <strong>data</strong> however, hierarchical clustering is <strong>of</strong>ten simply usedto obtain a linear ordering <strong>of</strong> both the rows and the columns <strong>of</strong> a <strong>gene</strong> <strong>expression</strong> <strong>data</strong> matrixsuch that similar rows or columns are located close to each other. The reordered <strong>data</strong> matrix is27
then displayed using a color map, which may be a powerful visualization tool. However, manyimplementations <strong>of</strong> hierarchical clustering do not try to find an optimal linear order <strong>of</strong> the nleaves <strong>of</strong> the obtained dendrogram out <strong>of</strong> the 2 n−1 possible orders that are compatible with thetree structure. Bar–Joseph et al. [54] described an efficient algorithm to compute an optimallinear order <strong>of</strong> the set <strong>of</strong> leaves <strong>of</strong> a cluster tree compatible with the tree structure in the sensethat the sum <strong>of</strong> distances <strong>of</strong> pairs <strong>of</strong> neighbour leaves is minimized.Non–hierarchical clustering algorithms directly yield a partition <strong>of</strong> the set <strong>of</strong> objects into clusters,the number <strong>of</strong> which has to be fixed in advance in most methods. Examples are k–meansclustering, partitioning around medoids [55] and self-organizing maps [56]. A graph–theoreticalclustering method that was developed especially for <strong>gene</strong> <strong>expression</strong> <strong>data</strong> is described in [57].An important, but difficult question in cluster analysis is that <strong>of</strong> the validity <strong>of</strong> the results. Clusteranalysis assumes that the <strong>data</strong> are organized in distinguishable clusters. However, a cluster algorithmwill usually also produce a set <strong>of</strong> clusters if this assumption is not fulfilled. Furthermore,the results may be affected by random fluctuations <strong>of</strong> the <strong>data</strong>. Thus, it is <strong>of</strong> interest to estimatethe number <strong>of</strong> clusters present in a <strong>data</strong> set (if any), as well as to assess the variability <strong>of</strong> variousfeatures <strong>of</strong> the result.Dudoit and Fridlyand [55] proposed an approach for estimating the number <strong>of</strong> clusters in a <strong>data</strong>set. In the first step, they applied a clustering algorithm to a subset <strong>of</strong> all observations. Then theyanalysed how much an assignment <strong>of</strong> the remaining observations to the clusters by a class predictionmethod coincided with the partition obtained from clustering these observations. Throughcomparing the resulting measure <strong>of</strong> predictability to that obtained under a null model withoutcluster structure, they arrived at a quality index that can be computed for different numbers <strong>of</strong>clusters. If none <strong>of</strong> the predictability values is significant, there is no evidence for clusters inthe <strong>data</strong>, whereas otherwise the number <strong>of</strong> clusters yielding the highest quality index is chosen.The performance <strong>of</strong> this approach was demonstrated using simulated <strong>data</strong> and real <strong>gene</strong> <strong>expression</strong><strong>data</strong>, where clustering is applied to the samples. However, one might imagine that real <strong>data</strong>sometimes lie in–between the extreme cases <strong>of</strong> a common distribution for all objects on one sideand distinct clusters on the other side. Furthermore, if the objects are organized in hierarchicallynested clusters, such that there are partitions at different levels <strong>of</strong> granularity, the question <strong>of</strong> howmany clusters are present is not meaningful without further specifications.Kerr and Churchill [58] used the bootstrap in order to assess the reliability <strong>of</strong> the results <strong>of</strong> acluster analysis. Resampling was performed on the residuals <strong>of</strong> an analysis <strong>of</strong> variance model,yielding stability values for the assignment <strong>of</strong> <strong>gene</strong>s to pre-specified clusters. In a more <strong>gene</strong>ralcontext, Pollard and van der Laan [59] analysed the performance <strong>of</strong> the bootstrap in assessingthe variability <strong>of</strong> the results <strong>of</strong> a wide class <strong>of</strong> clustering methods. Assuming that the <strong>expression</strong>pr<strong>of</strong>iles <strong>of</strong> the biological samples are <strong>gene</strong>rated from a mixture <strong>of</strong> n-variate probabilitydistributions, where n denotes the number <strong>of</strong> <strong>gene</strong>s, they gave a <strong>gene</strong>ral definition <strong>of</strong> clusteringmethods (for clustering <strong>gene</strong>s or samples, or the simultaneous clustering <strong>of</strong> <strong>gene</strong>s and samples)as algorithms to estimate certain parameters <strong>of</strong> the <strong>data</strong>-<strong>gene</strong>rating distribution. Although an underlyingprobabilistic model is assumed, the cluster algorithms under consideration do not haveto be model-based. This framework allows to apply concepts <strong>of</strong> statistical inference to clusteringalgorithms. In a simulation study, they analysed both the non-parametric (resampling <strong>of</strong> sample<strong>expression</strong> pr<strong>of</strong>iles) and the parametric bootstrap (based on normal distributions). The results28
indicated that both bootstrapping methods are able to assess the variability <strong>of</strong> various quantitiesdescribing the output <strong>of</strong> a clustering algorithm. In addition, the authors proposed to test the statisticalsignificance <strong>of</strong> a clustering <strong>of</strong> samples via the comparison with <strong>data</strong> <strong>gene</strong>rated from anappropriate null model. A similar approach for the evaluation <strong>of</strong> temporal <strong>gene</strong> <strong>expression</strong> patternswas presented in [60]. Assuming the <strong>expression</strong> pattern <strong>of</strong> each <strong>gene</strong> to be <strong>gene</strong>rated fromone <strong>of</strong> several multivariate normal distributions, the authors analysed the error rate <strong>of</strong> variousclustering algorithms in determining the correct cluster membership <strong>of</strong> <strong>gene</strong>s.Probabilistic clustering methods assume that each observation belongs to a cluster k with probabilityπ k , and the observations within each cluster k are <strong>gene</strong>rated according to a probabilitydistribution L k . After the number <strong>of</strong> clusters and the family <strong>of</strong> admissible probability distributionshave been specified, the model parameters and the most likely cluster assignment <strong>of</strong> eachobservation can be estimated by maximum likelihood. This is usually done via the Expectation–Maximization algorithm [61], starting with some initial clustering. In such a probabilistic framework,it is possible to assess the adequacy <strong>of</strong> different models — concerning the number <strong>of</strong>clusters, as well as the allowed parameter space for the component distributions — through theBayesian Information Criterion [62]. The application <strong>of</strong> model–based clustering to <strong>microarray</strong><strong>data</strong> is described in [63, 64, 65]. Concerning the clustering <strong>of</strong> <strong>gene</strong>s, the application <strong>of</strong> normalmixture models, possibly with constraints on the covariance matrices in order to reduce thenumber <strong>of</strong> free parameters, is more or less straightforward. On the other hand, the application <strong>of</strong>model–based methods to the clustering <strong>of</strong> samples poses problems, because in typical <strong>microarray</strong><strong>data</strong> sets, the number <strong>of</strong> <strong>gene</strong>s, and thus the number <strong>of</strong> parameters to be estimated, exceeds byfar the number <strong>of</strong> samples. Ghosh and Chinnaiyan suggested to cluster the samples via a model–based approach using the first few components obtained from a principal component analysis.McLachlan et al. proposed to cluster the samples into a mixture <strong>of</strong> factor analysis models.5.3 Local pattern discovery methodsOne limitation <strong>of</strong> clustering methods as described in Section 5.2 lies in the fact that they are basedon a global measure <strong>of</strong> similarity between the rows or the columns <strong>of</strong> the <strong>data</strong> matrix. However,there may be biologically relevant situations where tissue samples share similar <strong>expression</strong> levels<strong>of</strong> one particular set <strong>of</strong> <strong>gene</strong>s, e. g. those belonging to a molecular pathway that is active in thisgroup, whereas they differ with respect to the <strong>expression</strong> <strong>of</strong> other <strong>gene</strong>s. Also the similarity <strong>of</strong> the<strong>expression</strong> levels <strong>of</strong> a group <strong>of</strong> <strong>gene</strong>s may be present only under certain biological conditions. Wegive a brief overview on methods that were developed with the aim <strong>of</strong> detecting such structuresin an unsupervised fashion.Getz et al. [66] described an algorithm where hierarchical clustering is alternately applied tothe rows and columns <strong>of</strong> submatrices <strong>of</strong> the <strong>data</strong> matrix, the rows and columns <strong>of</strong> which wereobtained as stable clusters in previous iterations.A number <strong>of</strong> authors have suggested methods to identify interesting submatrices <strong>of</strong> a <strong>gene</strong> <strong>expression</strong><strong>data</strong> matrix [67, 68, 69, 70]. The underlying idea is that a set <strong>of</strong> <strong>gene</strong>s, perhaps belongingto a common molecular pathway, are co–regulated only under certain experimental conditions.This notion is quantified in terms <strong>of</strong> a score function on submatrices <strong>of</strong> a <strong>gene</strong> <strong>expression</strong> matrix.As the number <strong>of</strong> submatrices is exponential in the number <strong>of</strong> <strong>gene</strong>s and the number <strong>of</strong>29
samples, efficient heuristics are applied in order to find high–scoring submatrices. The identifiedsubmatrices can be evaluated in terms <strong>of</strong> their statistical significance.For the identification <strong>of</strong> conspicuous class distinctions among a set <strong>of</strong> tissue samples based on<strong>microarray</strong> <strong>data</strong>, special approaches have been proposed [71, 72]. They are based on a scorefunction that quantifies the strength <strong>of</strong> differential <strong>gene</strong> <strong>expression</strong> for any possible bipartition <strong>of</strong>the set <strong>of</strong> samples. An optimization algorithm is used in order to find high-scoring bipartitions.As the scoring is not based on global properties <strong>of</strong> the <strong>gene</strong> <strong>expression</strong> pr<strong>of</strong>iles, but rather on thepresence <strong>of</strong> subsets <strong>of</strong> <strong>gene</strong>s that are differentially expressed, several independent bipartitionscan be obtained, each being based on a specific subset <strong>of</strong> differentially expressed <strong>gene</strong>s. In [72],it was shown that this approach is able to detect biologically meaningful class distinctions thatare not identified with cluster algorithms based on a global dissimilarity measure.6 ConclusionWe have described different aspects <strong>of</strong> <strong>microarray</strong> <strong>gene</strong> <strong>expression</strong> <strong>data</strong> analysis, from the qualitycontrol <strong>of</strong> the raw probe intensity <strong>data</strong>, via calibration, error modeling, and the identification<strong>of</strong> differentially transcribed <strong>gene</strong>s to explorative methods such as clustering or pattern discovery.Yet, statistical analysis is only one part <strong>of</strong> a <strong>microarray</strong> experiment. Frequently, <strong>data</strong> analysis isexpected to correct for technological problems or shortcomings in the design <strong>of</strong> an experiment.Awareness has grown, though, in recent years and interaction between experimentalists and <strong>data</strong>analysts is improving and, very importantly, starting already early in the planning <strong>of</strong> an experiment.This raises the hope that statistical analysis will in the future be ever less diverted bytrouble shooting, and can increase its focus on <strong>gene</strong>rating and validating biological hypothesesfrom the <strong>data</strong>.Unlike with, e.g., sequence <strong>data</strong>, it is still extremely difficult to relate different experiments toeach other and to quantitatively compare their results. Much stricter standardization <strong>of</strong> the measurementprocess, which will have to include significant improvements <strong>of</strong> present technologiesor development <strong>of</strong> new ones, will be necessary to obtain measurements that would be comparableacross laboratories. As a result, currently each experiment has to be large enough to beanalyzable by itself because it is still not feasible to view one’s own experiment as an incrementaladdition to an existing knowledge base on <strong>gene</strong> <strong>expression</strong>. While this is both a technicalproblem and a <strong>data</strong> integration problem, suggestions regarding the <strong>data</strong> standardization aspectare given in [73].Microarray based experiments are frequently seen as the stronghold <strong>of</strong> hypothesis-free genomeresearch. While debatable in itself, this assertion simply shifts the responsibility to the computationalscientist analyzing the <strong>data</strong>. In the absence <strong>of</strong> a clear hypothesis much <strong>of</strong> the analysiswill be <strong>of</strong> an exploratory nature. Once this leads to a hypothesis further independent verificationis needed. This embeds <strong>microarray</strong> experiments and statistical analysis into a feedback cycleproducing new experiments.30
AcknowledgmentsWe thank Holger Sültmann, Anke Schroth, Jörg Schneider from the Department <strong>of</strong> MolecularGenome <strong>Analysis</strong> at the DKFZ Heidelberg for sharing the experimental <strong>data</strong> and for continuingstimulating collaboration, and Annemarie Poustka for providing support. We are grateful toGünther Sawitzki, Dirk Buschmann, and Andreas Buneß for highly fruitful discussions. KurtFellenberg kindly provided Fig. 12.31
References[1] G.G. Lennon and H. Lehrach. Hybridization analyses <strong>of</strong> arrayed cDNA libraries. Trends inGenetics, 10:314–317, 1991.[2] R.J. Lipshutz, S.P. Fodor, T.R. Gingeras, and D.J. Lockhart. High density synthetic oligonucleotidearrays. Nature Genetics, 21 (Suppl 1):20–24, 1999.[3] David J. Duggan, Michael Bittner, Yidong Chen, Paul Meltzer, and Jeffrey M. Trent. Expressionpr<strong>of</strong>iling using cDNA <strong>microarray</strong>s. Nature Genetics, 21 (Suppl 1):10–14, 1999.[4] M. Kathleen Kerr and Gary A. Churchill. Statistical design and the analysis <strong>of</strong> <strong>gene</strong> <strong>expression</strong><strong>microarray</strong> <strong>data</strong>. Genet. Res., 77:123–128, 2001.[5] G.A. Churchill. Fundamentals <strong>of</strong> experimental design for cDNA <strong>microarray</strong>s. Nature Genetics,32 Suppl. 2:490–495, 2002.[6] Yee Hwa Yang and Terence P. Speed. Design issues for cDNA <strong>microarray</strong> experiments.Nat. Rev. Gen., 3:579–588, 2002.[7] The chipping forecast. Special supplement to Nature Genetics, volume 21, 1999.[8] Yee Hwa Yang, M. J. Buckley, Sandrine Dudoit, and Terence P. Speed. Comparison <strong>of</strong>methods for image analysis on cDNA <strong>microarray</strong> <strong>data</strong>. Journal <strong>of</strong> Computational andGraphical Statistics, 11:108–136, 2002.[9] Johannes Schuchhardt, Dieter Beule, Arif Malik, Eryc Wolski, Holger Eickh<strong>of</strong>f, HansLehrach, and Hanspeter Herzel. Normalization strategies for cDNA <strong>microarray</strong>s. NucleicAcids Research, 28:e47, 2000.[10] Sandrine Dudoit, Yee Hwa Yang, Terence P. Speed, and Matthew J. Callow. Statisticalmethods for identifying differentially expressed <strong>gene</strong>s in replicated cDNA <strong>microarray</strong> experiments.Statistica Sinica, 12:111–139, 2002.[11] W.S. Cleveland, E. Grosse, and W.M. Shyu. Statistical Models in S, chapter Chapter 8:Local regression models. Wadsworth & Brooks, Cole, 1992.[12] Huibin Yue, P. Scott Eastman, Bruce B. Wang, James Minor, Michael H. Doctolero,Rachel L. Nuttall, Robert Stack, John W. Becker, Julie R. Montgomery, Marina Vainer,and Rick Johnston. An evaluation <strong>of</strong> the performance <strong>of</strong> cDNA <strong>microarray</strong>s for detectingchanges in global mRNA <strong>expression</strong>. Nucleic Acids Research, 29(8):e41, 1–9, 2001.[13] T. Ideker, V. Thorsson, A.F. Siegel, and L.E. Hood. Testing for differentially-expressed<strong>gene</strong>s by maximum-likelihood analysis <strong>of</strong> <strong>microarray</strong> <strong>data</strong>. Journal <strong>of</strong> Computational Biology,7:805–818, 2000.32
[14] Latha Ramdas, Kevin R. Coombes, Keith Baggerly, Lynne Abruzzo, W. Edward Highsmith,Tammy Krogmann, Stanley R. Hamilton, and Wei Zhang. Sources <strong>of</strong> nonlinearity in cDNA<strong>microarray</strong> <strong>expression</strong> measurements. Genome Biology, 2:research0047.1–0047.7, 2001.[15] Rafael A. Irizarry, Bridget Hobbs, Francois Collin, Yasmin D. Beazer-Barclay, Kristen J.Antonellis, Uwe Scherf, and Terence P. Speed. Exploration, normalization, and summaries<strong>of</strong> high density oligonucleotide array probe level <strong>data</strong>. Biostatistics, 2003. Accepted forpublication. http://biosun01.biostat.jhsph.edu/∼ririzarr/papers/index.html.[16] Yidong Chen, Edward R. Dougherty, and Michael L. Bittner. Ratio-based decisions and thequantitave analysis <strong>of</strong> cDNA <strong>microarray</strong> images. Journal <strong>of</strong> Biomedical Optics, 2:364–374,1997.[17] M. Kathleen Kerr, Mitchell Martin, and Gary A. Churchill. <strong>Analysis</strong> <strong>of</strong> variance for <strong>gene</strong><strong>expression</strong> <strong>microarray</strong> <strong>data</strong>. Journal <strong>of</strong> Computational Biology, 7:819–837, 2000.[18] Tim Beißbarth, Kurt Fellenberg, Benedikt Brors, Rose Arribas-Prat, Judith Maria Boer,Nicole C. Hauser, Marcel Scheideler, Jörg D. Hoheisel, Günther Schütz, AnnemariePoustka, and Martin Vingron. Processing and quality control <strong>of</strong> DNA array hybridization<strong>data</strong>. Bioinformatics, 16:1014–1022, 2000.[19] M.A. Newton, C.M. Kendziorski, C.S. Richmond, F.R. Blattner, and K.W. Tsui. On differentialvariability <strong>of</strong> <strong>expression</strong> ratios: improving statistical inference about <strong>gene</strong> <strong>expression</strong>changes from <strong>microarray</strong> <strong>data</strong>. Journal <strong>of</strong> Computational Biology, 8(1):37–52, 2001.[20] Thomas B. Kepler, Lynn Crosby, and Kevin T. Morgan. Normalization and analysis<strong>of</strong> DNA <strong>microarray</strong> <strong>data</strong> by self-consistency and local regression. Genome Biology,3(7):research0037.1–0037.12, 2002.[21] Joachim Theilhaber, Steven Bushnell, Amanda Jackson, and Rainer Fuchs. Bayesian estimation<strong>of</strong> fold-changes in the analysis <strong>of</strong> <strong>gene</strong> <strong>expression</strong>: The PFOLD algorithm. Journal<strong>of</strong> Computational Biology, 8:585–614, 2001.[22] Keith A. Baggerly, Kevin R. Coombes, Kenneth R. Hess, David N. Stivers, Lynne V.Abruzzo, and Wei Zhang. Identifying differentially expressed <strong>gene</strong>s in cDNA <strong>microarray</strong>experiments. Journal <strong>of</strong> Computational Biology, 8:639–659, 2001.[23] Jeffrey G. Thomas, James M.Olson, Stephen J. Tapscott, and Lue Ping Zhao. An efficientand robust statistical modeling approach to discover differentially expressed <strong>gene</strong>s usinggenomic <strong>expression</strong> pr<strong>of</strong>iles. Genome Research, 11:1227–1236, 2001.[24] Wolfgang Huber, Anja von Heydebreck, Holger Sültmann, Annemarie Poustka, and MartinVingron. Variance stablization applied to <strong>microarray</strong> <strong>data</strong> calibration and to the quantification<strong>of</strong> differential <strong>expression</strong>. Bioinformatics, 18 Suppl. 1:S96–S104, 2002. ISMB 2002.[25] Peter J. Rousseuw and Annick M. Leroy. Robust Regression and Outlier Detection. JohnWiley and Sons, 1987.33
[26] David M. Rocke and Blythe Durbin. A model for measurement error for <strong>gene</strong> <strong>expression</strong>analysis. Journal <strong>of</strong> Computational Biology, 8:557–569, 2001.[27] R.O. Dror, J.G. Murnick, N.J. Rinaldi, V.D. Marinescu, R.M. Rifkin, and R.A. Young. ABayesian approach to transcript estimation from <strong>gene</strong> array <strong>data</strong>: the BEAM technique. InProceedings <strong>of</strong> the Sixth Annual International Conference on Research in ComputationalMolecular Biology (RECOMB), April 2002.[28] Blythe Durbin, Johanna Hardin, Douglas Hawkins, and David Rocke. A variancestabilizingtransformation from <strong>gene</strong>-<strong>expression</strong> <strong>microarray</strong> <strong>data</strong>. Bioinformatics, ISMB,2002.[29] J.M. Claverie. Computational methods for the identification <strong>of</strong> differential and coordinated<strong>gene</strong> <strong>expression</strong>. Human Molecular Genetics, 8:1821–1832, 1999.[30] B.L. Welch. The <strong>gene</strong>ralization <strong>of</strong> Student’s problem when several different populationvariances are involved. Biometrika, 34:28–35, 1947.[31] D.I. Best and C.W. Rayner. Welch’s approximate solution for the Behrens–Fisher problem.Technometrics, 29:205–220, 1987.[32] R. Herwig, P. Aanstad, M. Clark, and H. Lehrach. Statistical evaluation <strong>of</strong> differential<strong>expression</strong> on cDNA nylon arrays with replicated experiments. Nucleic Acids Research,29:E117, 2001.[33] W. Pan. A comparative review <strong>of</strong> statistical methods for discovering differentially expressed<strong>gene</strong>s in replicated <strong>microarray</strong> experiments. Bioinformatics, 18:546–554, 2002.[34] Pierre Baldi and Anthony D. Long. A Bayesian framework for the analysis <strong>of</strong> <strong>microarray</strong><strong>expression</strong> <strong>data</strong>: regularized t-test and statistical inferences <strong>of</strong> <strong>gene</strong> changes. Bioinformatics,17:509–519, June 2001.[35] Ingrid Lönnstedt and Terence P. Speed. Replicated <strong>microarray</strong><strong>data</strong>. Technical report, Department <strong>of</strong> Statistics, UC Berkeley,http://www.stat.Berkeley.EDU/users/terry/zarray/Html/papersindex.html, 2001. Acceptedto Statistica Sinica.[36] Virginia Goss Tusher, Robert Tibshirani, and Gilbert Chu. Significance analysis <strong>of</strong> <strong>microarray</strong>sapplied to the ionizing radiation response. Proc. Natl. Acad. Sci. USA, 98:5116–5121,2001.[37] Bradley Efron, Robert Tibshirani, Virginia Goss, and Gilbert Chu. Microarrays and theiruse in a comparative experiment. Technical report, Stanford University, http://wwwstat.stanford.edu/∼tibs/research.html,October 2000.[38] P.H. Westfall and S.S. Young. Resampling-based multiple testing: examples and methodsfor p-value adjustment. John Wiley and Sons, 1993.34
[39] Y. Benjamini and Y. Hochberg. Controlling the false discovery rate: a practical and powerfulapproach to multiple testing. Journal <strong>of</strong> the Royal Statistical Society B, 57:289–300,1995.[40] J.D. Storey and R. Tibshirani. Estimating false discovery rates under dependence, withapplications to DNA <strong>microarray</strong>s. Technical report, Department <strong>of</strong> Statistics, StanfordUniversity, http://www.stat.berkeley.edu/∼storey/, 2001.[41] J.D. Storey. The positive false discovery rate: A Bayesian interpretation andthe q-value. Technical report, Department <strong>of</strong> Statistics, Stanford University,http://www.stat.berkeley.edu/∼storey/, 2001.[42] B. Efron, R. Tibshirani, J.D. Storey, and V. Tusher. Empirical Bayes analysis <strong>of</strong> a <strong>microarray</strong>experiment. Journal <strong>of</strong> the American Statistical Association, 96:1151–1160, 2001.[43] T.R. Golub, D.K. Slonim, P. Tamayo, C. Huard, M. Gaasenbeek, J.P. Mesirov, H. Coller,M.L. Loh, J.R. Downing, M.A. Caligiuri, C.D. Bloomfield, and E.S. Lander. Molecularclassification <strong>of</strong> cancer: Class discovery and class prediction by <strong>gene</strong> <strong>expression</strong> monitoring.Science, 286:531–537, 1999.[44] Sandrine Dudoit, Jane Fridlyand, and Terence P. Speed. Comparison <strong>of</strong> discriminationmethods for the classification <strong>of</strong> tumors using <strong>gene</strong> <strong>expression</strong> <strong>data</strong>. Journal <strong>of</strong> the AmericanStatistical Association, 97:77–87, 2002.[45] R. Spang, C. Blanchette, H. Zuzan, J. R. Marks, J. Nevins, and M. West. Prediction anduncertainty in the analysis <strong>of</strong> <strong>gene</strong> <strong>expression</strong> pr<strong>of</strong>iles. In E. Wingender, R. H<strong>of</strong>estädt, andI. Liebich, editors, Proceedings <strong>of</strong> the German Conference on Bioinformatics GCB 2001,Braunschweig, 2001.[46] A. Ben-Dor, L. Bruhn, N. Friedman, I. Nachman, M. Schummer, and Z. Yakhini. Tissueclassification with <strong>gene</strong> <strong>expression</strong> pr<strong>of</strong>iles. Journal <strong>of</strong> Computational Biology, 7:559–583,2000.[47] O. Alter, P. Brown, and D. Botstein. Singular value decomposition for genome-wide <strong>expression</strong><strong>data</strong> processing and modeling. Proc. Natl. Acad. Sci. USA, 97:10101–10106, 2000.[48] Kurt Fellenberg, Nicole C Hauser, Benedikt Brors, A Neutzner, Jörg Hoheisel, and MartinVingron. Correspondence analysis applied to <strong>microarray</strong> <strong>data</strong>. Proc. Natl. Acad. Sci. USA,98(19):10781–10786, 2001.[49] P.T. Spellman, G. Sherlock, M.Q. Zhang, V.R. Iyer, K. Anders, M.B. Eisen, P.O. Brown,D. Botstein, and B. Futcher. Comprehensive identification <strong>of</strong> cell cycle-regulated <strong>gene</strong>s <strong>of</strong>the yeast Saccharomyces cerevisiae by <strong>microarray</strong> hybridization. Mol. Biol. Cell, 9:3273–97, 1998.[50] M.J. Greenacre. Theory and applications <strong>of</strong> correspondence analysis. Academic Press,London, 1984.35
[51] A.K. Jain and R.C. Dubes. Algorithms for clustering <strong>data</strong>. Prentice-Hall, 1988.[52] M.B. Eisen, P.T. Spellman, P.O. Brown, and D. Botstein. Cluster analysis and display <strong>of</strong>genome-wide <strong>expression</strong> patterns. Proc. Natl. Acad. Sci. USA, 95:14863–14868, 1998.[53] U. Alon, N. Barkai, D.A. Notterman, K. Gish, S. Ybarra, D. Mack, and A.J. Levine. Broadpatterns <strong>of</strong> <strong>gene</strong> <strong>expression</strong> revealed by clustering analysis <strong>of</strong> tumor and normal colon tissuesprobed by oligonucleotide arrays. Proc. Natl. Acad. Sci. USA, 96:6745–6750, 1999.[54] Z. Bar-Joseph, D.K. Gifford, and T.S. Jaakkola. Fast optimal leaf ordering for hierarchicalclustering. Bioinformatics, Suppl. 1:S22–29, 2001. ISMB 2001.[55] S. Dudoit and J. Fridlyand. A prediction–based resampling method for estimating the number<strong>of</strong> clusters in a <strong>data</strong>set. Genome Biology, 3(7):research0036.1–21, 2002.[56] P. Tamayo, D. Slonim, J. Mesirov, Q. Zhu, S. Kitareewan, E. Dmitrovsky, E.S. Lander, andT.R. Golub. Interpreting patterns <strong>of</strong> <strong>gene</strong> <strong>expression</strong> with self-organizing maps: Methodsand application to hematopoietic differentiation. Proc. Natl. Acad. Sci. USA, 96:2907–2912,1999.[57] A. Ben-Dor, R. Shamir, and Z. Yakhini. Clustering <strong>gene</strong> <strong>expression</strong> patterns. Journal <strong>of</strong>Computational Biology, 6:281–297, 1999.[58] M. Kathleen Kerr and Gary A. Churchill. Bootstrapping cluster analysis: Assessing the reliability<strong>of</strong> conclusions from <strong>microarray</strong> experiments. Proc. Natl. Acad. Sci. USA, 98:8961–8965, 2001.[59] K.S. Pollard and M.J. van der Laan. Statistical inference for simultaneous clustering <strong>of</strong><strong>gene</strong> <strong>expression</strong> <strong>data</strong>. Mathematical Biosciences, 176:99–121, 2002.[60] E.R. Dougherty, J. Barrera, M. Brun, S. Kim, R.M. Cesar, Y. Chen, M. Bittner, and J.M.Trent. Inference from clustering with application to <strong>gene</strong>-<strong>expression</strong> <strong>microarray</strong>s. Journal<strong>of</strong> Computational Biology, 9:105–126, 2002.[61] A.P. Dempster, N.M. Laird, and D.B. Rubin. Maximum likelihood from incomplete <strong>data</strong>via the EM algorithm (with discussion). Journal <strong>of</strong> the Royal Statistical Society B, 39:1–38,1977.[62] C. Fraley and A.E. Raftery. How many clusters? Which clustering method? Answers viamodel–based cluster analysis. The Computer Journal, 41:578–588, 1998.[63] D. Ghosh and A.M. Chinnaiyan. Mixture modelling <strong>of</strong> <strong>gene</strong> <strong>expression</strong> <strong>data</strong> from <strong>microarray</strong>experiments. Bioinformatics, 18:275–286, 2002.[64] G.J. McLachlan, R.W. Bean, and D. Peel. A mixture model-based approach to the clustering<strong>of</strong> <strong>microarray</strong> <strong>expression</strong> <strong>data</strong>. Bioinformatics, 18:413–422, 2002.36
[65] K.Y. Yeung, C. Fraley, A. Murua, A.E. Raftery, and W.L. Ruzzo. Model-based clusteringand <strong>data</strong> transformations for <strong>gene</strong> <strong>expression</strong> <strong>data</strong>. Bioinformatics, 17:977–987, 2001.[66] G. Getz, E. Levine, and E. Domany. Coupled two-way clustering analysis <strong>of</strong> <strong>gene</strong> <strong>microarray</strong><strong>data</strong>. Proc. Natl. Acad. Sci. USA, 97:12079–12084, 2000.[67] Y. Chen and G.M. Church. Biclustering <strong>of</strong> <strong>expression</strong> <strong>data</strong>. In Proceedings <strong>of</strong> the EighthInternational Conference on Intelligent Systems for Molecular Biology (ISMB), pages 93–103. AAAI Press, 2000.[68] A. Califano, G. Stolovitzky, and Y. Tu. <strong>Analysis</strong> <strong>of</strong> <strong>gene</strong> <strong>expression</strong> <strong>microarray</strong>s for phenotypeclassification. In Proceedings <strong>of</strong> the Eighth International Conference on IntelligentSystems for Molecular Biology (ISMB), pages 75–85. AAAI Press, 2000.[69] A. Ben-Dor, Benny Chor, Richard Karp, and Z. Yakhini. Discovering local structure in<strong>gene</strong> <strong>expression</strong> <strong>data</strong>: The order–preserving submatrix problem. In Proceedings <strong>of</strong> theFifth Annual International Conference on Computational Molecular Biology (RECOMB),pages 49–57. ACM Press, 2002.[70] L. Lazzeroni and A. Owen. Plaid models for <strong>gene</strong> <strong>expression</strong> <strong>data</strong>. Statistica Sinica, 12:61–86, 2002.[71] A. Ben-Dor, N. Friedman, and Z. Yakhini. Class discovery in <strong>gene</strong> <strong>expression</strong> <strong>data</strong>. InProceedings <strong>of</strong> the Fifth Annual International Conference on Computational MolecularBiology (RECOMB), pages 31–38. ACM Press, 2001.[72] Anja von Heydebreck, Wolfgang Huber, Annemarie Poustka, and Martin Vingron. Identifyingsplits with clear separation: A new class discovery method for <strong>gene</strong> <strong>expression</strong> <strong>data</strong>.Bioinformatics, 17 Suppl. 1:S107–114, 2001. ISMB 2001.[73] A. Brazma, P. Hingamp, J. Quackenbush, G. Sherlock, P. Spellman, C. Stoeckert, J. Aach,W. Ansorge, C. A. Ball, H. C. Causton, T. Gaasterland, P. Glenisson, F. C. Holstege, I. F.Kim, V. Markowitz, J. C. Matese, H. Parkinson, A. Robinson, U. Sarkans, S. Schulze-Kremer, J. Stewart, R. Taylor, J. Vilo, and M. Vingron. Minimum information about a<strong>microarray</strong> experiment (MIAME) - toward standards for <strong>microarray</strong> <strong>data</strong>. Nat. Genet.,29(4):365–371, 2001.37