Blackwater Creek Watershed Management Plan - Lynchburg College
Blackwater Creek Watershed Management Plan - Lynchburg College
Blackwater Creek Watershed Management Plan - Lynchburg College

Create successful ePaper yourself
Turn your PDF publications into a flip-book with our unique Google optimized e-Paper software.
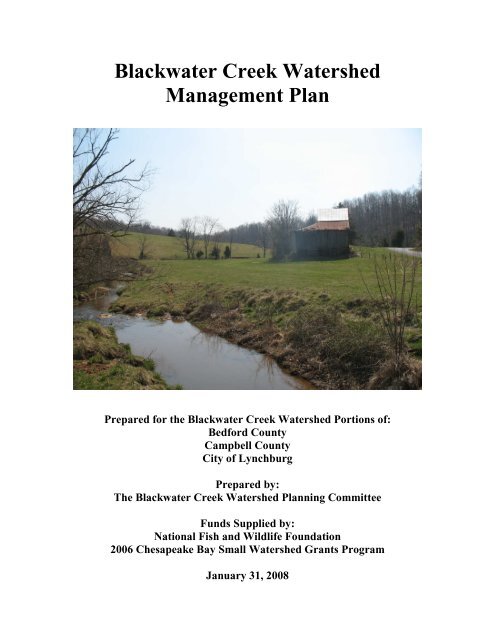
<strong>Blackwater</strong> <strong>Creek</strong> <strong>Watershed</strong><br />
<strong>Management</strong> <strong>Plan</strong><br />
Prepared for the <strong>Blackwater</strong> <strong>Creek</strong> <strong>Watershed</strong> Portions of:<br />
Bedford County<br />
Campbell County<br />
City of <strong>Lynchburg</strong><br />
Prepared by:<br />
The <strong>Blackwater</strong> <strong>Creek</strong> <strong>Watershed</strong> <strong>Plan</strong>ning Committee<br />
Funds Supplied by:<br />
National Fish and Wildlife Foundation<br />
2006 Chesapeake Bay Small <strong>Watershed</strong> Grants Program<br />
January 31, 2008
<strong>Blackwater</strong> <strong>Creek</strong> <strong>Watershed</strong> <strong>Management</strong> <strong>Plan</strong><br />
Table of Contents<br />
Page<br />
List of Tables……………………………………………………………………….<br />
List of Figures……………………………………………………………………<br />
List of Maps………………………………………………………………………...<br />
List of Acronyms…………………………………………………………………...<br />
<strong>Blackwater</strong> <strong>Creek</strong> <strong>Watershed</strong> <strong>Plan</strong>ning Committee…………………………...<br />
Acknowledgements…………………………………………………………………<br />
Executive Summary……………………………………………………………...<br />
Section 1: Introduction………………………………………………………….<br />
Section 2: Methods and Materials………………………………………………<br />
2.1 Mission………………………………………………………………..<br />
2.2 Organization ………………………………………………………….<br />
2.3 <strong>Plan</strong> Development Methodologies…………………………………….<br />
2.4 Existing Data Sources…………………………………………………<br />
2.5 Subwatershed Delineations……………………………………………<br />
2.6 <strong>Watershed</strong> Land Cover Assessment Methods…………………………<br />
2.7 Impervious Surface Estimations………………………………………<br />
2.8 Water Quality………………………………………………………….<br />
2.9 Biological Data………………………………………………………..<br />
2.10 Public Involvement……………………………………………………<br />
Section 3: Existing Conditions…………………………………………………..<br />
3.1 General………………………………………………………………...<br />
3.2 Subwatershed Details………………………………………………….<br />
3.2.1 Subwatershed BW-1 Upper Ivy…………………………….<br />
3.2.2 Subwatershed BW-2 Middle Ivy……………………………<br />
3.2.3 Subwatershed BW-3 Lower Ivy…………………………….<br />
3.2.4 Subwatershed BW-4 Dreaming…………………………….<br />
3.2.5 Subwatershed BW-5 Burton………………………………..<br />
3.2.6 Subwatershed BW-7 Tomahawk…………………………...<br />
3.2.7 Subwatershed BW-8 Middle <strong>Blackwater</strong>…………………..<br />
3.2.8 Subwatershed BW-9 Lower <strong>Blackwater</strong>……………………<br />
3.3 Categories / Ratings of Subwatersheds………………………………..<br />
iv<br />
vi<br />
vii<br />
viii<br />
ix<br />
x<br />
xi<br />
1<br />
6<br />
6<br />
6<br />
6<br />
6<br />
7<br />
8<br />
8<br />
11<br />
11<br />
11<br />
13<br />
13<br />
15<br />
16<br />
18<br />
21<br />
23<br />
26<br />
29<br />
33<br />
35<br />
37<br />
ii
<strong>Blackwater</strong> <strong>Creek</strong> <strong>Watershed</strong> <strong>Management</strong> <strong>Plan</strong><br />
3.4 Land Cover / Land Use………………………………………………..<br />
3.5 Assessing the Water Quality Characteristics of Streams……………...<br />
3.6 Indices of Water Quality………………………………………………<br />
3.7 Pollutants and Sources………………………………………………...<br />
3.7.1 Point Source Pollution……………………………………...<br />
3.7.2 Non-Point Source Pollution………………………………...<br />
3.8 Wet Lands……………………………………………………………..<br />
3.9 Conservation Areas……………………………………………………<br />
37<br />
40<br />
40<br />
49<br />
49<br />
51<br />
54<br />
55<br />
Section 4: <strong>Blackwater</strong> <strong>Creek</strong> <strong>Watershed</strong> – Goals and Objectives…………...… 56<br />
Section 5: <strong>Watershed</strong> Improvement <strong>Plan</strong>………………………………………..<br />
5.1 Preservation of Streams and Buffers………………………………….<br />
5.2 Integration of <strong>Blackwater</strong> / Ivy <strong>Creek</strong> Trail…………………………..<br />
5.3 Stream Restoration…………………………………………………….<br />
5.4 Adoption of New Regulations – City of <strong>Lynchburg</strong>…………………..<br />
5.5 Adoption of New Regulations – Bedford County……………………..<br />
5.6 Adoption of New Regulations – Campbell County…………………...<br />
5.7 Additional Action Opportunities – Cross Jurisdictional Boundaries….<br />
5.8 ESC Ordinances and Fine Structure Overhaul………………………...<br />
5.9 Retention / Detention Basin Evaluation……………………………….<br />
5.10 Model <strong>Watershed</strong> Hydrology………………………………………….<br />
5.11 Bacteria Source Reduction Strategy…………………………………..<br />
5.12 Confluence Study……………………………………………………..<br />
5.13 Continued <strong>Watershed</strong> Studies…………………………………………<br />
5.14 Develop <strong>College</strong> Lake as a Regional Extended Detention Basin……..<br />
5.15 Land Conservation…………………………………………………….<br />
5.16 Abandoned Properties…………………………………………………<br />
5.17 Develop a Citizen Educational Series…………………………………<br />
5.18 Promote Volunteer Monitoring………………………………………..<br />
5.19 Create Additional Public Access Points to Streams…………………..<br />
5.20 Visual Assessment Monitoring (Stream Walks)………………………<br />
5.21 School Campuses……………………………………………………...<br />
58<br />
58<br />
60<br />
61<br />
61<br />
64<br />
66<br />
67<br />
71<br />
71<br />
72<br />
73<br />
74<br />
75<br />
75<br />
76<br />
77<br />
77<br />
78<br />
78<br />
79<br />
79<br />
Section 6: Improvement <strong>Plan</strong> Implementation…………………………………. 80<br />
References…………………………………………………………………………... 82<br />
Appendix A: Additional Available Materials……………………………………… 86<br />
iii
<strong>Blackwater</strong> <strong>Creek</strong> <strong>Watershed</strong> <strong>Management</strong> <strong>Plan</strong><br />
List of Tables<br />
ID<br />
Table Description<br />
Page<br />
Section 2<br />
2.1 Bedford County – Percentages Used in Future Buildout Calculations…….. 9<br />
2.2 Feature Analysis for City of <strong>Lynchburg</strong> Current Impervious Surface<br />
estimates……………………………………………………………………. 10<br />
Section 3<br />
BW-1 Upper Ivy<br />
3.1 BW-1 Current Land Use (<strong>Lynchburg</strong> <strong>College</strong> Studies) …………………… 16<br />
3.2 BW-1 Current Land Use by Bedford County Zoning……………………… 17<br />
3.3 BW-1 Build Out Potential as provided by Bedford County……………….. 17<br />
BW-2 Middle Ivy<br />
3.4 BW-2 Current Land Use (<strong>Lynchburg</strong> <strong>College</strong> Studies) …………………… 18<br />
3.5 BW-2 Current Land Use for Bedford County Portion……………………... 19<br />
3.6 BW-2 Current Land Use for City of <strong>Lynchburg</strong> Portion…………………... 19<br />
3.7 BW-2 Build Out Potential for Bedford County……………………………. 20<br />
3.8 BW-2 Build Out Potential for City of <strong>Lynchburg</strong>…………………………. 20<br />
BW-3 Lower Ivy<br />
3.9 BW-3 Current Land Use Based (<strong>Lynchburg</strong> <strong>College</strong> Studies)…………….. 21<br />
3.10 BW-3 Current Land Use for City of <strong>Lynchburg</strong>…………………………… 22<br />
3.11 BW-3 Build Out Potential for City of <strong>Lynchburg</strong>…………………………. 22<br />
BW-4 Dreaming<br />
3.12 BW-4 Current Land Use (<strong>Lynchburg</strong> <strong>College</strong> Studies)……………………. 23<br />
3.13 BW-4 Current Land Use for Campbell County Portion……………………. 24<br />
3.14 BW-4 Current Land Use for City of <strong>Lynchburg</strong> Portion………………….. 24<br />
3.15 BW-4 Build Out Potential for Campbell County…………………………... 24<br />
3.16 BW-4 Build Out Potential for City of <strong>Lynchburg</strong>…………………………. 25<br />
BW-5 Burton<br />
3.17 BW-5 Current Land Use (<strong>Lynchburg</strong> <strong>College</strong> Studies)……………………. 26<br />
3.18 BW-5 Current Land Use for Campbell County Portion……………………. 27<br />
3.19 BW-5 Current Land Use for City of <strong>Lynchburg</strong> Portion…………………... 27<br />
3.20 BW-5 Build Out Potential for Campbell County…………………………... 27<br />
3.21 BW-5 Build Out Potential for City of <strong>Lynchburg</strong>…………………………. 28<br />
BW-7 Tomahawk<br />
3.22 BW-7 Current Land Use (<strong>Lynchburg</strong> <strong>College</strong> Studies)……………………. 29<br />
3.23 BW-7 Current Land Use for Bedford County Portion……………………... 30<br />
3.24 BW-7 Current Land Use for Campbell County Portion……………………. 30<br />
3.25 BW-7 Current Land Use for City of <strong>Lynchburg</strong> Portion…………………... 31<br />
iv
<strong>Blackwater</strong> <strong>Creek</strong> <strong>Watershed</strong> <strong>Management</strong> <strong>Plan</strong><br />
3.26 BW-7 Build Out Potential for Bedford County……………………………. 31<br />
3.27 BW-7 Build Out Potential for Campbell County…………………………... 31<br />
3.28 BW-7 Build Out Potential for City of <strong>Lynchburg</strong>…………………………. 32<br />
BW-8 Middle <strong>Blackwater</strong><br />
3.29 BW-8 Current Land Use (<strong>Lynchburg</strong> <strong>College</strong> Studies) …………………… 33<br />
3.30 BW-8 Current Land Use as Reported by the City of <strong>Lynchburg</strong>…………... 34<br />
3.31 BW-8 Build Out Potential for City of <strong>Lynchburg</strong>…………………………. 34<br />
BW-9 Lower <strong>Blackwater</strong><br />
3.32 BW-9 Current Land Use (<strong>Lynchburg</strong> <strong>College</strong> Studies)……………………. 35<br />
3.33 BW-9 Current Land Use as Reported by the City of <strong>Lynchburg</strong>…………... 36<br />
3.34 BW-9 Build Out Potential for City of <strong>Lynchburg</strong>…………………………. 36<br />
<strong>Blackwater</strong> <strong>Creek</strong> <strong>Watershed</strong><br />
3.35 Estimated Population Growth by Jurisdiction……………………………… 38<br />
3.36 James River Association Code and Ordinance Worksheet Scores………… 40<br />
3.37 FBI / Water Quality Table…………………………………………………. 46<br />
3.38 Species Richness / Water Quality Table…………………………………… 47<br />
3.39 EPT / Water Quality Table………………………………………………… 47<br />
3.40 PMA / Water Quality Table……………………………………………….. 48<br />
3.41 DEQ E. coli Sampling Results…………………………………………….. 52<br />
Section 5<br />
5.1 Balance Sheet for <strong>Watershed</strong> Protection…………………………………… 59<br />
v
<strong>Blackwater</strong> <strong>Creek</strong> <strong>Watershed</strong> <strong>Management</strong> <strong>Plan</strong><br />
List of Figures<br />
ID Figure Description Page<br />
Section 3<br />
3.1 BW-1 Pie Chart of Current Land Use…………………………………….. 17<br />
3.2 BW-2 Pie Chart of Current Land Use…………………………………….. 19<br />
3.3 BW-3 Pie Chart of Current Land Use…………………………………….. 22<br />
3.4 BW-4 Pie Chart of Current Land Use…………………………………….. 24<br />
3.5 BW-5 Pie Chart of Current Land Use…………………………………….. 27<br />
3.6 BW-7 Pie Chart of Current Land Use…………………………………….. 30<br />
3.7 BW-8 Pie Chart of Current Land Use…………………………………….. 34<br />
3.8 BW-9 Pie Chart of Current Land Use…………………………………….. 36<br />
3.9 Virginia Stream Condition Index by Location<br />
41<br />
(Benthic Macroinvertebrate)<br />
3.10 Total Fish Species………………………………………………………… 43<br />
3.11 Total Fish Number………………………………………………………... 43<br />
3.12 Percent Percids …………………………………………………………… 44<br />
3.13 Percent Cyprinids…………………………………………………………. 44<br />
3.14 Percent Ictalurids………………………………………………………….. 45<br />
3.15 Percent Sunfish……………………………………………………………. 45<br />
3.16 FBI Index…………………………………………………………………. 46<br />
3.17 Species Richness………………………………………………………….. 47<br />
3.18 EPT Index ………………………………………………………………... 48<br />
3.19 Percent Model Affinity (PMA)…………………………………………… 48<br />
Section 5<br />
5.1 Urban Impacted Localities of the James River <strong>Watershed</strong>……………... 62<br />
5.2 Urbanizing Localities in the James River <strong>Watershed</strong>…………………... 65<br />
vi
<strong>Blackwater</strong> <strong>Creek</strong> <strong>Watershed</strong> <strong>Management</strong> <strong>Plan</strong><br />
List of Maps<br />
ID<br />
Map Description<br />
Page<br />
Section 1<br />
1.1 Map of <strong>Blackwater</strong> <strong>Creek</strong> <strong>Watershed</strong>………………………………………<br />
5<br />
Section 3<br />
3.1 Subwatershed Delineations………………………………………………... 15<br />
3.2 BW-1 (Upper Ivy) Subwatershed………………………………………….. 16<br />
3.3 BW-2 (Middle Ivy) Subwatershed………………………………………… 18<br />
3.4 BW-3 (Lower Ivy) Subwatershed…………………………………………. 21<br />
3.5 BW-4 (Dreaming) Subwatershed………………………………………….. 23<br />
3.6 BW-5 (Burton) Subwatershed……………………………………………... 26<br />
3.7 BW-7 (Tomahawk) Subwatershed………………………………………… 29<br />
3.8 BW-8 (Middle <strong>Blackwater</strong>) Subwatershed………………………………... 33<br />
3.9 BW-9 (Lower <strong>Blackwater</strong>) Subwatershed…………………………………. 35<br />
3.10 <strong>Blackwater</strong> <strong>Creek</strong> <strong>Watershed</strong> Current Land Cover………………………... 39<br />
3.11 Map of Remaining CSO Points Within the City of <strong>Lynchburg</strong>…………… 51<br />
vii
<strong>Blackwater</strong> <strong>Creek</strong> <strong>Watershed</strong> <strong>Management</strong> <strong>Plan</strong><br />
List of Acronyms<br />
AFD<br />
BCLP<br />
BCWPC<br />
BMP<br />
BW<br />
CVLC<br />
COW<br />
CREP<br />
CRP<br />
CSO<br />
CSS<br />
CWP<br />
DCR<br />
DEQ<br />
EPA<br />
EQIP<br />
ESC<br />
GIS<br />
GLEN<br />
HSPF<br />
JRA<br />
LC<br />
LID<br />
MRLC<br />
NEMO<br />
NFWF<br />
NLCD<br />
NPDES<br />
NPS<br />
PDR<br />
SAFETEA-LU<br />
SWCD<br />
SWM<br />
SCI<br />
TDR<br />
TMDL<br />
TSS<br />
USEPA<br />
USGS<br />
VADCR<br />
VADEQ<br />
VDOT<br />
VOF<br />
WHIP<br />
Agricultural and Forestal District<br />
Bedford Citizens for Land Conservation<br />
<strong>Blackwater</strong> <strong>Creek</strong> <strong>Watershed</strong> <strong>Plan</strong>ning Committee<br />
Best <strong>Management</strong> Practice<br />
<strong>Blackwater</strong><br />
Central Virginia Land Conservancy<br />
Code and Ordinance Worksheet<br />
Conservation Reserve Enhancement Program<br />
Conservation Reserve Program<br />
Combined Sewer Overflow<br />
Combined Sewer System<br />
Center for <strong>Watershed</strong> Protection<br />
Virginia Department of Conservation & Recreation<br />
Virginia Department of Environmental Quality<br />
United States Environmental Protection Agency<br />
Environmental Quality Incentives Program<br />
Erosion and Sediment Control<br />
Geographical Information Systems<br />
Greater <strong>Lynchburg</strong> Environmental Network<br />
Hydrological Simulation Program - FORTRAN<br />
James River Association<br />
<strong>Lynchburg</strong> <strong>College</strong><br />
Low Impact Development<br />
Multi-Resolution Land Characterization<br />
Non-point Education for Municipal Officials<br />
National Fish and Wildlife Foundation<br />
National Land Cover Data<br />
National Pollutant Discharge Elimination System<br />
Non Point Source<br />
Purchase of Development Rights<br />
Safe Accountable Flexible Efficient Transportation Equity Act: A<br />
Legacy for Users<br />
Soil and Water Conservation District<br />
Stormwater <strong>Management</strong><br />
Stream Condition Index<br />
Transfer of Development Rights<br />
Total Maximum Daily Load<br />
Total Suspended Solids<br />
United States Environmental Protection Agency<br />
United States Geological Survey<br />
Virginia Department of Conservation & Recreation<br />
Virginia Department of Environmental Quality<br />
Virginia Department of Transportation<br />
Virginia Outdoors Foundation<br />
Wildlife Habitat Incentives Program<br />
viii
<strong>Blackwater</strong> <strong>Creek</strong> <strong>Watershed</strong> <strong>Management</strong> <strong>Plan</strong><br />
<strong>Blackwater</strong> <strong>Creek</strong> <strong>Watershed</strong> <strong>Plan</strong>ning Committee<br />
Bedford County<br />
Dalton, Pete<br />
Campbell County<br />
Stokes, Brian<br />
City of <strong>Lynchburg</strong><br />
Frazier, Kay<br />
Hawkins, Erin<br />
Reeder, Andrew<br />
Talian, James<br />
<strong>Lynchburg</strong> <strong>College</strong><br />
Shahady, Thomas<br />
Fitzsimmons, Patricia<br />
Senior Erosion and Sediment Inspector, Department of<br />
Community Development, Division of Natural Resources<br />
Program Manager, Erosion and Sediment Control, <strong>Plan</strong>ning<br />
Department<br />
Director, Parks & Recreation Department<br />
Environmental <strong>Plan</strong>ner, Department of Community<br />
Development<br />
Parks Services Manager, Parks & Recreation Department<br />
Senior Design Engineer, Department of Community<br />
Development<br />
Associate Professor, Environmental Science, Project Director<br />
Project Manager, Environmental Science,<br />
Project Coordinator<br />
Peaks of Otter Soil and Water Conservation District<br />
Sanderlin, Gavin Conservation Specialist<br />
Robert E. Lee Soil and Water Conservation District<br />
Strang, Judy<br />
Education Specialist<br />
Virginia Department of Conservation and Recreation (DCR)<br />
Dean, Nissa<br />
Regional Director, James <strong>Watershed</strong> Office<br />
Sedlick, Jennifer <strong>Watershed</strong> Field Coordinator, James <strong>Watershed</strong> Office<br />
Virginia Department of Environmental Quality (DEQ)<br />
Gray, Amanda Water <strong>Plan</strong>ning Engineer, South Central Regional Office<br />
Virginia’s Region 2000 Local Governmental Council<br />
Hitchcock, Kelly Regional Development Specialist<br />
ix
<strong>Blackwater</strong> <strong>Creek</strong> <strong>Watershed</strong> <strong>Management</strong> <strong>Plan</strong><br />
Acknowledgements<br />
Bedford Citizens for Land Preservation<br />
Nan Carmack, Vice President<br />
Bedford County<br />
Carl Levandoski, GIS Coordinator<br />
Campbell County<br />
Dale Woods, GIS Analyst<br />
Central Virginia Land Conservancy<br />
Jeff Smith<br />
City of <strong>Lynchburg</strong><br />
Shaun Conway, GIS Analyst<br />
Allison Johnson, GIS Manager<br />
Jesse Pinchot, GIS Analyst<br />
Engineering Concepts, Inc.<br />
C.J. Mitchem, Environmental <strong>Plan</strong>ner<br />
Greater <strong>Lynchburg</strong> Environmental Network (GLEN)<br />
David Robertson, Department of Forestry, Virginia Polytechnic Institute and State<br />
University<br />
Laura-Gray Street, Assistant Professor, Randolph <strong>College</strong><br />
James River Association<br />
Amber Foster, Environmental Scientist<br />
<strong>Lynchburg</strong> <strong>College</strong><br />
Dr. Kenneth Garren, President<br />
Steve Arnold, Associate Vice President for <strong>College</strong> Relations<br />
Dr. David Perault, Associate Professor<br />
Dr. Ed Polloway, Professor<br />
Robert E. Lee Soil & Water Conservation District<br />
Anne Marie Clark, <strong>Watershed</strong> Coordinator<br />
Virginia Department of Environmental Quality<br />
Mark Bushing, Environmental Engineer<br />
Paula Nash, TMDL Coordinator<br />
x
<strong>Blackwater</strong> <strong>Creek</strong> <strong>Watershed</strong> <strong>Management</strong> <strong>Plan</strong><br />
Executive Summary<br />
The <strong>Blackwater</strong> <strong>Creek</strong> <strong>Watershed</strong> <strong>Plan</strong> represents a long term commitment to preserve<br />
and protect the natural resources of this watershed. Representatives from the<br />
Environmental Science faculty and staff of <strong>Lynchburg</strong> <strong>College</strong>, City of <strong>Lynchburg</strong>,<br />
Bedford County, Campbell County, Robert E. Lee and Peaks of Otter Soil and Water<br />
Conservation Districts, Department of Environmental Quality (DEQ), Virginia<br />
Department of Conservation and Recreation (DCR), Virginia’s Region 2000 Local<br />
Government Council, National Fish and Wildlife Foundation (NFWF), and other<br />
supporting stakeholders played a critical and active part in the development of this plan.<br />
The <strong>Blackwater</strong> <strong>Creek</strong> <strong>Watershed</strong> <strong>Management</strong> <strong>Plan</strong> is a critical step in protecting the<br />
environment, and increasing concern and awareness among citizens. The <strong>Blackwater</strong><br />
<strong>Creek</strong> <strong>Watershed</strong> <strong>Management</strong> <strong>Plan</strong> represents the commitment to:<br />
Build strong partnerships in improving and maintaining a healthy environment<br />
across the political jurisdictions: City of <strong>Lynchburg</strong>, Bedford County, and<br />
Campbell County.<br />
Promote and support community-based efforts in preserving the natural resources<br />
of the <strong>Blackwater</strong> <strong>Creek</strong> <strong>Watershed</strong>, while preserving property rights within the<br />
watershed.<br />
Promote watershed awareness, appreciation, and active stewardship among<br />
residents, community associations, and businesses for maintaining a healthy<br />
environment.<br />
Included in the development of this watershed plan is the assessment of the current<br />
conditions, the projection of future land use changes, and the analysis of potential effects<br />
these changes will have on the environmental health of the watershed. Information has<br />
been gathered and analyzed using various software tools. In accordance with the<br />
Chesapeake Bay 2000 Agreement, objectives have been defined with recommended<br />
measurable activities. The intent is to preserve and conserve areas not yet impacted, to<br />
slow degradation of watershed natural resources in urbanizing areas, and to lessen the<br />
projected impact of continued development.<br />
The <strong>Blackwater</strong> <strong>Creek</strong> <strong>Watershed</strong> <strong>Management</strong> <strong>Plan</strong> is based upon the findings of recent<br />
comprehensive scientific studies of the environmental health of the <strong>Blackwater</strong> <strong>Creek</strong><br />
watershed. The management plan immediately succeeds the completion of the<br />
“<strong>Blackwater</strong> <strong>Creek</strong> <strong>Watershed</strong> Resource Analysis” and the “<strong>College</strong> Lake: Long – Term<br />
Assessment of Water Quality and Sediment Characterization” studies. The Resource<br />
Analysis Project, funded by the National Fish and Wildlife Foundation (2005 Chesapeake<br />
Bay Small <strong>Watershed</strong>s Grant Program), included the development of the <strong>Blackwater</strong><br />
<strong>Creek</strong> <strong>Watershed</strong> Data Base with water quality, stream walk, and land use data from<br />
studies as far back as 1971, the “State of <strong>Blackwater</strong> <strong>Creek</strong> <strong>Watershed</strong>: <strong>Blackwater</strong> <strong>Creek</strong><br />
<strong>Watershed</strong> Initiative” June 2006 report, Geographical Information Systems (GIS)<br />
mapping, and activities for increasing public awareness. The <strong>College</strong> Lake Assessment<br />
xi
<strong>Blackwater</strong> <strong>Creek</strong> <strong>Watershed</strong> <strong>Management</strong> <strong>Plan</strong><br />
project was funded by the Virginia Environmental Endowment. These studies provided<br />
the basis and support materials for this watershed plan.<br />
Several related plans and initiatives have demonstrated the need and have also provided<br />
foundation for this watershed management plan. These include the Virginia Department<br />
of Environmental Quality Total Maximum Daily Load analysis, the James River<br />
Association’s “Building a Cleaner James River”, and the Chesapeake Bay Nutrient and<br />
Sediment Reduction Tributary Strategy for the James River.<br />
The <strong>Blackwater</strong> <strong>Creek</strong> <strong>Watershed</strong> <strong>Plan</strong> is organized as follows:<br />
Section 1: Introduction to the <strong>Blackwater</strong> <strong>Creek</strong> <strong>Watershed</strong>:<br />
Introduces the reader to the <strong>Blackwater</strong> <strong>Creek</strong> watershed with a brief history of the<br />
watershed. Includes an overview of data concerning size, boundaries, surface waters, and<br />
environmental conditions.<br />
Section 2: Methods:<br />
Provides descriptions of the processes used in the development of the watershed plan and<br />
of the methods used in gathering and analyzing pertinent data.<br />
Section 3: Existing Conditions:<br />
Provides detail about the existing conditions of the environmental quality by category<br />
(climate, geography, etc.), with much of the data specific to defined subwatersheds.<br />
Section 4: <strong>Watershed</strong> Goals and Objectives:<br />
Defines goals and objectives for the <strong>Blackwater</strong> <strong>Creek</strong> watershed.<br />
Section 5: <strong>Watershed</strong> Improvement <strong>Plan</strong>:<br />
Provides narrative for the improvement of the watershed with proposed action<br />
opportunities.<br />
Section 6: Improvement <strong>Plan</strong> Implementation:<br />
Prioritizes action opportunities defined in Section 5, with proposed time frames for the<br />
action opportunities to be completed.<br />
The <strong>Blackwater</strong> <strong>Creek</strong> <strong>Watershed</strong> <strong>Management</strong> Committee (BCWMC) recommends bold<br />
initiatives to be undertaken by local government to include changes in zoning and<br />
regulations for protection and conservation of natural resources. Through this plan, the<br />
committee identified action opportunities which will involve representatives from local<br />
government, educational organizations, businesses, and citizens. The <strong>Blackwater</strong> <strong>Creek</strong><br />
<strong>Watershed</strong> <strong>Management</strong> <strong>Plan</strong> includes action opportunities for conservation and<br />
preservation, water quality and land use improvements, additional research, and<br />
education / outreach.<br />
It is anticipated that the <strong>Blackwater</strong> <strong>Creek</strong> <strong>Watershed</strong> <strong>Management</strong> <strong>Plan</strong> will be adjusted<br />
as additional information becomes available. Completion of recommendations is<br />
xii
<strong>Blackwater</strong> <strong>Creek</strong> <strong>Watershed</strong> <strong>Management</strong> <strong>Plan</strong><br />
expected to take a number of years. The support of local government planning<br />
departments, elected officials, leadership within the business community, and private<br />
citizens is necessary for success. Funding sources for watershed management is also<br />
critical.<br />
The <strong>Blackwater</strong> <strong>Creek</strong> <strong>Watershed</strong> <strong>Plan</strong>ning Committee will continue to meet, with plans<br />
to initiate and support the objectives defined in this plan. These committee members<br />
agree to support and work toward the implementation of the defined recommendations, to<br />
change the direction of environmental practice, and to work proactively to protect and<br />
restore environmental quality of the <strong>Blackwater</strong> <strong>Creek</strong> watershed.<br />
xiii
<strong>Blackwater</strong> <strong>Creek</strong> <strong>Watershed</strong> <strong>Management</strong> <strong>Plan</strong><br />
Section 1: Introduction<br />
Introduction to the <strong>Blackwater</strong> <strong>Creek</strong> <strong>Watershed</strong> <strong>Management</strong> <strong>Plan</strong>:<br />
The <strong>Blackwater</strong> <strong>Creek</strong> <strong>Watershed</strong> <strong>Management</strong> <strong>Plan</strong> represents a proactive collaborative<br />
effort of stakeholders at local, state, and federal levels. It is intended to be a living<br />
document with measures to preserve and improve the watershed environmental health,<br />
where amendments and adjustments can be made as changes occur and more information<br />
becomes available.<br />
There have been a number of plans in this region that highlight the need to preserve<br />
sensitive natural resources. The City of <strong>Lynchburg</strong>, within its Comprehensive <strong>Plan</strong><br />
(2002), speaks of the goal to “manage important natural systems to improve the health and<br />
enjoyment of future generations”. Bedford County’s Comprehensive <strong>Plan</strong> states that the<br />
“citizens of the County are strongly committed to maintaining agricultural areas and<br />
protecting the natural environment within and around the County.” The Campbell County<br />
Comprehensive <strong>Plan</strong> states two specific goals within the Natural Environment: (1)<br />
Perpetuate a healthy natural environment in Campbell County and (2) Promote an<br />
environmentally sound land use strategy for the County.<br />
Additionally, the Region 2000 Regional Commission (local <strong>Plan</strong>ning District<br />
Commission) developed the Greenways and Blueways <strong>Plan</strong>, a plan of interconnected green<br />
spaces and corridors that serve to preserve open space, enhance water quality and habitat<br />
areas, protect passive recreation lands, coordinate land use and transportation planning,<br />
and promote cultural and economic investment. This plan was developed for Amherst,<br />
Appomattox, Bedford and Campbell Counties and the Cities of Bedford and <strong>Lynchburg</strong>.<br />
Resources within the watershed, including the <strong>Blackwater</strong> <strong>Creek</strong> trail system and <strong>College</strong><br />
Lake, are seen as key resources within this broad ecological system.<br />
Several related initiatives have demonstrated the need and have provided a foundation for<br />
this watershed management plan.<br />
• The Virginia Department of Environmental Quality (DEQ) has identified<br />
<strong>Blackwater</strong> <strong>Creek</strong> as impaired (bacteria) and has conducted a Total Maximum<br />
Daily Load (TMDL) analysis completed May of 2007.<br />
• The James River Association conducted a study of codes and ordinances, and<br />
produced the report “Building a Cleaner James River” January 2007 with<br />
recommendations.<br />
• Recent stakeholder studies, including the <strong>Blackwater</strong> <strong>Creek</strong> Resource Analysis<br />
Project and student originated studies at <strong>Lynchburg</strong> <strong>College</strong>, Randolph-Macon<br />
Woman’s <strong>College</strong>, and Central Virginia Governors School, provide data suggesting<br />
the negative impact urbanization is forcing on water quality.<br />
• The Chesapeake Bay Nutrient and Sediment Reduction Tributary Strategy for the<br />
James River (James River is on the receiving end from <strong>Blackwater</strong> <strong>Creek</strong>) includes<br />
strategies for minimizing nutrient and sediment loads.<br />
1
<strong>Blackwater</strong> <strong>Creek</strong> <strong>Watershed</strong> <strong>Management</strong> <strong>Plan</strong><br />
In 1983 and 1987, the states of Virginia, Maryland, Pennsylvania, the District of<br />
Columbia, the Chesapeake Bay Commission and the U.S. Environmental Protection<br />
Agency signed agreements that established the Chesapeake Bay Program partnership to<br />
protect and restore the Chesapeake Bay’s ecosystem. In year 2000, this commitment was<br />
reaffirmed, to manage the future of the Chesapeake Bay and its tributaries (Chesapeake<br />
2000). The <strong>Blackwater</strong> <strong>Creek</strong> watershed flows into the James River, and then to the<br />
Chesapeake Bay.<br />
The <strong>Blackwater</strong> <strong>Creek</strong> <strong>Watershed</strong> <strong>Plan</strong> has been developed to address the goals and<br />
commitments defined by the Chesapeake 2000 Agreement (adapted). The following<br />
excerpts from the Chesapeake 2000 Agreement apply directly to the <strong>Blackwater</strong> <strong>Creek</strong><br />
<strong>Watershed</strong> <strong>Plan</strong>.<br />
The Chesapeake 2000 Agreement:<br />
Goals Applicable to the <strong>Blackwater</strong> <strong>Creek</strong> <strong>Watershed</strong><br />
1. Vital Habitat Protection and Restoration: Preserve, protect, and restore those<br />
habitats and natural areas that are vital to the survival and diversity of the living<br />
resources of the Bay and its rivers.<br />
2. Water Quality Protection and Restoration: Achieve and maintain the water quality<br />
necessary to support the aquatic living resources of the Bay and its tributaries and<br />
to protect human health.<br />
3. Sound Land Use: Develop, promote and achieve sound land use practices which<br />
protect and restore watershed resources and water quality, maintain reduced<br />
pollutant loadings for the Bay and its tributaries, and restore and preserve aquatic<br />
living resources.<br />
4. Stewardship and Community Engagement: Promote individual stewardship and<br />
assist individuals, community-based organizations, businesses, local governments<br />
and schools to undertake initiatives to achieve the goals and commitments of the<br />
Chesapeake 2000 Agreement.<br />
2
<strong>Blackwater</strong> <strong>Creek</strong> <strong>Watershed</strong> <strong>Management</strong> <strong>Plan</strong><br />
Introduction to the <strong>Blackwater</strong> <strong>Creek</strong> / Ivy <strong>Creek</strong> <strong>Watershed</strong>s:<br />
Heightened awareness concerning urbanization in the watershed developed during efforts<br />
to clean up <strong>College</strong> Lake. When the dam was built on <strong>College</strong> Lake, the lake area was<br />
approximately 44.5 acres with a maximum depth of almost 30 feet. Today, the depth of<br />
the lake averages 7 feet with less than 25 acres of surface area. Over the years, <strong>College</strong><br />
Lake has experienced problems of water quality and sedimentation as the upstream<br />
portions of the watershed were developed.<br />
The majority of the <strong>Blackwater</strong> <strong>Creek</strong> <strong>Watershed</strong> is rapidly growing in population and<br />
development. From 1990 to 2000, the population in the City of <strong>Lynchburg</strong> decreased<br />
slightly however the counties had significant population growth of 32.2% in Bedford<br />
County and 7.4% in Campbell County. Between 2000 and 2010, each municipality is<br />
expected to continue growing with a 0.04% increase in the City of <strong>Lynchburg</strong>, 18.6 % in<br />
Bedford County, and 5.14% in Campbell County (City of <strong>Lynchburg</strong> Comprehensive<br />
<strong>Plan</strong>). Much of this expected growth in these jurisdictions is within the <strong>Blackwater</strong><br />
<strong>Creek</strong> <strong>Watershed</strong>.<br />
The <strong>Blackwater</strong> <strong>Creek</strong> <strong>Watershed</strong> continues to be impacted through urbanization and<br />
increasing impervious surface, resulting in sedimentation, channelization, nutrient runoff,<br />
loss and/or alteration of riparian habitat, and combined sewer / stormwater overflow<br />
(CSO). Furthermore, evidence suggests this degradation is accelerating (Shahady and<br />
Fitzsimmons 53). Disparity between sample sites becomes more pronounced in recent<br />
data sets when compared with earlier data. This disparity is further demonstrated through<br />
the differences in upper and lower portions of this watershed.<br />
The <strong>Blackwater</strong> <strong>Creek</strong> / Ivy <strong>Creek</strong> <strong>Watershed</strong>s have a drainage area of about 42,000 acres<br />
(170 km 2 ) within three municipal jurisdictions (the City of <strong>Lynchburg</strong>, Bedford County,<br />
and Campbell County). The City of <strong>Lynchburg</strong> is primarily urbanized. Areas of each of<br />
the two counties adjacent to the City of <strong>Lynchburg</strong> are urbanizing and are expanding into<br />
the undeveloped portions of the watershed. The <strong>Blackwater</strong> <strong>Creek</strong> <strong>Watershed</strong> can be<br />
logically divided into two principle areas: (1) the <strong>Blackwater</strong> <strong>Creek</strong> Drainage and (2) the<br />
Ivy <strong>Creek</strong> Drainage.<br />
The <strong>Blackwater</strong> <strong>Creek</strong> Drainage Area: Approximate Size 17,959 Acres<br />
<strong>Blackwater</strong> <strong>Creek</strong> is a tributary of the James River in Central Virginia, approximately<br />
120 miles west of the City of Richmond. Most of the City of <strong>Lynchburg</strong> and portions of<br />
Bedford and Campbell Counties comprise the <strong>Blackwater</strong> <strong>Creek</strong> portion of the watershed.<br />
Within this drainage, 78% is governed by the City of <strong>Lynchburg</strong>, 14% is governed by<br />
Campbell County, and the remaining 8% is governed by Bedford County. Large portions<br />
of this watershed within the municipal jurisdiction of <strong>Lynchburg</strong> are urbanized and facing<br />
increased pressures for development.<br />
The headwaters of <strong>Blackwater</strong> <strong>Creek</strong> are comprised of three streams: Burton, Tomahawk,<br />
and Dreaming <strong>Creek</strong>s. Burton <strong>Creek</strong> forms in Campbell County quickly becoming a 3 rd<br />
3
<strong>Blackwater</strong> <strong>Creek</strong> <strong>Watershed</strong> <strong>Management</strong> <strong>Plan</strong><br />
order stream then running through the most actively developed portions of <strong>Lynchburg</strong><br />
City. Dreaming and Tomahawk streams flow in a similar fashion, and develop into a 3 rd<br />
order stream flowing through a mix of suburban and urban developed portions of<br />
<strong>Lynchburg</strong> City. At the collection of the three streams, <strong>Blackwater</strong> <strong>Creek</strong> develops as a<br />
4 th order stream flowing into <strong>College</strong> Lake, a 22 acre impoundment. <strong>Blackwater</strong> <strong>Creek</strong><br />
then converges with Ivy <strong>Creek</strong> as it enters the older portions of the city before entering<br />
the James River as a 5 th order stream.<br />
The Ivy <strong>Creek</strong> Drainage Area: Approximate Size 23,946 Acres<br />
The Ivy <strong>Creek</strong> portion of the watershed originates in the rural portions of Bedford County<br />
and <strong>Lynchburg</strong>. Bedford County governs 73% of this drainage. The City of <strong>Lynchburg</strong><br />
governs the remaining 27%. Areas of Bedford County near the City of <strong>Lynchburg</strong><br />
jurisdictional line are experiencing significant development pressure.<br />
Primarily surrounded by wooded forest and farmland, the stream is 1 st - 2 rd order through<br />
its upper portion. Traveling through Bedford County on its way to <strong>Lynchburg</strong>, Ivy <strong>Creek</strong><br />
develops through 3 rd and 4 th orders and contacts heavy development in Forest, Virginia.<br />
Cheese <strong>Creek</strong> is the major tributary entering Ivy <strong>Creek</strong>. It drains primarily residential<br />
development in the northern section of <strong>Lynchburg</strong> City. Ivy continues to flow through<br />
urban development until it converges with <strong>Blackwater</strong> <strong>Creek</strong> creating the 5 th order<br />
stream.<br />
4
<strong>Blackwater</strong> <strong>Creek</strong> <strong>Watershed</strong> <strong>Management</strong> <strong>Plan</strong><br />
Map 1.1 – Map of <strong>Blackwater</strong> <strong>Creek</strong> <strong>Watershed</strong><br />
5
<strong>Blackwater</strong> <strong>Creek</strong> <strong>Watershed</strong> <strong>Management</strong> <strong>Plan</strong><br />
Section 2: Methods and Materials<br />
2.1 Mission<br />
The <strong>Blackwater</strong> <strong>Creek</strong> <strong>Watershed</strong> <strong>Management</strong> <strong>Plan</strong> was funded by the National Fish and<br />
Wildlife Foundation (NFWF) and was written as a living document. It is a framework for<br />
how and where management tools will be applied. The management tools laid out in this<br />
document were developed through examination of critical elements; including land use /<br />
zoning data, impervious surface estimations and water quality. The <strong>Blackwater</strong> <strong>Creek</strong><br />
<strong>Watershed</strong> <strong>Management</strong> <strong>Plan</strong> is the result of collaborative, cooperative, and participative<br />
process among many stakeholders.<br />
2.2 Organization<br />
The <strong>Blackwater</strong> <strong>Creek</strong> <strong>Watershed</strong> <strong>Management</strong> Committee was formed by selecting a<br />
diverse group of stakeholders from local, state, and federal organizations. This<br />
committee met monthly to review and develop materials pertinent to the plan. Specialties<br />
committees were formed as needs were identified. Individuals and groups with specific<br />
expertise were also called upon for input as needed.<br />
The committee solicited information from the citizens of all three political jurisdictions<br />
through public meetings and forums, newspaper articles, electronic communication<br />
(emails, web sites, and blogs), and phone conversations.<br />
2.3 <strong>Plan</strong> Development Methodologies<br />
The <strong>Blackwater</strong> <strong>Creek</strong> <strong>Watershed</strong> <strong>Plan</strong>ning Committee collectively decided to use a<br />
combination of methodologies as defined by the Department of Conservation and<br />
Recreation (DCR), the Environmental Protection Agency (EPA), and the Center for<br />
<strong>Watershed</strong> Protection (CWP). Each methodology was analyzed to determine the portions<br />
that fit well with the needs of this watershed management plan.<br />
The plan is designed to build upon research including the <strong>Blackwater</strong> <strong>Creek</strong> <strong>Watershed</strong><br />
Initiative, Total Maximum Daily Load studies, and the James River Association’s 2007<br />
Building a Cleaner James River Study.<br />
2.4 Existing Data Sources<br />
For the evaluation of current watershed environmental conditions, existing collections of<br />
data were reviewed and analyzed for applicability. These same sources of information<br />
were studied to determine trends and patterns. These data sources included reports,<br />
articles, plans, and data bases.<br />
6
<strong>Blackwater</strong> <strong>Creek</strong> <strong>Watershed</strong> <strong>Management</strong> <strong>Plan</strong><br />
<strong>Plan</strong>ning Documents and Reports<br />
1. “Building a Cleaner James River” January 2007 report by the James River<br />
Association<br />
2. “State of the <strong>Blackwater</strong> <strong>Creek</strong> <strong>Watershed</strong>: <strong>Blackwater</strong> <strong>Creek</strong> <strong>Watershed</strong> Initiative”<br />
June 2006 report by <strong>Lynchburg</strong> <strong>College</strong> and Partners.<br />
3. “Bacteria Total Maximum Daily Load Development for the James River Basin” May<br />
2007 report submitted by Virginia Department of Environmental Quality, prepared by<br />
Engineering Concepts, Inc.<br />
4. “<strong>College</strong> Lake: Long – Term Assessment of Water Quality and Sediment<br />
Characterization” 2005-2006 Report by <strong>Lynchburg</strong> <strong>College</strong><br />
5. Bedford County 2025 Comprehensive <strong>Plan</strong><br />
6. Campbell County Comprehensive <strong>Plan</strong><br />
7. City of <strong>Lynchburg</strong> Comprehensive <strong>Plan</strong> 2002-2020<br />
8. “Impact of Construction Site Run-Off on Water Quality and Macroinvertebrate<br />
Composition in Virginia Piedmont Streams” by Thomas D. Shahady and Cheryl<br />
Swackhammer<br />
Spatial Data<br />
1. Total Maximum Daily Load study.<br />
2. Bedford County GIS Department.<br />
3. Campbell County GIS Department.<br />
4. City of <strong>Lynchburg</strong> GIS Department.<br />
5. <strong>Lynchburg</strong> <strong>College</strong> Land Use Study.<br />
Water Quality Data<br />
1. DEQ water quality data as obtained from the DEQ website<br />
(www.deq.virginia.gov/watermonitoring/).<br />
2. “State of the <strong>Blackwater</strong> <strong>Creek</strong> <strong>Watershed</strong>: <strong>Blackwater</strong> <strong>Creek</strong> <strong>Watershed</strong> Initiative”<br />
June 2006 report and Access Data Base by <strong>Lynchburg</strong> <strong>College</strong> and Partners.<br />
3. <strong>Lynchburg</strong> <strong>College</strong>, Randolph-Macon Woman’s <strong>College</strong>, and Central Virginia<br />
Governors School (2000 – current).<br />
4. “Metropolitan Strategies for Protecting Water Quality in the <strong>Lynchburg</strong> Area,<br />
Citizens Water Quality Monitoring Study”, reported by the Central Virginia <strong>Plan</strong>ning<br />
District Commission (CVPDC), May 1987.<br />
5. “Student – Originated Studies Ecological and Sociological Aspects of the Proposed<br />
<strong>Blackwater</strong> <strong>Creek</strong> Park in <strong>Lynchburg</strong>, Virginia”, Sponsored by the National Science<br />
Foundation, Randolph-Macon Woman’s <strong>College</strong>, Summer, 1971.<br />
2.5 Subwatershed Delineations with rating/category<br />
For the purposes of this plan and based on CWP recommendations, the watershed was<br />
delineated into eight subwatersheds (see Map 3.1). Because the subwatershed<br />
delineations defined in the Total Maximum Daily Load study closely aligned with the<br />
committee’s expectations, it was decided to use these same logical delineations in order<br />
to provide consistency between the documents. There is one exception, a small<br />
7
<strong>Blackwater</strong> <strong>Creek</strong> <strong>Watershed</strong> <strong>Management</strong> <strong>Plan</strong><br />
subwatershed (BW-6) defined within the TMDL study was combined with the Burton<br />
<strong>Creek</strong> subwatershed (BW-5) for the purposes of this plan.<br />
The subwatersheds range in size from just over 2,000 acres (BW -9 Lower part of<br />
<strong>Blackwater</strong> <strong>Creek</strong>) to just over 12,000 acres (BW-2 Ivy <strong>Creek</strong>). The delineations are<br />
based on topography and surface water flow.<br />
Note: Four subwatersheds cross political jurisdictional lines, requiring special handling<br />
in portions of the report.<br />
2.6 <strong>Watershed</strong> Land Cover Assessment Methods<br />
<strong>Lynchburg</strong> <strong>College</strong> Study<br />
The original data for this study was compiled by:<br />
• AMEC 2004. Water quality assessment for the City of <strong>Lynchburg</strong>, Virginia.<br />
• Earth & Environmental, Inc., Chantilly, Virginia.<br />
Aggregation and analyses were conducted by <strong>Lynchburg</strong> <strong>College</strong> in 2007.<br />
For the City of <strong>Lynchburg</strong> portions of the <strong>Blackwater</strong> <strong>Creek</strong> watershed, the data<br />
represents current land use as of 2001. Spatial resolution is based on zoning and parcel<br />
sizes. 12 original categories have been aggregated into 5 for the purposes of this study.<br />
For Bedford and Cambell Counties, the data represents 1991-1993 Virginia GAP<br />
Analysis with 30 m spatial resolution (Landsat TM). For the purposes of this study, 11<br />
categories have been aggregated into 5.<br />
Bedford County<br />
Estimates were developed using Bedford County zoning and land ownership data layers.<br />
2002 aerial photography from Virginia Geographic Information Network’s Base<br />
Mapping Program was included in the analysis.<br />
Campbell County<br />
Estimates were derived through analysis of Campbell County’s Geographic Information<br />
Systems and 2002 Virginia Geographic Information Network (VGIN) imagery at<br />
http://www.vgin.state.va.us/.<br />
City of <strong>Lynchburg</strong><br />
The watershed spatial data used for this analysis came from the Virginia Department of<br />
Conservation.<br />
2.7 Impervious Surface Estimations<br />
Bedford County<br />
Current impervious cover estimates were developed using a sample of impervious<br />
surfaces per land parcel for each zoning designation within the Bedford County areas of<br />
each delineated subwatershed. These figures were then extrapolated over the entire<br />
8
<strong>Blackwater</strong> <strong>Creek</strong> <strong>Watershed</strong> <strong>Management</strong> <strong>Plan</strong><br />
Bedford County portions of those subwatersheds. The amount of impervious cover for<br />
roads within each designation was calculated using a buffer for each road centerline.<br />
These two percentages were then added for the total impervious cover for each zoning<br />
designation.<br />
Future impervious cover estimates were projected by determining total potential build-out<br />
area within each land use designation based on the Bedford County Comprehensive<br />
<strong>Plan</strong>'s 2025 Future Land Use Map. The potential build-out area for each land use<br />
designation was calculated as follows (based on potential build-out for current zoning<br />
designations which correspond to future land use areas).<br />
Table 2.1 - Bedford County – Percentages Used in Future Build out Calculations<br />
Bedford County<br />
Future Land Use Designations<br />
% of<br />
total*<br />
Agricultural/Resource Stewardship 20<br />
Commercial 90<br />
Commercial / Light Industrial 90<br />
Industrial 90<br />
Mixed Use 75<br />
Residential 50<br />
Rural Residential 50<br />
* Figures were taken from the Bedford County Zoning Ordinance and equated to the<br />
future land use designations. These figures represent the maximum potential build-out<br />
(impervious cover) for each designation.<br />
Campbell County<br />
Current impervious surface estimates were derived through analysis of Campbell<br />
County’s Geographic Information Systems and 2002 Virginia Geographic Information<br />
Network (VGIN) imagery at http://www.vgin.state.va.us/.<br />
The determination of future impervious cover assumed build-out conditions with the<br />
same level of protection as current regulations provide. For future impervious estimates,<br />
acreage by land use category was provided by Campbell County. Cappiella and Brown<br />
(2001) mean impervious cover coefficients were applied to determine a projected amount<br />
of impervious surface.<br />
City of <strong>Lynchburg</strong><br />
The watershed spatial data used for this analysis came from the Virginia Department of<br />
Conservation. Spatial data for impervious surface features was digitized from aerial<br />
photography. This data was last updated in 2003. The impervious surface features used in<br />
this analysis include: basketball courts, back of curb, building areas, concrete ditches,<br />
driveways, paved parking, public sidewalks, street centerlines, and tennis courts. The<br />
zoning spatial data used for this analysis came from the zoning feature class in the city’s<br />
GIS database.<br />
9
<strong>Blackwater</strong> <strong>Creek</strong> <strong>Watershed</strong> <strong>Management</strong> <strong>Plan</strong><br />
The city was divided into 5 categories based on zoning classification. These 5 categories<br />
include: Low-Density Residential, High-Density Residential, Commercial, Conservation<br />
District, and Roads. The Roads category was created because, as public right of way,<br />
most of the city’s streets are not contained within zoning districts. Below is a table<br />
detailing the zoning districts used by the City of <strong>Lynchburg</strong>.<br />
Current impervious surface features was calculated using two methods. If the feature was<br />
stored in the city’s GIS database as an area, the total area was calculated within the GIS<br />
software. However, most of the impervious surface features used in the analysis is stored<br />
within the city’s GIS database as linear features. In order to calculate area for these<br />
features, the total length of the feature was multiplied by the standard width for the<br />
feature. Below is a table outlining the features used in the analysis and the means by<br />
which the area was calculated.<br />
Table 2.2. Feature Analysis for City of <strong>Lynchburg</strong> Current Impervious Surface<br />
estimates (City of <strong>Lynchburg</strong>).<br />
Feature<br />
Width<br />
(ft)<br />
Comments<br />
Primary Roads 40<br />
Secondary<br />
Roads<br />
30<br />
Residential<br />
20 Road designations of Primary, Secondary etc. came<br />
Roads<br />
from our snow route mapping categories. For each type<br />
Private Roads 20 of road the total length was added up. The roads were<br />
4 Wheel Drive<br />
then assigned a width appropriate for the class of road.<br />
15<br />
Roads<br />
VDOT Primary 40<br />
VDOT Other 20<br />
Sidewalks 5<br />
Sidewalks are shown as single lines in our GIS<br />
and were multiplied by 5' width for an area.<br />
Paved Parking<br />
Area Feature in GIS<br />
N/A<br />
Areas<br />
Buildings N/A Area Feature in GIS<br />
Driveways are shown as lines in our GIS and often go<br />
around the driveway on both sides. To get a best<br />
Driveways 5<br />
estimate we divided the standard driveway width of 10<br />
by half and used 5' as a multiplier for the driveway area.<br />
Tennis Courts N/A Converted to Area Feature in GIS<br />
Basketball<br />
Converted to Area Feature in GIS<br />
N/A<br />
Courts<br />
Concrete<br />
Standard Width for Concrete Ditches<br />
3.5<br />
Ditches<br />
The determination of future impervious cover assumed build-out conditions with the<br />
same level of protection as current regulations provide. The City of <strong>Lynchburg</strong> provided<br />
projected data, with the amount of land that is expected to fall within each land use<br />
category. Cappiella and Brown (2001) mean impervious cover coefficients were applied<br />
to determine a projected amount of impervious surface.<br />
10
<strong>Blackwater</strong> <strong>Creek</strong> <strong>Watershed</strong> <strong>Management</strong> <strong>Plan</strong><br />
2.8 Water Quality<br />
The Virginia Department of Environmental Quality (DEQ) routinely monitors for<br />
bacteria and nutrients, as well as the physical conditions of the water (temperature, pH,<br />
dissolved oxygen). Several monitoring stations are located within the <strong>Blackwater</strong> <strong>Creek</strong><br />
watershed. The Commonwealth of Virginia has established water quality standards in<br />
order to protect designated uses in streams and rivers throughout the state. E. coli<br />
bacteria are sampled to determine whether or not the recreation use can be supported.<br />
The Commonwealth is currently in the process of determining appropriate criteria for<br />
nutrients, such as nitrogen and phosphorous. These criteria will show whether or not the<br />
aquatic life use is supported.<br />
<strong>Lynchburg</strong> <strong>College</strong> Freshwater Ecology classes have developed water chemistry data for<br />
six sites distributed throughout the watershed. Collected water samples are used to<br />
measure and record several parameters including pH, dissolved oxygen, conductivity,<br />
temperature, nitrate, total phosphorus, and turbidity. Data has been collected from 2000<br />
to present.<br />
2.9 Biological Data<br />
The Virginia DEQ has several sampling locations within the <strong>Blackwater</strong> <strong>Creek</strong> watershed<br />
in which biological assessments have been completed. The initial assessments were<br />
completed in spring 2007 and follow-up visits will be completed in fall 2007.<br />
In <strong>Lynchburg</strong> <strong>College</strong> Freshwater Ecology student studies, changes in biological<br />
assessments have been examined from year 2000 to present within several portions of the<br />
watershed. Macro invertebrates were sampled in identified riffle sections in each stream<br />
using a Hess sampler. Three replicate samples were taken throughout the riffle pooling<br />
the samples into one composite sample. Samples were preserved in alcohol (Standards<br />
Methods 1998) and examined under microscopes and enumerated in laboratories.<br />
Organisms were identified to the lowest possible classification using Voshell (2002).<br />
Fish were sampled using a Smith Root Electofishing Unit in each stream for a 30 minute<br />
interval. Pools and riffles were swept with the unit and all fish collected and identified<br />
on site using Rohde et. al. (1994).<br />
2.10 Public Involvement<br />
Networking<br />
The Greater <strong>Lynchburg</strong> Environmental Network (GLEN): an association of individuals<br />
and groups working to secure environmental quality in Central Virginia, including the<br />
counties of Amherst, Appomattox, Bedford and Campbell and the cities of Bedford and<br />
<strong>Lynchburg</strong>. GLEN’s mission is to promote an environmentally aware and sustainable<br />
11
<strong>Blackwater</strong> <strong>Creek</strong> <strong>Watershed</strong> <strong>Management</strong> <strong>Plan</strong><br />
community in the Central Virginia ecosystem through education, advocacy, coordination,<br />
and collaboration among individuals and groups concerned with the quality of the<br />
environment (GLEN web site).<br />
Interested Citizens Database: <strong>Lynchburg</strong> <strong>College</strong> has gathered contact information at<br />
public meetings for citizens interested in receiving environmental news for the<br />
<strong>Blackwater</strong> <strong>Creek</strong> watershed. This database has been used to notify citizens of public<br />
meetings and to provide attachments and links to information.<br />
Meetings / Forums<br />
2/22/2007 Environmental Forum, sponsored by <strong>Lynchburg</strong> <strong>College</strong><br />
4/26/2007 Bedford Chamber After Hours at Claytor Nature Center<br />
5/3/2007 TMDL Public Meeting<br />
7/18/2007 Greater <strong>Lynchburg</strong> Environmental Network Environmental Forum<br />
8/15/2007 Greater <strong>Lynchburg</strong> Environmental Network Environmental Forum<br />
9/19/2007 Greater <strong>Lynchburg</strong> Environmental Network Environmental Forum<br />
12
<strong>Blackwater</strong> <strong>Creek</strong> <strong>Watershed</strong> <strong>Management</strong> <strong>Plan</strong><br />
Section 3: Existing Conditions<br />
3.1 General<br />
<strong>Blackwater</strong> <strong>Creek</strong> <strong>Watershed</strong> is in the Piedmont Region of Virginia, within the southcentral<br />
part of the state. Located in the foothills of the Blue Ridge Mountains, it is<br />
bordered to the north by the James River and represents an area of transition between<br />
mountains and lower lands.<br />
Much of the watershed consists of beautiful rolling hills and low areas within stream<br />
valleys. The City of <strong>Lynchburg</strong> is well developed and very urbanized with gently rolling<br />
to rolling topography. The Campbell County portion of the watershed is closely aligned<br />
with the City of <strong>Lynchburg</strong>, with similar characteristics of rolling hills and streams with<br />
significant commercial development pressure. Bedford County is rolling with less<br />
existing urbanization. Currently, large portions of Bedford County consist of crop lands,<br />
meadows, and wooded areas.<br />
The climate is a temperate climate with long growing seasons, frost during the winter<br />
months, and warm summers. The mean annual temperature is 56°F, with January’s<br />
average temperature being 35°F and July’s average temperature being 76°F. Average<br />
annual precipitation is 38.27 inches. Average annual snowfall is 18.3 inches (<strong>Lynchburg</strong><br />
Regional Chamber). During the summer months, thunderstorms often occur during the<br />
warmest period of the day, at about 4:00 p.m.<br />
Landforms are underlain primarily with metamorphic rock formations and to a lesser<br />
extent with sedimentary and igneous rock formations. Many of the soils are a result of<br />
these rock formations weathering (USDA 1977). The soils found in the <strong>Blackwater</strong><br />
<strong>Creek</strong> watershed tend to be fine-textured.<br />
Currently, an estimated 36 percent of the <strong>Blackwater</strong> <strong>Creek</strong> <strong>Watershed</strong> land cover is<br />
forest (<strong>Lynchburg</strong> <strong>College</strong> GIS data), consisting of mostly pine and hardwood. The<br />
amount of forested land cover is decreasing with development pressures. The woodlands<br />
are developing into urban and suburban land cover.<br />
The <strong>Blackwater</strong> <strong>Creek</strong> watershed stream ecosystems are changing. The effects of urban<br />
development are physical, chemical, and biological (Sprague et al. 2006). With large<br />
areas of land disturbing activities (primarily construction) and increasing amounts of<br />
imperious surface, rainfall is not infiltrating at the same rate with increased runoff. These<br />
runoff waters carry contaminates such as sediment, nutrients, bacteria, pesticides<br />
fertilizer, and other types into the streams. The urban sources for these contaminates<br />
include parking lots and roads, construction sites, and private home owners.<br />
13
<strong>Blackwater</strong> <strong>Creek</strong> <strong>Watershed</strong> <strong>Management</strong> <strong>Plan</strong><br />
The <strong>Blackwater</strong> <strong>Creek</strong> watershed is experiencing many changes in stream conditions.<br />
These include:<br />
1. Alteration of stream flow with more rapid rise and fall of stream levels,<br />
2. Erosion of stream banks,<br />
3. Higher peak flows,<br />
4. Less vegetation on the stream banks,<br />
5. Loss of stream canopy cover,<br />
6. Increased concentrations of chemicals, and<br />
7. Changes in habitat and diversity of aquatic species.<br />
14
<strong>Blackwater</strong> <strong>Creek</strong> <strong>Watershed</strong> <strong>Management</strong> <strong>Plan</strong><br />
3.2 Subwatershed Details<br />
Map 3.1. Subwatershed Delineations<br />
For the purposes of this plan and based on CWP recommendations, the watershed has<br />
been delineated into eight subwatersheds. Because the subwatershed delineations defined<br />
in the Total Maximum Daily Load study closely aligned with the committee’s<br />
expectations, it was decided to use these same logical delineations in order to provide<br />
consistency between studies. However, for the purposes of the watershed plan, one small<br />
subwatershed (BW-6) defined within the TMDL study was combined with the Burton<br />
<strong>Creek</strong> subwatershed (BW-5).<br />
The subwatersheds range in size from just over 2,000 acres to just over 12,000 acres.<br />
Because delineations are based on topography and surface water flow, four<br />
subwatersheds cross political jurisdictional lines.<br />
15
<strong>Blackwater</strong> <strong>Creek</strong> <strong>Watershed</strong> <strong>Management</strong> <strong>Plan</strong><br />
3.2.1 Subwatershed BW-1 Upper Ivy<br />
Map 3.2. BW-1 Upper Ivy Subwatershed<br />
General Characteristics: Drainage Area: 8882.3 Acres<br />
Estimated Human Population: 2,943<br />
(Virginia DEQ TMDL 3.19)<br />
Land Use and Stream Classification:<br />
Current Subwatershed Classification: Sensitive (0 – 10% Impervious)<br />
Current Impervious Cover: 135.6 Acres<br />
Current Impervious Cover %: 1.52<br />
Current Water Quality: Good<br />
Family Biotic Index (FBI): 3.952<br />
Species Richness: 22<br />
Ephemeroptera, Plecoptera, Trichoptera (EPT) Richness: 15<br />
Future Impervious Cover Estimate: 3,910.0 Acres<br />
Future Impervious Cover % Estimate: 44.02<br />
Table 3.1. BW-1 Current Land Use (LC Study)<br />
Current Land Use Acres Percent<br />
Agricultural 3,697.8 42.1<br />
Forest 4,683.6 53.3<br />
Commercial 407.0 4.6<br />
Residential
<strong>Blackwater</strong> <strong>Creek</strong> <strong>Watershed</strong> <strong>Management</strong> <strong>Plan</strong><br />
0%<br />
5%<br />
0%<br />
42%<br />
53%<br />
Forest<br />
Agriculture<br />
Commercial<br />
High Residential<br />
Residential<br />
Figure 3.1. BW-1 Pie Chart of Current Land Use (LC Study).<br />
Table 3.2. BW-1 Current Land Use by Bedford County Zoning<br />
Bedford County<br />
Current Zoning<br />
Acres Est. %<br />
Imperv.<br />
Est. Imperv.<br />
Acres<br />
Agricultural / Rural Preserve (AP) 1,848.1 .32 5.9<br />
Agricultural / Residential (AR) 1,590.4 .29 4.6<br />
<strong>Plan</strong>ned Residential Development (PRD) 1,796.8 .93 16.7<br />
Low Density Residential (R-1) 3,319.4 .10 3.3<br />
Medium Density Residential (R-2) 312.9 33.60 105.1<br />
Office (C-1) 3.5<br />
<strong>Plan</strong>ned Commercial Development (PCD) 2.1<br />
<strong>Plan</strong>ned Industrial Development (PID) 9.2<br />
Total 8,882.4 1.52 135.6<br />
Future Land Use: Maximum Potential Impervious Cover: 3,910.1 acres<br />
Table 3.3. BW-1 Build-out Potential as provided by Bedford County<br />
Bedford County<br />
Future Land Use Categories<br />
Total<br />
Area<br />
% Potential<br />
Build-Out<br />
Total Potential<br />
Build-Out in<br />
Acres<br />
Acres<br />
Agricultural/Resource Stewardship 1,810.7 20.00 362.2<br />
Industrial 12.6 90.00 11.4<br />
Mixed Use 27.8 75.00 20.8<br />
Residential 4,309.9 50.00 2,155.0<br />
Rural Residential 2,721.4 50.00 1,360.7<br />
Total 8,882.4 44.00 3,910.1<br />
Notes: This subwatershed has less impervious surface and development impact than all<br />
others in the <strong>Blackwater</strong> <strong>Creek</strong> watershed. Water quality is good. However, large<br />
agricultural tracts are continuing to be turned over to residential development. It is<br />
critical to protect land areas when considering development. The focuses of planning for<br />
BW-1 are preservation by protecting the natural environment through regulation of<br />
development and land conservation.<br />
17
<strong>Blackwater</strong> <strong>Creek</strong> <strong>Watershed</strong> <strong>Management</strong> <strong>Plan</strong><br />
3.2.2 Subwatershed BW-2 Middle Ivy<br />
Map 3.3. BW-2 Middle Ivy Subwatershed<br />
General Characteristics: Drainage Area: 12,222.6 Acres<br />
Estimated Human Population: 8,269<br />
(Virginia DEQ TMDL 3.19)<br />
Current Land Use and Stream Classification:<br />
Current Subwatershed Classification: Sensitive (0 – 10% Impervious)<br />
Current Impervious Cover: 439.1 Acres<br />
Current Impervious Cover %: 3.6<br />
Current Water Quality: Good<br />
Family Biotic Index (FBI): 6.704<br />
Species Richness: 12<br />
Ephemeroptera, Plecoptera, Trichoptera (EPT) Richness: 6<br />
Future Impervious Cover Estimate: 5,377.4 Acres<br />
Future Impervious Cover % Estimate: 44.00<br />
Table 3.4. BW-2 Current Land Use (LC Study)<br />
Current Land Use Acres Percent<br />
Agricultural 4,224.5 34.7<br />
Forest 5,505.1 45.2<br />
Commercial 1,730.6 14.2<br />
Residential 718.1 5.9<br />
18
<strong>Blackwater</strong> <strong>Creek</strong> <strong>Watershed</strong> <strong>Management</strong> <strong>Plan</strong><br />
14%<br />
0% 6% Forest<br />
35%<br />
45%<br />
Agriculture<br />
Commercial<br />
High Residential<br />
Residential<br />
Figure 3.2. BW-2 Pie Chart of Current Land Use (LC Study).<br />
Table 3.5 BW-2 Current Land Use for Bedford County Portion, as Reported by<br />
Bedford County<br />
Bedford County<br />
Acres Est. %<br />
Est. Imperv.<br />
Acres<br />
Current Zoning<br />
Imperv.<br />
Agricultural / Rural Preserve (AP) 5.9<br />
Agricultural / Residential (AR) 196.3 0.12 .2<br />
<strong>Plan</strong>ned Residential Development (PRD) 1,989.5 1.39 27.7<br />
Low Density Residential (R-1) 4,787.9 0.81 38.8<br />
Medium Density Residential (R-2) 1.1<br />
Medium Density Multi-Family Res. (R-3) 48.6<br />
Office (C-1) 184.5 6.21 11.5<br />
General Commercial (C-2) 130.0 19.02 24.7<br />
<strong>Plan</strong>ned Commercial Development (PCD) 1,172.2 2.93 34.3<br />
<strong>Plan</strong>ned Development District (PD-1) 83.3 1.57 1.3<br />
<strong>Plan</strong>ned Industrial Development (PID) 10.9 6.42 7.0<br />
Total 8,610.2 1.69 145.5<br />
Table 3.6 BW-2 Current Land Use for City of <strong>Lynchburg</strong> Portion, as Reported by<br />
the City of <strong>Lynchburg</strong><br />
City of <strong>Lynchburg</strong><br />
Acres Est. %<br />
Est. Imperv.<br />
Acres<br />
Current Zoning<br />
Imperv.<br />
Low Density Residential 2,092.8 3.67 76.8<br />
High Density Residential 51.2 12.50 6.4<br />
Commercial 887.2 9.94 88.2<br />
Conservation District 297.7 .65 1.9<br />
Roads 279.8 43.01 120.3<br />
Total 3,608.7 8.14 293.6<br />
19
<strong>Blackwater</strong> <strong>Creek</strong> <strong>Watershed</strong> <strong>Management</strong> <strong>Plan</strong><br />
Future Land Use: Maximum Potential Impervious Cover: 5,398.3 Acres<br />
Table 3.7 BW-2 Build-out Potential for Bedford County<br />
Bedford County<br />
Future Land Use Categories<br />
Total Area<br />
Acres<br />
% Potential<br />
Build-Out<br />
Total Potential<br />
Build-Out in<br />
Acres<br />
Agricultural/Resource Stewardship 801.5 20.00 160.3<br />
Industrial 0.00 90.00 0.00<br />
Mixed Use 1,296.2 75.00 972.2<br />
Residential 4,613.3 50.00 2,306.6<br />
Rural Residential 1,899.3 50.00 949.7<br />
Total 8,610.2 60.00 4,388.7<br />
Table 3.8. BW-2 Build-out Potential for City of <strong>Lynchburg</strong><br />
City of <strong>Lynchburg</strong><br />
Future Land Use Categories<br />
Total Area<br />
Acres<br />
% Potential<br />
Build-Out *<br />
Total Potential<br />
Build-Out in<br />
Acres<br />
Low Density Residential 1,984.0 14.30 283.7<br />
High Density Residential 19.2 40.90 7.9<br />
Commercial 787.2 72.20 568.4<br />
Conservation District 544.0 1.90 10.3<br />
Roads 275.2 ** 43.01 118.4<br />
Total 3,609.6 27.39 988.7<br />
* (Cappiella & Brown 2001).<br />
** Used City of <strong>Lynchburg</strong> current impervious percentage for “Roads” category.<br />
Conservation Areas:<br />
Bedford County has 683.99 acres in conservation easements.<br />
The City of <strong>Lynchburg</strong> has 297.7 acres preserved in the conservation district.<br />
Notes: While much of this subwatershed is still agriculture and forest, the subwatershed<br />
is experiencing great development pressure. Water quality and general environmental<br />
health is still good. It is critical to protect land areas when considering development.<br />
The focuses of planning for BW-2 are preservation by protecting the natural environment<br />
through regulation of development and land conservation.<br />
20
<strong>Blackwater</strong> <strong>Creek</strong> <strong>Watershed</strong> <strong>Management</strong> <strong>Plan</strong><br />
3.2.3 Subwatershed BW-3 Lower Ivy<br />
Map 3.4. BW-3 Lower Ivy Subwatershed<br />
General Characteristics: Drainage Area: 2,840.7 Acres<br />
Estimated Human Population: 5,680<br />
(Virginia DEQ TMDL 3.19)<br />
Current Land Use and Stream Classification:<br />
Current Subwatershed Classification: Impacted (11 - 25% Impervious)<br />
Current Impervious Cover: 389.4 Acres<br />
Current Impervious Cover %: 13.69<br />
Current Water Quality: Poor<br />
Family Biotic Index (FBI): 5.839<br />
Species Richness: 13<br />
Ephemeroptera, Plecoptera, Trichoptera (EPT) Richness: 9<br />
Future Impervious Cover Estimate: 509.4 Acres<br />
Future Impervious Cover % Estimate: 17.93<br />
Table 3.9. BW-3 Current Land Use (LC Study)<br />
Current Land Use Acres Percent<br />
Agricultural 131.7 4.7<br />
Forest 808.8 28.6<br />
Commercial 144.5 5.1<br />
Residential 1,743.5 61.7<br />
21
<strong>Blackwater</strong> <strong>Creek</strong> <strong>Watershed</strong> <strong>Management</strong> <strong>Plan</strong><br />
60%<br />
29%<br />
5%<br />
5%<br />
1%<br />
Forest<br />
Agriculture<br />
Commercial<br />
High Residential<br />
Residential<br />
Figure 3.3. BW-3 Pie Chart of Current Land Use (LC Study).<br />
Table 3.10. BW-3 Current Land Use for City of <strong>Lynchburg</strong>, as Reported by the<br />
City of <strong>Lynchburg</strong><br />
City of <strong>Lynchburg</strong><br />
Acres Est. %<br />
Est. Imperv.<br />
Acres<br />
Current Zoning<br />
Imperv.<br />
Low Density Residential 2,297.6 10.31 236.8<br />
High Density Residential 57.6 33.33 19.2<br />
Commercial 67.2 48.55 32.6<br />
Conservation District 182.8 0.39 .7<br />
Roads 239.4 41.83 100.1<br />
Total 2,844.6 13.69 389.4<br />
Future Land Use: Maximum Potential Impervious Cover: 509.4 Acres<br />
Table 3.11. BW-3 Build-out Potential for City of <strong>Lynchburg</strong><br />
City of <strong>Lynchburg</strong><br />
Future Land Use Categories<br />
Total Area<br />
Acres<br />
% Potential<br />
Build-Out *<br />
Total Potential<br />
Build-Out in<br />
Acres<br />
Low Density Residential 2,003.2 14.30 286.5<br />
High Density Residential N/A 40.90 0.0<br />
Commercial 160.0 72.20 115.5<br />
Conservation District 441.6 1.90 8.4<br />
Roads 236.8 **41.83 99.1<br />
Total 2,841.6 17.93 509.4<br />
* (Cappiella & Brown 2001).<br />
** Used City of <strong>Lynchburg</strong> current impervious percentage for “Roads” category.<br />
Conservation Areas:<br />
The City of <strong>Lynchburg</strong> has 182.8 acres preserved in the conservation district.<br />
Notes: Urbanization is heavy with a lot of impervious surface. Greater stream flows are<br />
altering streams with channel widening and erosion. Some stream banks are unstable.<br />
Biodiversity is declining. The primary focus for this subwatershed is to reduce pollutant<br />
sources (non-point), protect streams from further degradation, and to restore impacted<br />
streams.<br />
22
<strong>Blackwater</strong> <strong>Creek</strong> <strong>Watershed</strong> <strong>Management</strong> <strong>Plan</strong><br />
3.2.4 Subwatershed BW-4 Dreaming<br />
Descriptive Narrative: The buffers are<br />
mostly poor at the headwaters, and<br />
improving in quality to suboptimal as the<br />
creek approaches <strong>Blackwater</strong> <strong>Creek</strong>. The<br />
substrate is made up entirely of sediment.<br />
Many of the banks are unstable, with large<br />
amounts of undercuts and many vertical<br />
bank walls, with little to no vegetation.<br />
The channel runs through culverts under<br />
residential roads and major highways.<br />
Map 3.5. BW-4 Dreaming Subwatershed<br />
General Characteristics: Drainage Area: 2802.4 Acres<br />
Estimated Human Population: 5,008<br />
(Virginia DEQ TMDL 3.59)<br />
Current Land Use and Stream Classification:<br />
Current Subwatershed Classification: Impacted (11 – 25% Impervious)<br />
Current Impervious Cover: 433.1 Acres<br />
Current Impervious Cover %: 15.45<br />
Current Water Quality: Poor<br />
Family Biotic Index (FBI): 7.778<br />
Species Richness: 3<br />
Ephemeroptera, Plecoptera, Trichoptera (EPT) Richness: 0<br />
Future Impervious Cover Estimate: 783.3 Acres<br />
Future Impervious Cover % Estimate: 27.95<br />
Table 3.12. BW-4 Current Land Use (LC Study)<br />
Current Land Use Acres Percent<br />
Agricultural 472.3 16.9<br />
Forest 546.2 19.6<br />
Commercial 703.7 25.2<br />
Residential 1,066.6 38.2<br />
23
<strong>Blackwater</strong> <strong>Creek</strong> <strong>Watershed</strong> <strong>Management</strong> <strong>Plan</strong><br />
20%<br />
36%<br />
2%<br />
25%<br />
17%<br />
Forest<br />
Agriculture<br />
Commercial<br />
High Residential<br />
Residential<br />
Figure 3.4. BW-4 Pie Chart of Current Land Use (LC Study).<br />
Table 3.13. BW-4 Current Land Use for Campbell County Portion, as Reported by<br />
the Campbell County<br />
Campbell County<br />
Acres Est. %<br />
Est. Imperv.<br />
Acres<br />
Current Zoning<br />
Imperv.<br />
Business 103.2 71.69 74.0<br />
Industrial 55.2 5.72 3.2<br />
Residential 433.4 5.62 24.4<br />
Total 591.8 17.2 101.6<br />
Table 3.14. BW-4 Current Land Use for City of <strong>Lynchburg</strong> Portion, as Reported<br />
by the City of <strong>Lynchburg</strong><br />
City of <strong>Lynchburg</strong><br />
Current Zoning<br />
Acres Est. %<br />
Imperv.<br />
Est. Imperv.<br />
Acres<br />
Low Density Residential 1,248.0 8.21 102.4<br />
High Density Residential 160.0 12.00 19.2<br />
Commercial 377.2 30.68 115.7<br />
Conservation District 105.6 0.45 .5<br />
Roads 272.6 34.38 93.7<br />
Total 2,163.4 15.32 331.5<br />
Future Land Use: Maximum Potential Impervious Cover: 783.3 Acres<br />
Table 3.15. BW-4 Build-out Potential for Campbell County<br />
Campbell County<br />
Future Land Use Categories<br />
Total Area<br />
Acres<br />
% Potential<br />
Build-Out *<br />
Total Potential<br />
Build-Out in<br />
Acres<br />
Business 103.2 72.20 74.5<br />
Industrial 55.2 53.40 29.5<br />
Residential 433.4 14.30 62.0<br />
Total 591.8 28.05 166.0<br />
* (Cappiella & Brown 2001).<br />
24
<strong>Blackwater</strong> <strong>Creek</strong> <strong>Watershed</strong> <strong>Management</strong> <strong>Plan</strong><br />
Table 3.16. BW-4 Build-out Potential for City of <strong>Lynchburg</strong><br />
City of <strong>Lynchburg</strong><br />
Future Land Use Categories<br />
Total Area<br />
Acres<br />
% Potential<br />
Build-Out *<br />
Total Potential<br />
Build-Out in<br />
Acres<br />
Low Density Residential 1,216.0 14.30 173.9<br />
High Density Residential 44.8 40.90 18.3<br />
Commercial 396.8 72.20 286.5<br />
Conservation District 243.2 1.90 46.2<br />
Roads 268.8 **34.38 92.4<br />
Total 2,169.6 28.45 617.3<br />
* (Cappiella & Brown 2001).<br />
** Used City of <strong>Lynchburg</strong> current impervious percentage for “Roads” category.<br />
Notes: Urbanization is heavy with a lot of impervious surface. Greater stream flows are<br />
altering streams with channel widening and erosion. Some stream banks are unstable.<br />
Biodiversity is declining. The primary focus for this subwatershed is to reduce pollutant<br />
sources (non-point), protect streams from further degradation, and to restore impacted<br />
streams.<br />
25
<strong>Blackwater</strong> <strong>Creek</strong> <strong>Watershed</strong> <strong>Management</strong> <strong>Plan</strong><br />
3.2.5 Subwatershed BW-5 Burton<br />
Map 3.6. BW-5 Burton Subwatershed<br />
Descriptive Narrative: The channel runs<br />
in and out of housing, and through culvert<br />
systems under major highway. Sewer<br />
pipes run parallel, at times entering or<br />
crossing the channel when moving under<br />
and through the culvert systems. The<br />
stream is heavy with sediment. Large<br />
deposits are present. The lower portion of<br />
the stream (Rock Castle <strong>Creek</strong>) travels<br />
through highly developed areas of<br />
shopping centers and highways, with<br />
vertical, unstable stream banks, large<br />
undercuts, and channelization.<br />
General Characteristics: Drainage Area: 3,812.3 Acres<br />
Estimated Human Population: 8,944<br />
(Virginia DEQ TMDL 3.59)<br />
Current Land Use and Stream Classification:<br />
Current Subwatershed Classification: Impacted (11 – 25% Impervious)<br />
Current Impervious Cover: 837.1 Acres<br />
Current Impervious Cover %: 21.96<br />
Current Water Quality: Poor<br />
Family Biotic Index (FBI): 7.699<br />
Species Richness: 6<br />
Ephemeroptera, Plecoptera, Trichoptera (EPT) Richness: 2<br />
Future Impervious Cover Estimate: 1,339.5 Acres<br />
Future Impervious Cover % Estimate: 35.14<br />
Table 3.17. BW-5 Current Land Use (LC Study)<br />
Current Land Use Acres Percent<br />
Agricultural 256.3 6.9<br />
Forest 872.7 23.3<br />
Commercial 1,350.2 36.1<br />
Residential 1,261.4 33.7<br />
26
<strong>Blackwater</strong> <strong>Creek</strong> <strong>Watershed</strong> <strong>Management</strong> <strong>Plan</strong><br />
23%<br />
31% Forest<br />
Agriculture<br />
Commercial<br />
7%<br />
High Residential<br />
2%<br />
Residential<br />
37%<br />
Figure 3.5. BW-5 Pie Chart of Current Land Use (LC Study).<br />
Table 3.18. BW-5 Current Land Use for Campbell County Portion, as Reported by<br />
the Campbell County<br />
Campbell County<br />
Acres Est. %<br />
Est. Imperv.<br />
Acres<br />
Current Zoning<br />
Imperv.<br />
Business 496.1 24.31 120.6<br />
Industrial 73.9 15.27 11.3<br />
Residential 226.6 10.07 22.8<br />
Total 796.6 19.4 154.7<br />
Table 3.19. BW-5 Current Land Use for City of <strong>Lynchburg</strong> Portion, as Reported by<br />
the City of <strong>Lynchburg</strong><br />
City of <strong>Lynchburg</strong><br />
Current Zoning<br />
Acres Est. %<br />
Imperv.<br />
Est. Imperv.<br />
Acres<br />
Low Density Residential 1,260.8 11.17 140.8<br />
High Density Residential 134.4 19.05 25.6<br />
Commercial 877.5 39.15 343.6<br />
Conservation District 95.7 1.33 1.3<br />
Roads 524.4 32.63 171.1<br />
Total 2,892.8 23.59 682.4<br />
Future Land Use: Maximum Potential Impervious Cover: 1,339.5 Acres<br />
Table 3.20. BW-5 Build-out Potential for Campbell County<br />
Campbell County<br />
Future Land Use Categories<br />
Total Area<br />
Acres<br />
% Potential<br />
Build-Out *<br />
Total Potential<br />
Build-Out in<br />
Acres<br />
Business 496.1 72.20 358.2<br />
Industrial 73.9 53.40 39.5<br />
Residential 226.6 14.30 32.4<br />
Total 796.6 54.00 430.1<br />
* (Cappiella & Brown 2001).<br />
27
<strong>Blackwater</strong> <strong>Creek</strong> <strong>Watershed</strong> <strong>Management</strong> <strong>Plan</strong><br />
Table 3.21. BW-5 Build-out Potential for City of <strong>Lynchburg</strong><br />
City of <strong>Lynchburg</strong><br />
Future Land Use Categories<br />
Total Area<br />
Acres<br />
% Potential<br />
Build-Out *<br />
Total Potential<br />
Build-Out in<br />
Acres<br />
Low Density Residential 1,004.8 14.30 143.7<br />
High Density Residential 32.0 40.90 13.1<br />
Commercial 793.6 72.20 573.0<br />
Conservation District 332.8 1.90 6.3<br />
Roads 531.2 **32.63 173.3<br />
Total 2,694.4 33.75 909.4<br />
* (Cappiella & Brown 2001).<br />
** Used City of <strong>Lynchburg</strong> current impervious percentage for “Roads” category.<br />
Conservation Areas:<br />
The City of <strong>Lynchburg</strong> has 95.7 acres preserved in the conservation district.<br />
Notes: Urbanization is heavy with a lot of impervious surface. Greater stream flows are<br />
altering streams with channel widening and erosion. Some stream banks are unstable.<br />
Biodiversity is declining. The primary focus for this subwatershed is to reduce pollutant<br />
sources (non-point), protect streams from further degradation, and to restore impacted<br />
streams.<br />
28
<strong>Blackwater</strong> <strong>Creek</strong> <strong>Watershed</strong> <strong>Management</strong> <strong>Plan</strong><br />
3.2.6 Subwatershed BW-7 Tomahawk<br />
Descriptive Narrative: Housing is present<br />
and there is new development. The<br />
majority of buffers have heavy tree cover<br />
and a dense under story. Most of the<br />
stream consists of sediment, but there are<br />
reaches with rock, cobble and bedrock<br />
present. Banks are stable at the top,<br />
becoming unstable downstream with tall<br />
banks, large undercuts, and very little<br />
vegetation. The stream channel runs<br />
through various sized culverts. There are<br />
some with large amounts of debris causing<br />
the redirection of flow and significant<br />
erosion.<br />
Map 3.7. BW-7 Tomahawk Subwatershed<br />
General Characteristics: Drainage Area: 5,231.1 Acres<br />
Estimated Human Population: 9,306<br />
(Virginia DEQ TMDL 3.49)<br />
Current Land Use and Stream Classification:<br />
Current Subwatershed Classification: Impacted (11 – 25% Impervious)<br />
Current Impervious Cover: 686.3 Acres<br />
Current Impervious Cover %: 13.12<br />
Current Water Quality: Moderate<br />
Future Impervious Cover Estimate: 1,877.8 Acres<br />
Future Impervious Cover % Estimate: 35.90<br />
Table 3.22. BW-7 Current Land Use (LC Study)<br />
Current Land Use Acres Percent<br />
Agricultural 1,383.8 26.7<br />
Forest 1,107.8 21.4<br />
Commercial 1,892.8 36.6<br />
Residential 792.0 15.3<br />
29
<strong>Blackwater</strong> <strong>Creek</strong> <strong>Watershed</strong> <strong>Management</strong> <strong>Plan</strong><br />
0%<br />
37%<br />
15%<br />
21%<br />
27%<br />
Forest<br />
Agriculture<br />
Commercial<br />
High Residential<br />
Residential<br />
Figure 3.6. BW-7 Pie Chart of Current Land Use (LC Study).<br />
Table 3.23. BW-7 Current Land Use for Bedford County Portion, as Reported by<br />
Bedford County<br />
Bedford County<br />
Acres Est. %<br />
Est. Imperv.<br />
Acres<br />
Current Zoning<br />
Imperv.<br />
Agricultural Rural Preserve (AP) 455.2 4.66 21.2<br />
<strong>Plan</strong>ned Residential Development (PRD) 5.3<br />
Low Density Residential (R-1) 455.9 10.97 50.0<br />
Medium Density Residential (R-2) 4.5<br />
Medium Density Multi-Family (R-3) 194.8 21.49 41.9<br />
Office (C-1) 40.5 5.53 2.2<br />
General Commercial (C-2) 252.5 34.51 87.1<br />
<strong>Plan</strong>ned Commercial Development (PCD) 1.3<br />
<strong>Plan</strong>ned Development District (PD-1) 8.3<br />
Total 1,418.22 14.27 202.4<br />
Table 3.24. BW-7 Current Land Use for Campbell County Portion, as Reported by<br />
the Campbell County<br />
Campbell County<br />
Acres Est. %<br />
Est. Imperv.<br />
Acres<br />
Current Zoning<br />
Imperv.<br />
Business 120.5 61.06 73.6<br />
Industrial 3.8 84.12 3.2<br />
Residential 946.5 9.10 86.1<br />
Total 1,070.8 15.2 162.9<br />
30
<strong>Blackwater</strong> <strong>Creek</strong> <strong>Watershed</strong> <strong>Management</strong> <strong>Plan</strong><br />
Table 3.25. BW-7 Current Land Use for City of <strong>Lynchburg</strong> Portion, as Reported by<br />
the City of <strong>Lynchburg</strong><br />
City of <strong>Lynchburg</strong><br />
Current Zoning<br />
Acres Est. %<br />
Imperv.<br />
Est. Imperv.<br />
Acres<br />
Low Density Residential 1,164.8 7.69 89.6<br />
High Density Residential 198.4 3.23 6.4<br />
Commercial 859.2 15.72 135.0<br />
Conservation District 144.0 0.26 .4<br />
Roads 255.6 35.05 89.6<br />
Total 2,622.0 12.24 321.0<br />
Future Land Use: Maximum Potential Impervious Cover: 1,877.8 Acres<br />
Table 3.26. BW-7 Build-out Potential for Bedford County<br />
Bedford County<br />
Future Land Use Categories<br />
Total Area<br />
Acres<br />
% Potential<br />
Build-Out<br />
Total Potential<br />
Build-Out in<br />
Acres<br />
Agricultural/Resource Stewardship 439.7 20.00 87.9<br />
Industrial 0.00 90.00 0.00<br />
Mixed Use 945.5 75.00 709.1<br />
Residential 33.1 50.00 16.5<br />
Rural Residential 0.00 50.00 0.00<br />
Total 1,418.3 57.40 813.5<br />
Table 3.27. BW-7 Build-out Potential for Campbell County<br />
Campbell County<br />
Future Land Use Categories<br />
Total Area<br />
Acres<br />
% Potential<br />
Build-Out *<br />
Total Potential<br />
Build-Out in<br />
Acres<br />
Business 120.5 72.20 87.0<br />
Industrial 3.8 53.40 2.0<br />
Residential 946.5 14.30 135.3<br />
Total 1,070.8 20.95 224.3<br />
* (Cappiella & Brown 2001).<br />
31
<strong>Blackwater</strong> <strong>Creek</strong> <strong>Watershed</strong> <strong>Management</strong> <strong>Plan</strong><br />
Table 3.28. BW-7 Build-out Potential for City of <strong>Lynchburg</strong><br />
City of <strong>Lynchburg</strong><br />
Future Land Use Categories<br />
Total Area<br />
Acres<br />
% Potential<br />
Build-Out *<br />
Total Potential<br />
Build-Out in<br />
Acres<br />
Low Density Residential 864 14.30 123.6<br />
High Density Residential 40.90<br />
Commercial 633.6 72.20 457.5<br />
Conservation District 403.2 1.90 7.7<br />
Roads 716.8 **35.05 251.2<br />
Total 2,617.6 32.09 840.0<br />
* (Cappiella & Brown 2001).<br />
** Used City of <strong>Lynchburg</strong> current impervious percentage for “Roads” category.<br />
Conservation Areas:<br />
The City of <strong>Lynchburg</strong> has 144 acres preserved in the conservation district.<br />
Notes: Urbanization is heavy with a lot of impervious surface. Greater stream flows are<br />
altering streams with channel widening and erosion. Some stream banks are unstable.<br />
Biodiversity is declining. The primary focus for this subwatershed is to reduce pollutant<br />
sources (non-point), protect streams from further degradation, and to restore impacted<br />
streams.<br />
32
<strong>Blackwater</strong> <strong>Creek</strong> <strong>Watershed</strong> <strong>Management</strong> <strong>Plan</strong><br />
3.2.7 Subwatershed BW-8 Middle <strong>Blackwater</strong><br />
Descriptive Narrative: Buffer systems<br />
are optimal throughout stream, with very<br />
little housing present. Wetlands and ponds<br />
are on both sides of the stream channel as it<br />
enters <strong>College</strong> Lake. The banks are<br />
unstable with large amounts of erosion.<br />
There is a moderate to large amount of<br />
sediment present, with sedimentation<br />
increasing as the stream approaches<br />
<strong>College</strong> Lake. Eventually the sediment<br />
completely overtakes the cobble and rock.<br />
Moderate to heavy amounts of debris is<br />
present. Sewer pipes run parallel to the<br />
stream channel.<br />
Map 3.8. BW-8 Middle <strong>Blackwater</strong> Subwatershed<br />
General Characteristics: Drainage Area: 3,932.6 Acres<br />
Estimated Human Population: 13,046<br />
(Virginia DEQ TMDL 3.42)<br />
Current Land Use and Stream Classification:<br />
Current Subwatershed Classification: Impacted (11 – 25% Impervious)<br />
Current Impervious Cover: 706.2 Acres<br />
Current Impervious Cover %: 17.96<br />
Current Water Quality: Moderate<br />
Future Impervious Cover Estimate: 1,188.0 Acres<br />
Future Impervious Cover % Estimate: 30.13<br />
Table 3.29. BW-8 Current Land Use (LC Study)<br />
Current Land Use Acres Percent<br />
Agricultural 87.9 2.2<br />
Forest 754.9 19.2<br />
Commercial 802.8 20.4<br />
Residential 2,280.5 58.1<br />
33
<strong>Blackwater</strong> <strong>Creek</strong> <strong>Watershed</strong> <strong>Management</strong> <strong>Plan</strong><br />
19%<br />
51%<br />
2%<br />
20%<br />
Forest<br />
Agriculture<br />
Commercial<br />
High Residential<br />
Residential<br />
8%<br />
Figure 3.7. BW-8 Pie Chart of Current Land Use (LC Study).<br />
Table 3.30. BW-8 Current Land Use as Reported by the City of <strong>Lynchburg</strong><br />
City of <strong>Lynchburg</strong><br />
Current Zoning<br />
Acres Est. %<br />
Imperv.<br />
Est. Imperv.<br />
Acres<br />
Low Density Residential 2,054.4 11.53 236.8<br />
High Density Residential 364.8 17.54 64.0<br />
Commercial 813.6 27.60 224.5<br />
Conservation District 230.7 0.74 1.7<br />
Roads 448.0 40.00 179.2<br />
Total 3,911.5 18.06 706.2<br />
Future Land Use: Maximum Potential Impervious Cover: 1,188.0<br />
Table 3.31. BW-8 Build-out Potential for City of <strong>Lynchburg</strong><br />
City of <strong>Lynchburg</strong><br />
Future Land Use Categories<br />
Total Area<br />
Acres<br />
% Potential<br />
Build-Out *<br />
Total Potential<br />
Build-Out in<br />
Acres<br />
Low Density Residential 2,054.4 14.30 293.8<br />
High Density Residential 89.6 40.90 36.6<br />
Commercial 921.6 72.20 665.4<br />
Conservation District 416.0 1.90 7.9<br />
Roads 460.8 **40.00 184.3<br />
Total 3,942.4 30.13 1,188.0<br />
* (Cappiella & Brown 2001).<br />
** Used City of <strong>Lynchburg</strong> current impervious percentage for “Roads” category.<br />
Conservation Areas:<br />
The City of <strong>Lynchburg</strong> has 230.7 acres preserved in the conservation district.<br />
Notes: Urbanization is heavy with a lot of impervious surface. Greater stream flows are<br />
altering streams with channel widening and erosion. Some stream banks are unstable.<br />
Biodiversity is declining. The primary focus for this subwatershed is to reduce pollutant<br />
sources (non-point), protect streams from further degradation, and to restore impacted<br />
streams.<br />
34
<strong>Blackwater</strong> <strong>Creek</strong> <strong>Watershed</strong> <strong>Management</strong> <strong>Plan</strong><br />
3.2.8 Subwatershed BW-9 Lower <strong>Blackwater</strong><br />
Map 3.9. BW-9 Lower <strong>Blackwater</strong> Subwatershed<br />
General Characteristics: Drainage Area: 2,180.1 Acres<br />
Estimated Human Population: 6,973<br />
(Virginia DEQ TMDL 3.42)<br />
Current Land Use and Stream Classification:<br />
Current Subwatershed Classification – Impacted (11 – 25% Impervious)<br />
Current Impervious Cover: 513.6<br />
Current Impervious Cover %: 23.56<br />
Current Water Quality: Moderate<br />
Family Biotic Index (FBI): 4.121<br />
Species Richness: 10<br />
Ephemeroptera, Plecoptera, Trichoptera (EPT) Richness: 7<br />
Future Impervious Cover Estimate: 518.4 Acres<br />
Future Impervious Cover % Estimate: 23.78<br />
Table 3.32. BW-9 Current Land Use (LC Study)<br />
Current Land Use Acres Percent<br />
Agricultural 45.0 2.1<br />
Forest 726.0 33.7<br />
Commercial 380.0 17.7<br />
Residential 1,000.9 46.5<br />
35
<strong>Blackwater</strong> <strong>Creek</strong> <strong>Watershed</strong> <strong>Management</strong> <strong>Plan</strong><br />
44%<br />
34%<br />
2%<br />
Forest<br />
Agriculture<br />
Commercial<br />
High Residential<br />
Residential<br />
2%<br />
18%<br />
Figure 3.8. BW-9 Pie Chart of Current Land Use (LC Study).<br />
Table 3.33. BW-9 Current Land Use as Reported by the City of <strong>Lynchburg</strong><br />
City of <strong>Lynchburg</strong><br />
Current Zoning<br />
Acres Est. %<br />
Imperv.<br />
Est. Imperv.<br />
Acres<br />
Low Density Residential 1,120.0 10.29 115.2<br />
High Density Residential 147.2 13.04 19.2<br />
Commercial 350.6 55.51 194.6<br />
Conservation District 167.4 1.57 2.6<br />
Roads 393.5 46.26 182.0<br />
Total 2,178.7 23.58 513.6<br />
Future Land Use: Maximum Potential Impervious Cover: 518.4 Acres<br />
Table 3.34. BW-9 Build-out Potential for City of <strong>Lynchburg</strong><br />
City of <strong>Lynchburg</strong><br />
Future Land Use Categories<br />
Total Area<br />
Acres<br />
% Potential<br />
Build-Out *<br />
Total Potential<br />
Build-Out in<br />
Acres<br />
Low Density Residential 908.8 14.30 130.0<br />
High Density Residential 108.8 40.90 44.5<br />
Commercial 236.8 72.20 171.0<br />
Conservation District 531.2 1.90 10.1<br />
Roads 352.0 **46.26 162.8<br />
Total 2,137.6 24.25 518.4<br />
* (Cappiella & Brown 2001).<br />
** Used City of <strong>Lynchburg</strong> current impervious percentage for “Roads” category.<br />
Conservation Areas:<br />
The City of <strong>Lynchburg</strong> has 167.4 acres preserved in the conservation district.<br />
Notes: Urbanization is heavy with a lot of impervious surface. Greater stream flows are<br />
altering streams with channel widening and erosion. Some stream banks are unstable.<br />
Biodiversity is declining. The primary focus for this subwatershed is to reduce pollutant<br />
sources (non-point), protect streams from further degradation, and to restore impacted<br />
streams.<br />
36
<strong>Blackwater</strong> <strong>Creek</strong> <strong>Watershed</strong> <strong>Management</strong> <strong>Plan</strong><br />
3.3 Categories / Ratings of Subwatersheds<br />
The Center for <strong>Watershed</strong> Protection (CWP) identifies three primary management<br />
categories of watersheds based on current impervious cover (CWP Do-It-Yourself 3.4).<br />
These categories are:<br />
1. Sensitive – These watersheds typically have less than 11 percent impervious<br />
cover. They are characterized by having stable channels, excellent biodiversity,<br />
and excellent water quality. The planning focus for these watersheds is<br />
preservation through preventative measures.<br />
2. Impacted – These watersheds have between 10 to 25 percent impervious cover.<br />
Impacted watersheds show unstable channels and exhibit good to fair biodiversity<br />
and water quality. They show potential for restoration and opportunities for BMP<br />
retrofits that will improve the hydrology and water quality of the streams.<br />
3. Non-supporting – These watersheds have greater than 25 percent current<br />
impervious cover. Stream bank conditions, aquatic diversity, and water quality<br />
are poor due to sedimentation, bank erosion, and elevated levels of bacteria and<br />
nutrients.<br />
The City of <strong>Lynchburg</strong> is currently 17% impervious. Much of the land has hills and<br />
steep slopes. This lends itself to extensive erosion and runoff. Many of the streams<br />
illustrate these characteristics with poor stream bank conditions, lack of biodiversity, and<br />
poor water quality due to sedimentation, stream bank erosion and elevated levels of<br />
bacteria and nutrients (Shahady and Fitzsimmons).<br />
Based on the CWP criteria (CWP Do-It-Yourself 3.4), we classify the upper Ivy <strong>Creek</strong><br />
subwatersheds BW-1 and BW-2 (see Map 3.1) as sensitive. All other subwatersheds are<br />
classified as impacted, with varying degrees of water quality, stream bank conditions, and<br />
biodiversity found and documented by local studies.<br />
In general, the further down the watershed, the more development that has occurred and<br />
the poorer the quality of the streams. In particular, Rock Castle <strong>Creek</strong>, a tributary of<br />
Burton <strong>Creek</strong> near Wards Road, is in very poor condition. Based on water quality and<br />
lack of biodiversity, one could argue that this subwatershed should be categorized as nonsupporting.<br />
3.4 Land Cover / Land Use<br />
Land cover within <strong>Blackwater</strong> <strong>Creek</strong> watershed varies. The western portion (Bedford<br />
County) is still largely forested and agricultural. The eastern portion, primarily The City<br />
of <strong>Lynchburg</strong> and Campbell County, is very urbanized, leaving little room for growth.<br />
The development within the watershed has a distinct pattern. The eastern urbanized<br />
portions are still experiencing some development and it is mostly commercial. However,<br />
development pressures are spilling into the western portions, with primarily single family<br />
residential development. Farms in this area are being purchased by developers building<br />
single family residential subdivisions.<br />
37
<strong>Blackwater</strong> <strong>Creek</strong> <strong>Watershed</strong> <strong>Management</strong> <strong>Plan</strong><br />
In general, development has been progressing west from the highly urbanized areas of the<br />
City of <strong>Lynchburg</strong>. Those areas not yet developed and adjacent to already urbanized<br />
areas are facing large development pressures. <strong>Blackwater</strong> <strong>Creek</strong> watershed has as many<br />
as 300 – 400 land disturbing activities involving hundreds of acres at a given time.<br />
During the first week of April 2006, Bedford County had 135 active land disturbing<br />
activities within <strong>Blackwater</strong> <strong>Creek</strong> watershed. That same week, the City of <strong>Lynchburg</strong><br />
had 156 active land disturbing activities within the <strong>Blackwater</strong> <strong>Creek</strong> watershed<br />
(Shahady and Fitzsimmons).<br />
In the “Building a Cleaner James River” study published January 2007 by the James<br />
River Association, the estimated population growth for each jurisdiction is as follows:<br />
Table 3.35 – Estimated Population Growth by Jurisdiction (JRA 2007)<br />
Estimated<br />
Jurisdiction Population<br />
2000<br />
Estimated<br />
Population<br />
2010<br />
Estimated<br />
Population<br />
2020<br />
Estimated<br />
Population<br />
2030<br />
Increased<br />
Population<br />
2000-2030<br />
Population<br />
Percentage<br />
Increase<br />
2000–2030<br />
Bedford 60,371 69,400 77,400 83,200 22,829 27.44<br />
Campbell 51,078 53,599 56,100 58,400 7,322 12.54<br />
<strong>Lynchburg</strong> 65,269 65,300 65,300 65,300 31 0.05<br />
The James River Association categorized these jurisdictions and gave each a score based<br />
on local development rules. These scores were created using standardized worksheets<br />
(Code and Ordinance Worksheet) with information provided by each locality. The final<br />
resulting scores of the worksheets (COW) indicate the locality’s ability to support<br />
environmentally sensitive development. See pages 59-65 for more detail concerning this<br />
study.<br />
The local development rules were compared to the James River Association’s model of<br />
development principles. According to the James River Association, scores of less than<br />
60% indicate that the development rules do not support environmentally sensitive<br />
development and a systematic reform for development rules is needed (JRA 2007).<br />
JRA assigned localities to categories based on population, growth pressure, land use and<br />
potential or existing conservation lands. Bedford and Campbell counties are viewed as<br />
urbanizing, with moderate existing development and relatively high development<br />
pressure. The City of <strong>Lynchburg</strong> falls in the urban impacted category, where the<br />
population may not be growing significantly, but there is a fair amount of existing<br />
development (JRA 2007).<br />
Table 3.36. James River Association Code and Ordinance Worksheet Final Scores<br />
(JRA 2007)<br />
Jurisdiction Category Final Score<br />
Bedford County Urbanizing 24%<br />
Campbell County Urbanizing 19%<br />
City of <strong>Lynchburg</strong> Urban Impacted 38%<br />
38
<strong>Blackwater</strong> <strong>Creek</strong> <strong>Watershed</strong> <strong>Management</strong> <strong>Plan</strong><br />
Map 3.10. <strong>Blackwater</strong> <strong>Creek</strong> <strong>Watershed</strong> Current Land Cover (<strong>Lynchburg</strong> <strong>College</strong> GIS Studies).<br />
39
<strong>Blackwater</strong> <strong>Creek</strong> <strong>Watershed</strong> <strong>Management</strong> <strong>Plan</strong><br />
3.5 Assessing the Water Quality Characteristics of Streams<br />
Aquatic biology is used often in conjunction with water chemistry to provide a good<br />
estimation of stream water quality. These measures take some expertise to obtain and in<br />
some instances are difficult to quantify between streams and over time. The advantages<br />
to this approach are that organisms are integrators of their environment. By measuring<br />
biological indicators we get a sense of the stresses that occur over time. These organisms<br />
cannot escape pollution. While chemical analysis is limited to the direct measurements<br />
taken at the time of sampling, biological measures describe conditions in the stream over<br />
long periods of time. Indices and patterns have been developed to compare stream water<br />
quality.<br />
In this assessment we have taken common indicators of water quality from the literature<br />
and personal observations to give a general assessment of stream condition in this<br />
watershed. This analysis is intended to present the reader with some scientific basis for<br />
the water quality generalizations used throughout this plan. It is not intended to present<br />
definitive characterizations of the streams. Detailed analysis and study is needed to<br />
quantify this condition.<br />
3.6 Indices of Water Quality<br />
The animals living in a stream provide the best indicators of that stream’s overall health<br />
and ecological condition. Human activities that alter a watershed and interfere with the<br />
natural processes of a stream have immediate as well as long-lasting effects on the<br />
animals that live in the stream. Both fishes and invertebrates represent an enormous<br />
diversity of body shapes, survival strategies, and adaptations. Many fish and invertebrate<br />
species require clear, cool water, adequate oxygen, stable flows, and a steady source of<br />
food in order to complete their life cycles. Others are well adapted to disturbed conditions<br />
and tend to flourish in streams impacted by silt and pollutants.<br />
Multiple indices of water quality are used for these reasons. A single index does not<br />
capture the diversity of biology in a stream reach. Each index is explained and should be<br />
taken in accordance with all others to understand water quality in this watershed.<br />
Benthic Macroinvertebrate<br />
VDEQ conducted a benthic macroinvertebrate survey in the Spring and Fall of 2007 on<br />
streams within the <strong>Blackwater</strong> <strong>Creek</strong> watershed. The resulting Virginia Stream<br />
Condition Index (SCI) scores exhibit high seasonal variability, with Spring scores being<br />
lowest. Stormwater inflows from urban areas may result in washout of available snag<br />
habitat, especially during the high flow spring months. An increase in available habitat is<br />
exhibited in the Fall when more leaves are in stream and flows are more stable. High<br />
rates of sediment deposition were observed at all monitoring sites and affect available<br />
habitat.<br />
40
<strong>Blackwater</strong> <strong>Creek</strong> <strong>Watershed</strong> <strong>Management</strong> <strong>Plan</strong><br />
The graph below shows the SCI scores from each site visited. A SCI score below 60<br />
determines whether a stream can be considered impaired during the biennial water quality<br />
assessment conducted by DEQ. The data collected in 2007 will be included in the 2010<br />
water quality assessment.<br />
80<br />
70<br />
60<br />
50<br />
SCI Score<br />
40<br />
30<br />
20<br />
10<br />
0<br />
Spring<br />
2007<br />
Fall 2007<br />
Spring<br />
2007<br />
Fall 2007<br />
Spring<br />
2007<br />
Fall 2007<br />
Spring<br />
2007<br />
Fall 2007<br />
Spring<br />
2007<br />
Fall 2007<br />
Spring<br />
2007<br />
Fall 2007<br />
Spring<br />
2007<br />
Fall 2007<br />
Burton <strong>Creek</strong> Tomahawk <strong>Creek</strong> Ivy @ Rte. 622 Ivy @ Peaks View<br />
Park<br />
Ivy upstream of<br />
<strong>Blackwater</strong><br />
confluence<br />
<strong>Blackwater</strong><br />
upstream of Ivy<br />
<strong>Creek</strong> confluence<br />
<strong>Blackwater</strong> under<br />
Rivermont<br />
Figure 3.9.<br />
Virginia Stream Condition Index by Location<br />
(Benthic Macroinvertebrate)<br />
Site-Specific Biologist Notes<br />
<strong>Blackwater</strong> <strong>Creek</strong><br />
o Upstream of Ivy <strong>Creek</strong> confluence<br />
Bedrock and hardpan clay make for less than desirable habitat<br />
Nice riparian zone<br />
o Rivermont Bridge<br />
Seems to recover somewhat downstream by the Rivermont bridge<br />
Riparian zone is excellent for an urban area upstream of this site<br />
due to the <strong>Blackwater</strong> <strong>Creek</strong> natural area<br />
Habitat here was sparse and consisted of snags and several stable<br />
rootwads<br />
This site was just upstream of the CSO point under the Rivermont<br />
bridge<br />
Ivy <strong>Creek</strong><br />
o @ Rte. 622 Hooper Rd.<br />
41
<strong>Blackwater</strong> <strong>Creek</strong> <strong>Watershed</strong> <strong>Management</strong> <strong>Plan</strong><br />
Future Monitoring<br />
Heavy sediment deposition<br />
Riffles were marginal and were supplemented by snags<br />
Recent residential development in the area is a likely source of<br />
sediment<br />
o Peaks View Park<br />
Surprising diversity considering the stream is rip-rapped in this<br />
area and sediment deposition was high. Habitat consisted of snags<br />
and rootwads.<br />
Upstream landuse is forest and pasture, becomes more residential<br />
downstream<br />
o Upstream of <strong>Blackwater</strong> <strong>Creek</strong> confluence<br />
Riffles sampled<br />
Trash and debris abundant in this reach<br />
Houses along this stretch of stream contributing large amounts of<br />
trash and debris. Likely upstream contributions as well.<br />
Future monitoring may occur twice every 3 years. This will enable four sampling events<br />
to be included in each assessment period.<br />
Fish<br />
All indices are shown across a gradient of impervious surface. This analysis is intended<br />
to demonstrate the impacts of urbanization if they exist. Other gradients are possible to<br />
explore. The impervious gradient is the only one available within our current data set and<br />
with available resources.<br />
Total number of fish species<br />
This measurement decreases with increased overall degradation of a stream channel. The<br />
number of fish species is also affected by stream size so consistency of stream size when<br />
comparing streams is important with this measurement. Reductions in total number of<br />
fish species reflect degradation from many sources of human influence (i.e.<br />
sedimentation, urbanization, toxics) so this should be used only as a general measure. In<br />
Virginia it is typical to find 2-10 species in small creeks, 15-30 species in middles-sized<br />
streams and 20-40 species in rivers (Jenkins and Burkhead 1993). In <strong>Lynchburg</strong> it<br />
appears stream size has a greater influence over species number than impervious surface.<br />
42
<strong>Blackwater</strong> <strong>Creek</strong> <strong>Watershed</strong> <strong>Management</strong> <strong>Plan</strong><br />
Total Fish Species<br />
16<br />
14<br />
Total Fish Species<br />
12<br />
10<br />
8<br />
6<br />
0 5 10 15 20 25<br />
Impervious Percentage<br />
Figure 3.10. Total Fish Species.<br />
Total Fish Number<br />
This measure reflects a deviation from ideal or number of individuals in sample. This<br />
measure is expressed as catch per unit effort, either by area, distance, or time sampled. In<br />
our sampling procedure it was over a consistent period of time. It may also be expressed<br />
as the deviation from an ideal community as measured throughout the region. Generally<br />
sites with lower integrity support fewer individuals. Abundance is not always the best<br />
measure of pollution impact and deviation from ideal provides a better measure. Here we<br />
show changes in fish number caught with changes in impervious surface. This measure<br />
does not show any predictive power and is generally unchanging over the gradient of<br />
impervious surface. Often it is the types of fish present instead of overall numbers that<br />
show impact.<br />
Fish number<br />
350<br />
300<br />
250<br />
Fish Number<br />
200<br />
150<br />
100<br />
50<br />
0<br />
0 5 10 15 20 25<br />
Impervious Cover<br />
Figure 3.11. Total Fish Number<br />
43
<strong>Blackwater</strong> <strong>Creek</strong> <strong>Watershed</strong> <strong>Management</strong> <strong>Plan</strong><br />
Percent Percids in Sample<br />
Total number of darter (Percid) species or relative percent of darter species in the total<br />
catch in a stream. This measure decreases with increasing sedimentation and decreased<br />
oxygen supply. The many darter species found in our area are benthic insectivores living<br />
in riffles and feeding primarily on mayflies, stoneflies and caddisflies found in these riffle<br />
communities. As sedimentation degrades riffle habitat, darter species begin to disappear.<br />
This measure may be used as an indicator of both sedimentation and toxic substances.<br />
This measure is a relatively good indicator of pollution with the exception of the highest<br />
impervious site below Hollins Mill dam. We believe this site is influenced more by<br />
adequate riparian buffer than the amount of impervious surface surrounding the site. This<br />
site also benefits from two impoundments and very little disturbance near this site.<br />
Nevertheless, it shows a higher level of water quality in the downtown reaches of the<br />
city.<br />
Percent Precids<br />
50<br />
40<br />
% Percids<br />
30<br />
20<br />
10<br />
0<br />
0 5 10 15 20 25<br />
Impervious Cover<br />
Figure 3.12. Percent Percids.<br />
Percent Cyprinids<br />
These species are relatively short-lived species and able to respond rapidly to environmental<br />
change. This group represents the majority of fishes in samples and can fill niches vacated by<br />
other species. We see increases in Cyprinids with increases in disturbance.<br />
Percent Cyprinids<br />
90<br />
80<br />
70<br />
% Cyprinids<br />
60<br />
50<br />
40<br />
30<br />
0 5 10 15 20 25<br />
Impervious Cover<br />
Figure 3.13. Percent Cyprinids.<br />
44
<strong>Blackwater</strong> <strong>Creek</strong> <strong>Watershed</strong> <strong>Management</strong> <strong>Plan</strong><br />
Percent Ictalurids<br />
These are long lived species and able to integrate changes from the environment into<br />
impacts. These fishes show the best indicators of environmental change and impact in<br />
this watershed.<br />
Percent Catfish<br />
4<br />
3<br />
% Catfish<br />
2<br />
1<br />
0<br />
-1<br />
0 5 10 15 20 25<br />
Impervious Cover<br />
Figure 3.14. Percent Ictalurds.<br />
Percent Sunfish<br />
Sunfish are considered water column insectivores in this analysis. This number generally<br />
decreases with the loss of riparian vegetation. This number will increase with<br />
channelization and conversion of riffle habitat as these fish are able to feed directly from<br />
the water column. Sunfish species good representatives of water column insectivores and<br />
are analyzed here. This analysis reflects channelization more than impervious surface.<br />
Percent Sunfish<br />
18<br />
16<br />
14<br />
12<br />
% sunfish<br />
10<br />
8<br />
6<br />
4<br />
2<br />
0<br />
0 5 10 15 20 25<br />
Percent Cover<br />
Figure 3.15. Percent Sunfish.<br />
45
<strong>Blackwater</strong> <strong>Creek</strong> <strong>Watershed</strong> <strong>Management</strong> <strong>Plan</strong><br />
FBI Index<br />
The Family Biotic Index is an index developed on the sensitivities of specific<br />
macroinvertebrates. Species or families of macroinvertebrates are assigned a value from<br />
0 (extremely sensitive) to 10 (very tolerant) of organic pollution. The biotic index is<br />
calculated by multiplying the tolerance value for each species by the number of<br />
individuals summing these products then dividing by the total number of individuals. A<br />
value is calculated determining the water quality of the sampled stream (Hilsenhoff<br />
1988). Water quality values based on FBI appear below:<br />
Table 3.37 – FBI / Water Quality Table<br />
Family Biotic Index Water Quality Degree of Organic Pollution<br />
0.00-3.75 Excellent Organic Pollution Unlikely<br />
3.76-4.25 Very Good Possible Slight Organic<br />
Pollution<br />
4.26-5.00 Good Some Organic Pollution<br />
Probable<br />
5.01-5.75 Fair Fairly Substantial Pollution<br />
Likely<br />
5.76-6.5 Fairly Poor Substantial Pollution Likely<br />
6.51-7.25 Poor Very Substantial Pollution<br />
Likely<br />
7.26-10 Very Poor Severe Organic Pollution<br />
FBI<br />
8<br />
7<br />
FBI Index<br />
6<br />
5<br />
4<br />
3<br />
0 5 10 15 20 25<br />
Impervious Cover<br />
Figure 3.16. FBI.<br />
Species Richness<br />
Species Richness is the total number of taxa or in this analysis families found in the<br />
sample. Greater diversity is indicative of improved water quality as loss of representative<br />
families through organic pollution reduces species numbers. It can be expected that nonimpacted<br />
streams to contain > 26 families, slightly impacted 19-26, moderately impacted<br />
11-18 and severely impacted less than 11 (Plafkin et. al. 1989). Species Richness and<br />
indicated water quality appear in Table 2.<br />
46
<strong>Blackwater</strong> <strong>Creek</strong> <strong>Watershed</strong> <strong>Management</strong> <strong>Plan</strong><br />
Indicated water quality based upon Species Richness.<br />
Table 3.38. Species Richness / Water Quality Table<br />
Species Richness<br />
Water Quality<br />
>26 Excellent – Non Impacted<br />
19-26 Good – Slight Impact<br />
11-18 Fair – Moderate Impacts<br />
0-10 Poor – Severe Impact<br />
Species Richness<br />
25<br />
20<br />
Species Richness<br />
15<br />
10<br />
5<br />
0<br />
0 5 10 15 20 25<br />
Impervious Cover<br />
Figure 3.17. Species Richness.<br />
EPT Index (Based on the Numbers of EPT Species in samples)<br />
EPT describes the number of Families of Ephemeroptera (mayflies), Plecoptera<br />
(stoneflies) and Trichoptera (Caddisflies) found in a sample. Each is an indicator of<br />
pollution and generally accepted as clean-water specimens (Lenat 1988). Expected<br />
ranges are >10 excellent water quality, 6-10 slightly impacted, 2-5 moderately impacted<br />
and 0-1 severely impacted. Water quality values based on EPT values appear in Table 3.<br />
Indicated water quality based upon EPT.<br />
Table 3.39. EPT / Water Quality Table<br />
EPT<br />
Water Quality<br />
>10 Excellent – Non Impacted<br />
6-9 Good – Slight Impact<br />
2-5 Fair – Moderate Impacts<br />
0-1 Poor – Severe Impact<br />
47
<strong>Blackwater</strong> <strong>Creek</strong> <strong>Watershed</strong> <strong>Management</strong> <strong>Plan</strong><br />
EPT Index<br />
16<br />
14<br />
12<br />
10<br />
EPT Index<br />
8<br />
6<br />
4<br />
2<br />
0<br />
0 5 10 15 20 25<br />
Impervious Cover<br />
Figure 3.18. EPT.<br />
Percent Model Affinity (PMA) (Adherence to theoretical model of un-impacted<br />
abundance)<br />
PMA is a measure of similarity to a non-impacted or target stream community based on<br />
percent abundance in 7 major groups (Novak and Bode 1992). An ideal community<br />
based on Washington (1984) with a community based on 40% Ephemeroptera, 5%<br />
Plecoptera, 10% Trichoptera, 10% Coleoptera, 20% Chironomidae, 5% Oligochaeta and<br />
10% other. Levels of impact are descried as >64 non impacted, 50-64 slightly impacted,<br />
35-49 moderate impact and 64 Excellent – Non Impacted<br />
50-64 Good – Slight Impact<br />
35-49 Fair – Moderate Impacts<br />
<strong>Blackwater</strong> <strong>Creek</strong> <strong>Watershed</strong> <strong>Management</strong> <strong>Plan</strong><br />
3.7 Pollutants and Sources<br />
Pollution is defined as any substance introduced into the environment that adversely<br />
affects the health of humans, animals, or ecosystems. There are two primary categories of<br />
pollution; point source pollution and non-point source pollution. Point source pollution<br />
originates from a stationary location in which pollutants are discharged with a single<br />
identifiable source. Less easily identified are the diffuse non-point sources. Common<br />
non-point sources are agriculture, forestry, urban, construction, channels, land disposal,<br />
parking lots, and city streets (USEPA Terms). These pollutants are carried into the<br />
ecosystems by storm water.<br />
3.7.1 Point Source Pollution<br />
<strong>Blackwater</strong> <strong>Creek</strong> <strong>Watershed</strong> Discharge Permits<br />
In accordance with the Clean Water Act, the National Pollutant Discharge Elimination<br />
System (NPDES) permit program regulates point source pollution (pollutants discharged<br />
directly into surface waters) for industrial, municipal, and other facilities. The NPDES<br />
permit program is authorized under the State Water Control Law and is administered by<br />
the Virginia Department of Environmental Quality (DEQ). The policies and procedures<br />
for administering these permits are defined by the Virginia Pollutant Discharge<br />
Elimination System Permit Regulation (9 VAC 25-31).<br />
<strong>Blackwater</strong> <strong>Creek</strong> watershed permits:<br />
Boxley Block LLC (<strong>Lynchburg</strong> <strong>Plan</strong>t)<br />
Permit Type: Industrial Stormwater Permit<br />
Receiving Stream: Ivy <strong>Creek</strong><br />
Permit Effective: 7/1/2004<br />
Permit Expires: 6/30/09<br />
Discharge Limits: pH: 6.0 - 9.0, TSS: 100 mg/L, Total Iron: 1 mg/L, No DMR received<br />
Renewal Schedule: Permit good for 5 years - facility is responsible for reissuance<br />
<strong>Lynchburg</strong> Ready Mix (Halsey Road)<br />
Permit Type: Ready Mix Concrete Permit<br />
Receiving Stream: <strong>Blackwater</strong> <strong>Creek</strong><br />
Permit Effective: 10/16/2003<br />
Permit Expires: 9/30/08<br />
Discharge Limits: No limitations. Annual monitoring required.<br />
Renewal Schedule: Permit good for 5 years - facility responsible for submitting a new<br />
registration statement 180 days prior to expiration date.<br />
49
<strong>Blackwater</strong> <strong>Creek</strong> <strong>Watershed</strong> <strong>Management</strong> <strong>Plan</strong><br />
Combined Sewer System (CSS) / Combined Sewer Overflow (CSO)<br />
<strong>Lynchburg</strong> STP (<strong>Lynchburg</strong> Combined Sewer Overflow Elimination Program)<br />
During the period of this permit, the City of <strong>Lynchburg</strong> is authorized to discharge from<br />
specified combined sewer overflow (CSO) outfalls. These discharges are consistent with<br />
the Clean Water Act Section 301(b)(1)(C). The City of <strong>Lynchburg</strong> must not discharge in<br />
excess of any limitation necessary to meet water quality standards established pursuant to<br />
State Law. The outfalls are limited and regulated by nine minimum controls (Virginia<br />
DEQ Letter to Gray). These agreed upon controls specify detail in the following areas:<br />
1. Operation and Maintenance<br />
2. Use Collection System for Storage<br />
3. Pretreatment Program<br />
4. Maximize Flow to Wastewater Treatment <strong>Plan</strong>t<br />
5. Eliminate Dry Weather Overflows<br />
6. Control Solids and Floatable Materials in CSOs<br />
7. Pollution Prevention<br />
8. Public Notification<br />
9. Monitoring<br />
Combined sewer systems (CSS) carry both sanitary waste and stormwater. During a<br />
storm event in CSS, stormwater flows into the same pipes as untreated sanitary waste.<br />
The City of <strong>Lynchburg</strong> combined sewage system was designed to collect and carry these<br />
combined flows to treatment facilities. Initially, this technology was considered state-ofthe<br />
art, but has since become a problem. As the city grew, the system could not carry the<br />
volume of waste. To resolve this problem, <strong>Lynchburg</strong> installed Combined Sewer<br />
Overflow (CSO) discharge points in burdened portions of the system.<br />
<strong>Lynchburg</strong>’s combined sewer overflows (CSOs) are a significant source of bacterial<br />
contamination (City of <strong>Lynchburg</strong> Comprehensive <strong>Plan</strong> 12.3). During large storm<br />
events, the CSOs spill excess flow from the lines into streams, contaminating the creeks,<br />
streams, and the James River with fecal coliform bacteria. Although the City of<br />
<strong>Lynchburg</strong> is in the process of eliminating CSOs, due to scheduling and available funds,<br />
it is estimated that the older parts of the city will continue to receive CSO through year<br />
2030, and possibly beyond.<br />
The U.S. Environmental Protection Agency (EPA) considers the elimination of CSOs a<br />
high priority. The City of <strong>Lynchburg</strong> has been focusing capital spending on the federally<br />
mandated program to eliminate combined sewer overflows (CSOs). A Special Consent<br />
Court Order provides implementation guidelines for eliminating CSOs. This EPA<br />
program is administered by the Virginia Department of Quality (City of <strong>Lynchburg</strong><br />
Comprehensive <strong>Plan</strong> 15.4).<br />
50
<strong>Blackwater</strong> <strong>Creek</strong> <strong>Watershed</strong> <strong>Management</strong> <strong>Plan</strong><br />
Map 3.11. Map of Remaining CSO PointsWithin the City of <strong>Lynchburg</strong><br />
3.7.2 Non-Point Source Pollution<br />
The less easily identified non-point sources pollution in the <strong>Blackwater</strong> <strong>Creek</strong> watershed<br />
originate from many sources, including agriculture, forestry, urban land use, construction,<br />
channels, land disposal, parking lots, and city streets. These pollutants fall into three<br />
categories affecting this watershed: (1) Bacteria, (2) Sediment, and (3) Nutrients.<br />
Bacteria<br />
The water quality of <strong>Blackwater</strong> and Ivy <strong>Creek</strong>s violate state and federal water quality<br />
standards for bacteria (Virginia DEQ TMDL). Fecal Coliforms and E. coli have been<br />
detected at numerous locations in <strong>Blackwater</strong> <strong>Creek</strong> and streams feeding it in recent<br />
years. There are many sources of bacteria including livestock, wildlife, and residential<br />
sources such as septic, and pets.<br />
51
<strong>Blackwater</strong> <strong>Creek</strong> <strong>Watershed</strong> <strong>Management</strong> <strong>Plan</strong><br />
Table 3.41 – DEQ E. coli Sampling Results<br />
DEQ E. coli* Sampling Results<br />
January 1, 2006 – December 31, 2006<br />
<strong>Blackwater</strong> <strong>Creek</strong> <strong>Watershed</strong><br />
DEQ Station<br />
ID<br />
2-BKW000.40<br />
2-BKW007.19<br />
2-BUN001.64<br />
2-DMG000.58<br />
2-IVA000.22<br />
2-IVA006.38<br />
2-IVA012.13<br />
2-THK001.31<br />
2-XXA001.43<br />
Station<br />
Location<br />
<strong>Blackwater</strong> <strong>Creek</strong> @<br />
Rivermont Avenue<br />
<strong>Blackwater</strong> <strong>Creek</strong> @<br />
Lakeside Drive<br />
Burton <strong>Creek</strong> @ Fort<br />
Avenue<br />
Dreaming <strong>Creek</strong> @<br />
Graves Mill Road<br />
Ivy <strong>Creek</strong> @ Bus<br />
Route 501<br />
Ivy <strong>Creek</strong> @<br />
Wiggington Road<br />
Ivy <strong>Creek</strong> @ Route<br />
662<br />
Tomahawk <strong>Creek</strong> @<br />
McConneville Road<br />
Rock Castle <strong>Creek</strong> @<br />
Harvard Street<br />
# of<br />
Samples<br />
* Instantaneous Standard = 235 cfu/100 mL<br />
Minimum<br />
Value<br />
Maximum<br />
Value<br />
Exceedances of<br />
Water Quality<br />
Standard<br />
%<br />
Violation<br />
Rate<br />
11 20 650 3 27%<br />
11 6 1660 4 36%<br />
11 48 20000 5 45%<br />
11 36 1120 2 18%<br />
11 34 1050 3 27%<br />
12 25 300 2 16%<br />
12 25 480 3 25%<br />
11 24 850 3 27%<br />
12 25 2000 4 33%<br />
The Department of Environmental Quality (DEQ) has placed the following creek<br />
portions of the <strong>Blackwater</strong> <strong>Creek</strong> <strong>Watershed</strong> on the Impairments Listing:<br />
• <strong>Blackwater</strong> <strong>Creek</strong> (VAC-H03R-01) 10.24 miles beginning at the confluence of<br />
Tomahawk and Burton <strong>Creek</strong>s and continuing to the confluence with the James<br />
River; impaired by fecal coliform.<br />
• Ivy <strong>Creek</strong> (VAC-H03R-03) 5.37 miles beginning at the mouth of Cheese <strong>Creek</strong>;<br />
impaired by fecal coliform bacteria.<br />
• Burton <strong>Creek</strong> (VAC-H03R-05) 3.47 miles beginning at the headwaters and<br />
continuing to the confluence of Tomahawk <strong>Creek</strong>; impaired by E. coli.<br />
• Tomahawk <strong>Creek</strong> (VAC-H03R-07) 5.9 miles beginning at the headwaters and<br />
continuing to the Burton <strong>Creek</strong> confluence; impaired by E. coli.<br />
A Total Maximum Daily Load (TMDL) analysis has been recently completed, with the<br />
recommended action plan scheduled for review by the Virginia State Water Control<br />
Board in March of 2008.<br />
Sediment<br />
Sediment consists of soil, particles, sand, and other mineral matter eroded from land and<br />
carried in surface waters (USEPA Terms). Sediment pollution is now thought to be the<br />
most significant pollutant impairing our use of freshwaters in the United States (USEPA<br />
1994). Studies show that sediment damages streams, resulting in loss of aquatic<br />
macroinvertebrate and degradation of water quality (Quinn et al. 1992, Waters 1995,<br />
Henley et al. 2000). Sedimentation was once thought to come from agricultural areas,<br />
52
<strong>Blackwater</strong> <strong>Creek</strong> <strong>Watershed</strong> <strong>Management</strong> <strong>Plan</strong><br />
but recent studies estimate that urbanization and construction may equal or exceed all<br />
other contributors to the sediment problem (Farnworth et al. 1979). Although disturbed<br />
land area of agricultural sites is larger than construction, construction sites erode at a<br />
much higher rate (Waters 1995).<br />
Soils typical of this watershed are of a clay type, with very small particle size. These<br />
clay soils of the Virginia Piedmont are particularly harmful to aquatic systems. Clay is<br />
also more difficult to manage at construction sites. The small particle size suspends<br />
longer and is transported further, damaging habitat for macroinvertebrates and fish<br />
(Waters 1995, Henley et al. 2000).<br />
Stated in a study by Thomas Shahady and Cheryl Swackhammer of <strong>Lynchburg</strong> <strong>College</strong>,<br />
construction sites significantly contribute to the watershed’s declining health of the<br />
ecosystem. In particular, non-compliant sites notably increase sediment loading and<br />
decrease water quality in adjacent streams. As sediment pollution increases, there is a<br />
distinct shift in macroinvertebrate populations from sediment intolerant species to<br />
tolerant species. As sediment pollution decreases further down the streams from the<br />
construction site, the study noted a severe decline in all macroinvertebrate species. The<br />
evidence collected in the study indicates that non-compliant construction sites contribute<br />
directly and indirectly to the declining water quality and macroinvertebrate populations<br />
of the watershed (Shahady et al. 2002).<br />
The severity of the sediment problem in <strong>Blackwater</strong> <strong>Creek</strong> <strong>Watershed</strong> is illustrated by<br />
<strong>College</strong> Lake, a small reservoir built in 1934. The <strong>College</strong> Lake drainage area comprises<br />
more than a third of the <strong>Blackwater</strong> <strong>Creek</strong> watershed. By 2002, the lake was less than<br />
half of its original size. It had lost approximately 170,000 m³ in storage capacity (Perault<br />
et al. 2005). In summary, the sedimentation from the escalating development of the<br />
watershed is destroying water quality and aquatic habitat.<br />
In addition to construction site development contributing to the sediment problem, instream<br />
erosion is a major contributor also. Urbanization brings additional stormwater<br />
management issues and creates greater amounts of impermeable surface with faster rates<br />
of runoff. With the elimination of CSOs, large amounts of stormwater with high rate of<br />
flow are being directed into watershed streams. These large quantities of rapid flowing<br />
water are eroding stream banks, with stream banks becoming undercut and unstable, and<br />
contributing to the sediment problem.<br />
Nutrients<br />
Control and management of nutrients is both challenging and essential to the long term<br />
health of the watershed. Under DCR’s NPS management program management targets,<br />
goals and objectives are outlined for the watershed. These management objectives<br />
should be adopted throughout the watershed. Additionally, innovated ideas of nutrient<br />
trading and minimization must be examined through public and private partnerships.<br />
53
<strong>Blackwater</strong> <strong>Creek</strong> <strong>Watershed</strong> <strong>Management</strong> <strong>Plan</strong><br />
3.8 Wet Lands<br />
Wetlands provide numerous benefits to watersheds. These benefits include fish and<br />
wildlife habitats, natural water quality improvements, flood storage, and opportunities for<br />
recreation and aesthetic appreciation (USEPA <strong>Watershed</strong> Academy). Protecting wetlands<br />
helps to protect the environmental quality of a watershed.<br />
Wetlands compare to forests and coral reefs as productive ecosystems. They support<br />
numerous species from all major groups of organisms by producing large quantities of<br />
food that attract many species of animals. Many wetlands are ideal for development of<br />
organisms that are at the base of food chain. The biodiversity is dependent on the<br />
physical and chemical features of the wetland, such as climate, nutrients, and hydrology.<br />
And very important to this watershed, wetlands remove nitrogen and phosphorus from<br />
surface waters (USEPA <strong>Watershed</strong> Academy).<br />
Accurate mapping of existing wetlands is not available. DEQ staff find potential areas of<br />
interest and wetlands through various web site tools; National Wetland Inventory, Natural<br />
Heritage Resources (Managed Conservation Lands - DCR), threatened and endangered<br />
species (VA Fish and Wildlife, US Fish & Wildlife), soils maps (NRCS - USDA), and<br />
even topographic maps. There are also checks with Historic Resources to see if impacts<br />
may involve them. The only truly accurate method to determine the coverage and<br />
locations of existing wetlands and sensitive areas is visiting and walking the areas in<br />
question.<br />
DEQ staff visit specific sites if there has been a (1) phone call with questions or<br />
complaints, (2) an application indicating that someone is going to be disturbing an area,<br />
or (3) an indication that there may be impacts to wetlands and/or streams. These<br />
<strong>Blackwater</strong> <strong>Creek</strong> watershed areas have permits or applications, or have had a Virginia<br />
Department of Environmental Quality (DEQ) site visit in the recent few years:<br />
1. Wards Crossing West (Old Navy shopping area): Located near the headwaters of<br />
Rock Castle <strong>Creek</strong> (Burton <strong>Creek</strong>). Site had 0.5 acres PFO. Site had 2000 linear<br />
feet (LF) of stream. Impacts include 0.5 acres PFO, 1133 LF of stream.<br />
Mitigation included 0.5 wetland acres bought through the Virginia Trust Fund and<br />
1133 LF of stream bought at Wreck Island Mitigation Bank. Permit 04-2411<br />
2. Wards Crossing West Connection (between shopping area and Leesville Road):<br />
Located near the headwaters of Rock Castle <strong>Creek</strong> (Burton <strong>Creek</strong>). Site had<br />
635.5 linear feet (LF) of stream. Impacts include 635.5 LF of stream. No<br />
mitigation since each of the stream crossings for a transportation project are single<br />
and complete projects, and none were over 300 LF of impact. Permit WP3-07-<br />
0258<br />
3. Home Depot (end of Old Graves Mill Road): Located on Tomahawk <strong>Creek</strong>. Site<br />
had 0.08 acres PFO, 0.9 PSS. Impacts include 0.8 acres PFO, 0.68 PSS, 73<br />
temporary LF of stream. Mitigation included creation of 1.02 acres PSS and .16<br />
acres PFO, 1183 LF of stream preservation. Permit WP4-04-1665<br />
54
<strong>Blackwater</strong> <strong>Creek</strong> <strong>Watershed</strong> <strong>Management</strong> <strong>Plan</strong><br />
4. Lakeside Center (old McConville farm and trailer park): Located on tributaries to<br />
Tomahawk <strong>Creek</strong>. Site has about 2 acres PFO and 3000+ linear feet (LF) of<br />
stream (do not have final maps with wetlands/stream impacts on it). Unknown<br />
what the impacts will be. No Permit issued at this time, no application at this<br />
time.<br />
5. McConville Shops (south of McConville farm): Located on tributaries to<br />
Tomahawk <strong>Creek</strong>. Have not received final maps with amount of wetlands and<br />
amount of impacts. No Permit issued at this time, no application at this time.<br />
6. McConville Road (redo old road to go around/through new shops): Located on<br />
tributaries to Tomahawk <strong>Creek</strong>. Site had 1126 linear feet (LF) of stream. Impacts<br />
include 1126 LF of stream. No mitigation since each of the stream crossings for a<br />
transportation project are single and complete projects, and none were over 300<br />
LF of impact. Permit WP3-07-1907.<br />
3.9 Conservation Areas<br />
The City of <strong>Lynchburg</strong> has defined resource conservation areas based on natural<br />
resources, floodplains, slopes, and soils. These designations include lands with special<br />
natural characteristics including stream valleys, 100-year flood plains, connected<br />
wetlands, and steep slopes (25% or greater). Development is limited to trails or other<br />
passive recreational facilities with limited environmental impact and public facilities that<br />
must be located within stream valley such as sewer mains, water intakes and outfalls,<br />
road crossings and public boat ramps. The goal is to keep these areas as natural as<br />
possible, with efforts to maintain and preserve for the natural absorption of urban runoff<br />
and prevention of soil erosion (City of <strong>Lynchburg</strong> Comprehensive <strong>Plan</strong> 5.2-5.3).<br />
Currently, the City of <strong>Lynchburg</strong> has 1,118.3 acres defined within the conservation<br />
districts of the <strong>Blackwater</strong> <strong>Creek</strong> watershed.<br />
The focus of conservation for Bedford County has been the utilization of conservation<br />
easements. A conservation easement is a voluntary agreement between a landowner and<br />
a conservation organization preserving the natural resources of undeveloped land. The<br />
landowners continue to own and use the land. Through conservation easements,<br />
agricultural and forested lands are protected from urbanization. Bedford County<br />
currently has 683.99 acres defined within conservation easements for the <strong>Blackwater</strong><br />
<strong>Creek</strong> watershed.<br />
55
<strong>Blackwater</strong> <strong>Creek</strong> <strong>Watershed</strong> <strong>Management</strong> <strong>Plan</strong><br />
Section 4: <strong>Blackwater</strong> <strong>Creek</strong> <strong>Watershed</strong> – Goals and Objectives<br />
The <strong>Blackwater</strong> <strong>Creek</strong> <strong>Watershed</strong> <strong>Plan</strong>ning Committee has defined the following goals<br />
and objectives. The applicability of these goals and objectives may vary depending on<br />
the area of focus. Some areas of the watershed are still very rural, while others are<br />
urbanizing, or highly impacted.<br />
Goal 1: Vital Habitat Protection and Restoration:<br />
Preserve, protect, and restore those habitats and natural areas that are vital to the survival<br />
and diversity of the living resources of <strong>Blackwater</strong> <strong>Creek</strong> / Ivy <strong>Creek</strong> watersheds.<br />
1-A: Conserve, rehabilitate, and protect vegetated buffers, wetlands, and forests.<br />
1-B: Improve in-stream habitat and restore stream bank stability.<br />
Goal 2: Water Quality Protection and Restoration:<br />
Achieve and maintain the water quality necessary to support the aquatic living resources,<br />
and to protect human health.<br />
2-A: Review local codes and ordinances in each of the localities. Strengthen current<br />
regulations, develop additional regulations, and achieve consistency across jurisdictional<br />
boundaries.<br />
2-B: Improve compliance with regulations. Determine effective penalties for<br />
violations.<br />
2-C: Reduce pollutant loads in stormwater runoff. Strengthen the technical basis for<br />
water quality regulations.<br />
2-D: Increase development, maintenance, and use of best management practices<br />
(BMPs). Develop and provide information concerning the effectiveness of BMPs,<br />
retrofits, softscape, and hardscape.<br />
56
<strong>Blackwater</strong> <strong>Creek</strong> <strong>Watershed</strong> <strong>Management</strong> <strong>Plan</strong><br />
Goal 3: Sound Land Use:<br />
Develop, promote and achieve sound land use practices that protect and restore watershed<br />
resources and water quality.<br />
3-A: Improve analysis and reporting of the impacts of development.<br />
3-B: Minimize the impacts of future development on the ecosystem to prevent further<br />
degradation of water quality within the <strong>Blackwater</strong> <strong>Creek</strong> <strong>Watershed</strong>.<br />
Goal 4: Stewardship and Community Engagement:<br />
Promote individual stewardship and assist individuals, community-based organizations,<br />
businesses, local governments and schools to undertake initiatives to achieve the goals<br />
and commitments of the <strong>Blackwater</strong> <strong>Creek</strong> <strong>Watershed</strong> <strong>Plan</strong>.<br />
4A: Promote the concept of landowner stewardship. Emphasize the need to adjust<br />
human activities to preserve, promote, and improve natural resources.<br />
4-B: Promote and facilitate community-based protection/restoration activities.<br />
4-C: Promote an understanding of the value of our natural systems. Communicate<br />
the potential effects of human activities on natural systems such as septic maintenance,<br />
pet waste, fertilizer rates, rain gardens, recycling, solid waste management strategies on<br />
natural systems.<br />
4-D: Foster educational partnerships and programs to increase respect for water,<br />
land, and wildlife.<br />
57
<strong>Blackwater</strong> <strong>Creek</strong> <strong>Watershed</strong> <strong>Management</strong> <strong>Plan</strong><br />
Section 5: <strong>Watershed</strong> Improvement <strong>Plan</strong><br />
Through the analysis of current watershed conditions including water quality, land use,<br />
and projected development by subwatershed, current management measures have been<br />
analyzed to determine effectiveness. Critical areas needing increased or additional<br />
management measures have been identified. Recommended action opportunities have<br />
been developed to protect and improve environmental conditions within the <strong>Blackwater</strong><br />
<strong>Creek</strong> watershed.<br />
For these identified areas of need, with the associated stressors and action opportunities,<br />
leadership requirements vary. Local government has been appointed as the governing<br />
body over land use decisions and therefore, makes decisions that can directly affect the<br />
water resources within the watershed. Other leadership resources considered valuable<br />
and vital in maximizing environmental change and watershed protection include citizens,<br />
businesses, and educational entities. All must take ownership and provide for the<br />
changes needed to preserve the <strong>Blackwater</strong> <strong>Creek</strong> watershed resources.<br />
It should be noted that most watershed protection tools have associated costs. Table 5.1<br />
summarizes costs and benefits of watershed protection tools for the developer, property<br />
owner, and local government. This table indicates that the community receives the<br />
greatest benefits and covers the least cost associated with watershed protection while<br />
local governments carry the greatest resource and financial burden. Although these tools<br />
have potential to save money for the developer, there are initial expenses for items such<br />
as stormwater and sediment control features, and initial consulting fees (CWP Article<br />
30).<br />
<strong>Watershed</strong> protection often requires local government to secure additional staff and<br />
technical resources in order to guide, review, monitor, enforce, and manage these<br />
watershed protection features. With this in mind, it is probable that the defined action<br />
opportunities within this watershed plan will represent a financial and resource burden for<br />
the local governments.<br />
In accordance with the <strong>Blackwater</strong> <strong>Creek</strong> watershed goals and objectives stated in<br />
Section 4 of this report, the following action opportunities have been identified. These<br />
recommendations are not all inclusive, as additional action items will be identified with<br />
continued changes in land use and with additional research. The utilization of these<br />
action items will vary within subwatersheds based on need.<br />
5.1 Preservation of Streams and Buffers.<br />
Goal 1, Objective A<br />
Conserve, rehabilitate, and protect vegetated buffers, wetlands, and forests.<br />
Just as important as stream restoration is the preservation of streams that are in good<br />
condition. To ensure the preservation of quality streams, sensitive stream reaches must<br />
first be inventoried and placed on a list to be protected. This list can be created using a<br />
58
<strong>Blackwater</strong> <strong>Creek</strong> <strong>Watershed</strong> <strong>Management</strong> <strong>Plan</strong><br />
Table 5.1. Balance Sheet for <strong>Watershed</strong> Protection (CWP Article 30)<br />
Balance Sheet for <strong>Watershed</strong> Protection<br />
(-) negative economic consequence (+) positive economic or environmental impact<br />
Adjacent<br />
<strong>Watershed</strong> Protection Tools Developer / Builder Property Owner Community Local Government<br />
1. <strong>Watershed</strong> <strong>Plan</strong>ning and<br />
Zoning<br />
(-) cost of land<br />
(-) location constraints<br />
(+) property value (+) business attraction<br />
(+) protection from adverse<br />
(-) staff and budget<br />
resources<br />
2. Protect Sensitive Areas (+) natural area premium<br />
(-) permitting costs<br />
(-) location constraints<br />
3. Establish Buffer Network (+) buffer premium<br />
(-) location constraints<br />
4. Cluster and Open Space<br />
Development<br />
5. Narrow Streets and<br />
Smaller Parking Lots<br />
6. Erosion and Sediment<br />
Control<br />
7. Stormwater Best<br />
<strong>Management</strong> Practices<br />
8. Treat Septic System<br />
Effluent<br />
9. Ongoing <strong>Watershed</strong><br />
<strong>Management</strong><br />
(+) construction costs<br />
(+) marketability<br />
(+) no lost lots<br />
(+) reduced construction<br />
cost<br />
(-) higher cost<br />
(+) savings in<br />
cleaning/grading<br />
(-) higher costs<br />
(+) pond/wetland premium<br />
(-) higher design and<br />
engineering costs<br />
no impact<br />
uses<br />
(+) property value (+) habitat<br />
(+) fisheries<br />
(+) property value (+) flooding risk<br />
(+) wildlife<br />
(+) greenway<br />
(+) trails<br />
(+) property value<br />
(-) HOA fees<br />
(+) property value<br />
(-) parking<br />
(+) trees saved increase<br />
value<br />
(+) no off-site sediment<br />
(-) maintenance<br />
(+) waterfront effect (if<br />
done right)<br />
(+) recreation<br />
(+) green space<br />
(+) natural area preservation<br />
(+) better sense of place<br />
(+) pedestrian friendly<br />
(+) water quality<br />
(+) tree conservation<br />
(+) protection of water<br />
supply<br />
(+) stream protection<br />
(-) clean out costs (+) protection of water<br />
supply<br />
(-) annual fee for utility<br />
(+) continued healthy<br />
environment<br />
(-) annual fee<br />
(+) involvement in<br />
watershed services<br />
(+) reduced “clean up”<br />
(-) staff resources<br />
(+) reduced “clean up” costs<br />
(+) lower cost of services<br />
(-) staff resources<br />
(+) fewer drainage<br />
complaints<br />
(-) staff resources<br />
(+) lower cost of services<br />
(-) staff resources<br />
(-) staff resources<br />
(+) reduced complaints<br />
from down streamers<br />
(-) staff resources<br />
(+) reduced water body<br />
programs/problems<br />
(-) staff resources<br />
(-) staff resources<br />
ECONOMIC TREND MIXED POSITIVE POSITIVE NEGATIVE<br />
59
<strong>Blackwater</strong> <strong>Creek</strong> <strong>Watershed</strong> <strong>Management</strong> <strong>Plan</strong><br />
standard set of parameters (i.e., stream bank stability, vegetation, etc.). Buffer ordinances<br />
could then be developed for sensitive stream reaches.<br />
Proposed buffer ordinances could utilize the U.S. Environmental Protection Agency’s<br />
Model Ordinance and should include (USEPA Aquatic Buffers):<br />
1. Local planning maps marked clearly with buffer boundaries,<br />
2. Restrictions on vegetation and soil disturbances,<br />
3. Information concerning characteristics of the stream and buffer widths with<br />
percent slopes,<br />
4. And, information concerning allowable uses.<br />
5.2 Integration of <strong>Blackwater</strong>/Ivy <strong>Creek</strong> Trail.<br />
Goal 1, Objective A<br />
Conserve, rehabilitate, and protect vegetated buffers, wetlands, and forests.<br />
It is highly desirable throughout the <strong>Lynchburg</strong> and Bedford County communities to<br />
continue the development of the trail system along this primary waterway. Significant<br />
long term benefits include recreation, preservation and restoration. Projects along these<br />
corridors and adjacent to these waterways should be evaluated for:<br />
1. Potential Community Awareness and <strong>Watershed</strong> Education,<br />
2. Preservation and Conservation,<br />
3. Public access points,<br />
4. Restoration and mitigation work and credits,<br />
5. And, relationships to the City of <strong>Lynchburg</strong> Parks and Recreation Department<br />
grant writing and trail development work.<br />
Existing plans for trail and park development of the City of <strong>Lynchburg</strong> Parks and<br />
Recreation Department include:<br />
Work in Progress:<br />
1. A trail Extension to Linkhorne Middle School: Connecting <strong>Blackwater</strong> <strong>Creek</strong><br />
Bikeway section of the James River Heritage from Ed Page Entrance, to<br />
Linkhorne Middle School. Infrastructure assessments, preliminary design, and<br />
cost estimates have been completed. The project is partially funded. The Parks<br />
and Recreation Department has again submitted a SAFETEA-LU grant<br />
application for the upcoming grant cycle, and is researching other grant<br />
opportunities.<br />
2. A trail extension of the <strong>Creek</strong>side Trail from the <strong>Blackwater</strong> <strong>Creek</strong> Athletics Area<br />
through <strong>Lynchburg</strong> <strong>College</strong>, and onto Sandusky Park: A Request for Proposal<br />
(RFP) is currently being drafted to include preliminary design, cost estimates, and<br />
grant support documents. This phase of the project is funded as part of the City’s<br />
Capital Improvement Program.<br />
3. The renovation of the <strong>Blackwater</strong> <strong>Creek</strong> Bikeway Bridge (upstream of Hollins<br />
Mill Park, near Mile Marker 2.0): After completion of an engineering study and<br />
subsequent construction documents, a contractor in the process of completing<br />
60
<strong>Blackwater</strong> <strong>Creek</strong> <strong>Watershed</strong> <strong>Management</strong> <strong>Plan</strong><br />
bridge improvements. This project is funded as part of the City’s Capital<br />
Improvement Program.<br />
4. The construction of the Ivy <strong>Creek</strong> Nature Center, a new park located in the<br />
Lynchpin Industrial Park: This park will feature fishing/education access to a five<br />
acre pond, nature center, arboretum, and trails. The site will eventually connect to<br />
the James River Heritage Trail system via the Ivy <strong>Creek</strong> Greenway connector<br />
from nearby Peaks View Park. Future trail development plans recommend<br />
extending the trail from the new park towards Poplar Forest and the D-Day<br />
Memorial in later phases. The first phase of the project includes earthen dam<br />
repairs, access road and trail construction, and parking area and restroom<br />
construction around the lake. The City of <strong>Lynchburg</strong> is applying for recreational<br />
access funds from VDOT, developing local partnerships, and seeking additional<br />
grant funding opportunities.<br />
Long range projects include:<br />
1. Ivy <strong>Creek</strong> Greenway Development:<br />
a. Peaks View Park to Ivy <strong>Creek</strong> Nature Center<br />
b. Linkhorne Middle School to Peaks View Park<br />
2. Update of James River Heritage Trail Master <strong>Plan</strong><br />
5.3 Stream Restoration.<br />
Goal 1, Objective B<br />
Improve in-stream habitat and restore stream bank stability.<br />
There are several areas with significantly impacted streams within the <strong>Blackwater</strong> <strong>Creek</strong><br />
watershed that need to be restored (i.e. Rock Castle <strong>Creek</strong> along Wards Road). Specific<br />
stream reaches that are good candidates for restoration should be identified, with exact<br />
location and lengths specified, and placed on a list by priority. Restoration projects<br />
should be well defined and include work in areas of stream buffers, riparian plantings,<br />
stabilization of stream banks, floodplains, and hydrology. An important component of<br />
this project will be the continued monitoring of restored stream water quality to<br />
determine the effectiveness of techniques used in restoration and for early detection of<br />
any developing problems.<br />
5.4 Adoption of New Regulations - City of <strong>Lynchburg</strong>.<br />
Goal 2, Objective A<br />
Review local codes and ordinances in each of the localities.<br />
The James River Association conducted a two year study analyzing the codes and<br />
ordinances of 45 cities and counties throughout Virginia. The City of <strong>Lynchburg</strong> was<br />
included. Data was developed and analyzed using forms designed by the Center of<br />
<strong>Watershed</strong> Protection (CWP): (1) the Code and Ordinance Worksheets and (2) the<br />
Erosion Control, Stormwater and Other Resource Issues Addendum A Worksheet. These<br />
worksheets provided a systematic comparison of <strong>Lynchburg</strong> development regulation to<br />
that of the CWP model of development principles (JRA 7-8).<br />
61
<strong>Blackwater</strong> <strong>Creek</strong> <strong>Watershed</strong> <strong>Management</strong> <strong>Plan</strong><br />
Using this information, the James River Association developed a score for the City of<br />
<strong>Lynchburg</strong>. This score was calculated by dividing earned points by total available points,<br />
and multiplying each by 100 to reach a percent score. This score provides an indication<br />
of the locality’s ability to support environmentally sensitive development. Scoring below<br />
60% indicate that the development codes are not environmentally sound and that reform<br />
is needed to protect the environment (JRA 9-10).<br />
The City of <strong>Lynchburg</strong>’s score is 38%. The city falls into the JRA “Urban Impacted”<br />
category, with slow population growth, but with significant amounts of existing and new<br />
development. Of similar 14 localities in this category, the City of <strong>Lynchburg</strong> ranks<br />
second to the lowest (Figure 5.1). The study suggests putting emphasis on the goals of<br />
reducing pollutant sources, restoring degraded streams, and protecting streams from<br />
further degradation (JRA 12).<br />
Figure 5.1. James River Association’s Ranking of Urban Impacted Localities of the<br />
James River <strong>Watershed</strong> Based on Code and Ordinance Worksheet (COW) Final<br />
Scores (JRA 12).<br />
Suggested city code changes to improve JRA watershed protection from current score<br />
of 38 to an environmental protection score of 85 or higher.<br />
The following list is reflective of potential adjustments necessary to raise the overall JRA<br />
score. By making these changes, <strong>Lynchburg</strong> City will improve watershed protection<br />
measures and move toward equality with similar municipalities in the region. These<br />
62
<strong>Blackwater</strong> <strong>Creek</strong> <strong>Watershed</strong> <strong>Management</strong> <strong>Plan</strong><br />
proposed changes will allow and encourage low impact development, better site design,<br />
cluster development, and reduction of impervious surface in new development.<br />
Residential Streets and Parking Lots<br />
1. Reduce minimum street width to 18-22 feet for low density residential (currently<br />
25 ft.).<br />
2. Reduce minimum radius of cul-de-sacs to less than 35 feet (currently 50 ft.).<br />
3. Allow for landscaped islands in the center of cul-de-sacs.<br />
4. Eliminate curb and gutter requirements for residential street sections.<br />
5. Set parking requirements as maximum or median, rather than minimum.<br />
6. Promote shared parking arrangements.<br />
7. Provide incentives for developers to provide parking within garages rather than<br />
surface parking lots.<br />
Lot Development<br />
1. Reduce minimum sidewalk width to 4 feet (currently 5 ft.).<br />
2. Reduce minimum driveway width to 9 feet (currently 12 ft.).<br />
3. Define a minimum percentage of open space to be managed in a natural condition.<br />
4. Define allowable and unallowable uses for open space in residential<br />
developments.<br />
5. Allow for temporary ponding of stormwater on yards or rooftops.<br />
Conservation of Natural Areas<br />
1. Develop a stream buffer ordinance, with minimum of 75 feet. Include wetlands,<br />
steep slopes, and 100-year flood plains. Specify at least part of the stream buffer<br />
to be maintained with native vegetation. Define allowable uses of buffer.<br />
2. Craft an ordinance that requires or encourages the preservation of natural<br />
vegetation at residential development sites.<br />
3. If forests or specimen trees are present, require some of the stand to be preserved.<br />
4. Develop incentives to developers or landowners to conserve non-regulated land.<br />
63
<strong>Blackwater</strong> <strong>Creek</strong> <strong>Watershed</strong> <strong>Management</strong> <strong>Plan</strong><br />
Adoption of New Regulations - Bedford County.<br />
Goal 2, Objective A<br />
Review local codes and ordinances in each of the localities.<br />
Bedford County was also included in the James River Association’s study. Data was<br />
developed and analyzed using forms designed by the Center of <strong>Watershed</strong> Protection<br />
(CWP): (1) the Code and Ordinance Worksheets and (2) the Erosion Control,<br />
Stormwater and Other Resource Issues Addendum A Worksheet. These forms provided<br />
a systematic comparison of Bedford County development rules to that of the CWP model<br />
of development principles (JRA 7-8).<br />
Using this information, the James River Association developed a score for Bedford<br />
County. This score was calculated by dividing earned points by total available points,<br />
and multiplying each by 100 to reach a percent score. This score provides an indication<br />
of the locality’s ability to support environmentally sensitive development. Scoring below<br />
60% indicate that the development codes are not environmentally sound and that reform<br />
is needed to protect the environment (JRA 9-10).<br />
Bedford County’s score is 24%. Bedford County is placed in the “Urbanizing” category.<br />
This category includes those localities with a moderate level of existing development,<br />
and a high level of development pressure. Bedford County ranks third to the lowest<br />
(Figure 5.2) of the 14 localities falling into this category. The James River Association<br />
suggests developing goals targeting areas of growth, protecting and conserving natural<br />
resources, land uses that protect water quality and preventing further degradation during<br />
future development (JRA 14).<br />
Suggested county code changes to improve JRA watershed protection from current<br />
score of 24 to an environmental protection score of 85 or higher.<br />
The following list is reflective of potential adjustments necessary to raise the overall JRA<br />
score. By making these changes, Bedford County will improve watershed protection<br />
measures and move toward equality with similar municipalities in the region. These<br />
proposed changes will allow and encourage low impact development, better site design,<br />
cluster development, and reduction of impervious surface in new development.<br />
Residential Streets and Parking Lots<br />
1. Develop street standards promoting efficient street layouts, reducing street length.<br />
2. Establish design criteria for swales to improve stormwater quality (i.e., dry<br />
swales, biofilters, or grass swales).<br />
3. Set parking requirements for professional office buildings and shopping centers.<br />
4. Provide incentives for developers to provide parking within garages rather than<br />
surface parking lots.<br />
5. Reduce minimum stall length for a standard parking space to 18 feet or less<br />
(currently 20 ft.).<br />
6. Provide 30% parking spaces in large commercial lots for compact cars.<br />
7. Set minimum % of parking lots to be landscaped.<br />
64
<strong>Blackwater</strong> <strong>Creek</strong> <strong>Watershed</strong> <strong>Management</strong> <strong>Plan</strong><br />
Figure 5.2. James River Association’s Ranking of Urbanizing Localities of the<br />
James River <strong>Watershed</strong> Based on Code and Ordinance Worksheet (COW) Final<br />
Scores (JRA 14).<br />
Lot Development<br />
1. Reduce minimum requirement for setbacks on ½ acre residential lots to 20 feet for<br />
front and 6 feet for side (currently 30 ft. and 10 ft. respectively).<br />
2. Reduce minimum driveway width to 9 feet.<br />
3. Allow pervious materials to be used for single family home driveways.<br />
4. Define a minimum percentage of open space to be managed in a natural condition.<br />
5. Define allowable and unallowable uses for open space in residential<br />
developments.<br />
6. Allow for temporary ponding of stormwater on yards or rooftops.<br />
Conservation of Natural Areas<br />
1. Develop a stream buffer ordinance, with minimum of 75 feet. Include wetlands,<br />
steep slopes, and 100-year flood plains. Specify at least part of the stream buffer<br />
to be maintained with native vegetation. Define allowable uses of buffer.<br />
2. Craft an ordinance that requires or encourages the preservation of natural<br />
vegetation at residential development sites.<br />
3. If forests or specimen trees are present, require some of the stand to be preserved.<br />
4. Develop incentives for developers and landowners to conserve non-regulated land<br />
(open space design, density bonuses, stormwater credits or lower property tax<br />
rates).<br />
65
<strong>Blackwater</strong> <strong>Creek</strong> <strong>Watershed</strong> <strong>Management</strong> <strong>Plan</strong><br />
5.6 Adoption of New Regulations - Campbell County.<br />
Goal 2, Objective A<br />
Review local codes and ordinances in each of the localities.<br />
Campbell County was also included in the James River Association’s study. Data was<br />
developed and analyzed using forms designed by the Center of <strong>Watershed</strong> Protection<br />
(CWP): (1) the Code and Ordinance Worksheets and (2) the Erosion Control,<br />
Stormwater and Other Resource Issues Addendum A Worksheet. These forms provided<br />
a systematic comparison of Bedford County development rules to that of the CWP model<br />
of development principles (JRA 7-8).<br />
Using this information, the James River Association developed a score for Campbell<br />
County. This score was calculated by dividing earned points by total available points,<br />
and multiplying each by 100 to reach a percent score. This score provides an indication<br />
of the locality’s ability to support environmentally sensitive development. Scoring below<br />
60% indicate that the development codes are not environmentally sound and that reform<br />
is needed to protect the environment (JRA 9-10).<br />
Campbell County’s score is 19%. Campbell County falls into the same Urbanizing<br />
category as Bedford, and is ranked second to the lowest (Figure 5.2). Like Bedford<br />
County, suggested emphasis for goals includes carefully targeting appropriate areas for<br />
growth, protecting and conserving natural resources and land uses that protect water<br />
quality and preventing degradation in future development (JRA 14).<br />
Suggested county code changes to improve JRA watershed protection from current<br />
score of 19 to an environmental protection score of 85 or higher.<br />
The following list is reflective of potential adjustments necessary to raise the overall JRA<br />
score. By making these changes, Campbell County will improve watershed protection<br />
measures and move toward equality with similar municipalities in the region. These<br />
proposed changes will allow and encourage low impact development, better site design,<br />
cluster development, and reduction of impervious surface in new development.<br />
Residential Streets and Parking Lots<br />
1. Develop street standards promoting efficient street layouts, reducing street length.<br />
2. Establish design criteria for swales to improve stormwater quality (i.e., dry<br />
swales, biofilters, or grass swales).<br />
3. Adjust parking requirements for shopping centers.<br />
4. Provide incentives for developers to provide parking within garages rather than<br />
surface parking lots.<br />
5. Provide 30% parking spaces in large commercial lots for compact cars.<br />
6. Set minimum % of parking lots to be landscaped.<br />
66
<strong>Blackwater</strong> <strong>Creek</strong> <strong>Watershed</strong> <strong>Management</strong> <strong>Plan</strong><br />
Lot Development<br />
1. Reduce minimum requirement for setbacks on ½ acre residential lots to 20 feet for<br />
front, 25 feet for rear, and 8 feet for side .<br />
2. Set minimum frontage distance for a ½ acre residential lot to 80 feet.<br />
3. Set minimum sidewalk width to 4 feet or less.<br />
4. Set minimum driveway width to 9 feet for one lane, 18 feet for 2 lanes.<br />
5. Allow pervious materials to be used for single family home driveways.<br />
6. Define a minimum percentage of open space to be managed in a natural condition.<br />
7. Define allowable and unallowable uses for open space in residential<br />
developments.<br />
8. Allow for temporary ponding of stormwater on yards or rooftops.<br />
Conservation of Natural Areas<br />
1. Develop a stream buffer ordinance, with minimum of 75 feet. Include wetlands,<br />
steep slopes, and 100-year flood plains. Specify at least part of the stream buffer<br />
to be maintained with native vegetation. Define allowable uses of buffer.<br />
2. Craft an ordinance that requires or encourages the preservation of natural<br />
vegetation at residential development sites.<br />
3. If forests or specimen trees are present, require some of the stand to be preserved.<br />
4. Develop incentives to developers or landowners to conserve non-regulated land.<br />
5. Develop incentives for developers and landowners to conserve non-regulated land<br />
(open space design, density bonuses, stormwater credits or lower property tax<br />
rates).<br />
5.7 Additional Action Opportunities – Cross Jurisdictional Boundaries.<br />
Goal 2, Objective A<br />
Review local codes and ordinances in each of the localities.<br />
Land use planning throughout the watershed by local governments seeks best use for<br />
these lands using zoning classifications identified in the separate comprehensive plans.<br />
Because development of private land is occurring very rapidly, concern for protection of<br />
environmentally sensitive areas is increasing throughout the watershed. In this<br />
watershed, three local jurisdictions have purview over watershed development. A<br />
comprehensive conservation framework involving a complete suite of protection tools<br />
would enhance future land use and foster an atmosphere between the development and<br />
environmental communities. This framework adopted equally among the three<br />
jurisdictions would bring a more holistic management approach into the watershed.<br />
The Conservation Framework<br />
A conservation framework integrates ecosystem tools into the existing regulations<br />
allowing better informed land use decisions. The goal is to balance conservation<br />
planning with land development planning, while protecting stream buffers, forests,<br />
meadows, and other parcels with unique environmental value or characteristics. <strong>Plan</strong>ning<br />
for conservation may include special programs such as, but not limited to, open space<br />
development, stormwater management (SWM) credits, overlay conservation zoning,<br />
67
<strong>Blackwater</strong> <strong>Creek</strong> <strong>Watershed</strong> <strong>Management</strong> <strong>Plan</strong><br />
incentive programs for buffer protection, agricultural and forestal district (AFD)<br />
designations, conservation easements, and transfer of development rights (TDR).<br />
Proposed conservation tools for the <strong>Blackwater</strong> <strong>Creek</strong> watershed, to promote and<br />
encourage land conservation:<br />
Overlay Conservation Zoning District<br />
Overlay zoning is a regulatory tool that creates a special zoning district placed over<br />
existing zoning. Overly zoning imposes additional regulations to protect specific<br />
resources or to guide development. It can include all or part of the underlying zones.<br />
Overlay districts can be used to manage environmental resources with special provisions<br />
for density standards, lot sizes, impervious surface limitations, vegetation requirements,<br />
and others.<br />
Agricultural and Forestal District (AFD) Designation<br />
These districts are designed to conserve and protect agricultural and forestall lands.<br />
Bedford County has included this objective in the Bedford County 2025<br />
Comprehensive <strong>Plan</strong>.<br />
Conservation Easements<br />
Virginia Outdoors Foundation (VOF) holds easements within the <strong>Blackwater</strong> <strong>Creek</strong><br />
watershed. Although some easements for the conservation of land exist, they protect<br />
a limited amount of land at this point. It is important to continue to build on land<br />
contained within this protection.<br />
Purchase of Development Rights (PDR)<br />
A PDR transaction is a voluntary agreement where the landowner sells his<br />
development rights to a governmental agency or a land trust. The agency or trust pays<br />
the landowner the difference between the agricultural value of the land and the land’s<br />
potential development value. The sale results in a conservation easement, which<br />
restricts the use of land to agricultural use, open space or wildlife habitat. The<br />
landowner retains private ownership of the land.<br />
To date, there are no PDRs in the <strong>Blackwater</strong> <strong>Creek</strong> watershed; however, Bedford<br />
Citizens for Land Conservation (BCLP) has been working with the Bedford County<br />
planning department in hopes of establishing a PDR program.<br />
Impervious Surface Caps<br />
Establish target maximums for impervious cover within zoning for each subwatershed,<br />
preserving pervious surface to a reasonable degree.<br />
68
<strong>Blackwater</strong> <strong>Creek</strong> <strong>Watershed</strong> <strong>Management</strong> <strong>Plan</strong><br />
Erosion & Sediment Control<br />
Enforceable Construction Site Phasing<br />
Phasing must be carefully planned in the early design stages of the development<br />
process, determining allowable construction elements that can be performed<br />
simultaneously and eliminating mass grading. Natural features or boundaries should<br />
be considered. Movement of soil should be balanced within each phase in order for<br />
cut soil to match fill needs. In using phased construction plans, portions of the site<br />
that will be developed in the future will remain undisturbed, resulting in a reduction<br />
of soil loss and sedimentation.<br />
Each jurisdiction will decide an approach for encouraging phased construction:<br />
voluntary measures, enforceable approaches (i.e. part of the erosion and sediment<br />
control plan or a clearing ordinance), or incentives (i.e. faster review times, more<br />
flexible permit conditions, reduced or waived permit fees, bonds).<br />
Silt Fences<br />
Silt fences should be the last line of defense. Silt fencing was originally developed<br />
for soils in the Midwest with a high silt and loam content. The <strong>Blackwater</strong> <strong>Creek</strong><br />
watershed currently relies heavily on silt fencing for control of sediment during<br />
construction. <strong>Plan</strong>s are often approved with silt fencing as the only barrier between<br />
disturbed soil and <strong>Blackwater</strong> <strong>Creek</strong> watershed resources. Clay is not effectively<br />
retained by silt fence. While somewhat effective, silt fence should be used in<br />
conjunction with other measures.<br />
Sediment Stabilization: polymers, seeding, matting, plantings<br />
Efforts must be improved to manage clay sediments throughout the watershed.<br />
Suggestions for additional sediment management include the use of polymers and<br />
improved combinations of seeding, matting, and plantings.<br />
Chemical polymers are long chained molecules that can be used to bind soil particles<br />
together. Current research suggests that the addition of polymers to exposed sediment<br />
coagulates the fine clay into particulates that can be effectively strained by silt<br />
fencing and sedimentation basins. The addition of polymers is recommended to<br />
better manage sedimentation. The effectiveness of various combinations of seeding,<br />
matting, and plantings can also be evaluated, to determine the best methods of<br />
stabilization in the watershed.<br />
Infiltration<br />
This is the most desirable method of stormwater management for all types of<br />
development. It closely mimics the original hydrology of an undeveloped site. It is<br />
necessary for groundwater recharge and storage in the watershed. It helps maintain<br />
flow during periods of low precipitation and minimizes flooding impacts for heavy<br />
downpours. It is recommended that focus be placed on adding mechanisms to aid in<br />
the infiltration process during construction.<br />
69
<strong>Blackwater</strong> <strong>Creek</strong> <strong>Watershed</strong> <strong>Management</strong> <strong>Plan</strong><br />
Slope Drains, Inlet, Outlet Protection, Check Dams<br />
These measures must be encouraged on all developments involving sloped<br />
conditions. Because the <strong>Blackwater</strong> <strong>Creek</strong> watershed consists of slopes and hills,<br />
these measures are an essential portion of any development plan. Slope drains should<br />
not be added after the fact due to poor drainage of a site.<br />
Detention<br />
Currently, small detention ponds are commonly used. This is primarily for the<br />
control of water quantity and provides very little water quality benefits. To derive<br />
water quality benefits from these detention facilities, wetland plants could be added<br />
and ponds could be constructed long and thin and in series. Research suggests as<br />
much as 24 hours detention is necessary to remove 50% of the nutrients in stormwater<br />
(extended detention).<br />
Low Impact Design Manual<br />
Design strategies incorporating both low impact and preservation must be available to<br />
engineers creating site design. This manual could offer approved design criteria for use<br />
in the watershed. Its use would be similar to that of the current Virginia Stormwater<br />
<strong>Management</strong> Handbook, offering site engineering alternate choices for designs that work<br />
with the natural landscape and ways to minimize impact to sensitive environmental areas.<br />
It is anticipated that such a handbook would be complimentary to other existing<br />
handbooks and tools available.<br />
The report, Low-Impact Development (LID) Literature Review and Fact Sheets, which<br />
was developed by EPA in cooperation with the LID Center, can be used for guidelines<br />
and information in the development of this manual. This report and additional related<br />
information is available at: www.epa.gov/nps/lid/<br />
Education<br />
In continued partnership with the Department of Conservation and Recreation (DCR) and<br />
Soil and Water Conservation Districts, an educational program for the local government<br />
decision-makers concerning the causes and effects of non-point source pollution can be<br />
developed. These additional education programs can be developed to compliment<br />
existing educational programs and can be structured similarly to the DCR Non-point<br />
Education for Municipal Officials (NEMO). NEMO was originally created at the<br />
University of Connecticut in the early 1990s, to provide information and assistance to<br />
local land use governing bodies; illustrating how natural resources can be protected while<br />
growth and development occur (Virginia DEQ Virginia Coastal Program).<br />
70
<strong>Blackwater</strong> <strong>Creek</strong> <strong>Watershed</strong> <strong>Management</strong> <strong>Plan</strong><br />
5.8 Erosion and Sedimentation Control (ESC) Ordinances and Fine Structure<br />
Overhaul.<br />
Goal 2, Objective B<br />
Improve compliance with regulations.<br />
This study is designed to determine the effectiveness of existing Erosion and Sediment<br />
Control Ordinances, and to develop proposed adjustments if deemed necessary. A<br />
committee of representatives from the administration of each jurisdiction, other interested<br />
stakeholders, and an assigned project manager from outside of the administration of each<br />
jurisdiction should address the following topics:<br />
1. A detailed, technical review of existing Sediment and Control Ordinances.<br />
2. A detailed collection and review of data pertaining to levels of compliance,<br />
notifications of violations, and methods of enforcement.<br />
3. An assessment of ESC practices after storm events.<br />
4. Severity of fine structure overhaul.<br />
5. Enforcement.<br />
6. Certification of contractors.<br />
7. Review for effectiveness of plans.<br />
5.9 Retention/Detention Basin Evaluation and Recondition.<br />
Goal 2, Objective C<br />
Reduce pollutant loads in stormwater runoff.<br />
Stormwater management throughout <strong>Blackwater</strong> <strong>Creek</strong> is predominately achieved<br />
through detention basins. These detention basins are created on site to slow water<br />
flowing from impervious surfaces, resulting in the release of stormwater into stream<br />
channels at a predetermined rate. This is required to prevent stormwater flowing directly<br />
into streams and overwhelming them during rain events. The use of retention basins is<br />
less common in this watershed. Retention methods allow stormwater to be filtered back<br />
into the ground on-site, rather than contributing to the downstream impacts.<br />
Retention and detention basins require regularly scheduled maintenance throughout their<br />
lifetime. With sedimentation, plant growth and use, they become less efficient. And, in<br />
some instances, basins were not installed because stormwater law did not require this<br />
practice. Because these are the primary best management practices used in the<br />
watershed, effectiveness must be determined.<br />
This project should include the following research, analysis, and development:<br />
1. Evaluate existing retention/detention basins throughout the watershed for<br />
performance. Survey size, condition, type, age, and engineering specs such as<br />
vegetation, buffer and maintenance logs for all detention/retention basins<br />
throughout watershed.<br />
2. Determine acreage of impervious surface serviced by each basin.<br />
71
<strong>Blackwater</strong> <strong>Creek</strong> <strong>Watershed</strong> <strong>Management</strong> <strong>Plan</strong><br />
3. Determine quality and functionality of basins. Ratios comparing the number of<br />
constructed detention basins to the number of constructed retention basins should<br />
be calculated.<br />
4. Develop schedule for evaluating quality performance for all stormwater facilities.<br />
5. Develop grading matrix for evaluation.<br />
6. Develop recommendations for further improvements of existing construction<br />
throughout the watershed.<br />
7. Develop recommendations for use of retention/detention basins in future<br />
development.<br />
5.10 Model <strong>Watershed</strong> Hydrology (Engineering Concepts, Inc.).<br />
Goal 2, Objective C<br />
Reduce pollutant loads in stormwater runoff.<br />
Model Applicability<br />
A cursory review of the sediment, nitrogen, and phosphorus modules of the HSPF<br />
modeling platform was performed to verify availability and identify parameters necessary<br />
to model the transport and fate of these pollutants. All three pollutants can be modeled<br />
within the HSPF model by adding the appropriate model code. The sediment modeling<br />
approach is based on the ARM and NPS models, and incorporates aspects of the USLE.<br />
The nitrogen and phosphorus models basically simulate the nitrogen and phosphorus<br />
cycles. Preliminary lists of parameters associated with the land segment portion of each<br />
pollutant model are listed below:<br />
• Sediment: management practice factor, soil detachment equations (scour and<br />
gully erosion) coefficients and exponents, reduction of sediment<br />
storage due to compaction, land cover preventing erosion,<br />
atmospheric deposition (from human activity and wind).<br />
• Nitrogen: plant uptake, ammonium immobilization, adsorption and desorption,<br />
nitrate immobilization, organic N ammonification, denitrification,<br />
nitrification.<br />
• Phosphorus: plant uptake, phosphate immobilization, adsorption and desorption,<br />
organic phosphorus mineralization.<br />
Model Development Scope<br />
We propose to develop a watershed model for the <strong>Blackwater</strong> <strong>Creek</strong> watershed using the<br />
HSPF platform using the <strong>Lynchburg</strong> TMDL model as the basis for that model. It is our<br />
opinion that the proposed model development and use should be phased to best support<br />
the watershed initiative and work within existing budget constraints. To that end, we<br />
propose a two-phase approach to model development and use.<br />
Phase I of the modeling effort will include the conceptual model development,<br />
reassessment of hydrology parameters and hydrology calibration and validation. We will<br />
reduce the area being modeled from the larger area modeled in the TMDL project to<br />
focus on the <strong>Blackwater</strong> <strong>Creek</strong> watershed, and will work with you to redefine<br />
72
<strong>Blackwater</strong> <strong>Creek</strong> <strong>Watershed</strong> <strong>Management</strong> <strong>Plan</strong><br />
subwatershed delineations to maximize the resolution of the model. With the model<br />
boundaries and subwatersheds defined, we will examine the hydrology model<br />
parameterization and the land uses represented and make adjustments as necessary. A<br />
properly calibrated hydrology model is essential to the success of any other pollutant<br />
transport and fate modeling, given that hydrology is the primary transfer mechanism.<br />
With the model structure representing the <strong>Blackwater</strong> <strong>Creek</strong> watershed established, we<br />
will recalibrate the hydrology model and validate the calibrated model. We will<br />
seek additional observed stream flow data to augment this calibration process.<br />
Phase II of the modeling effort consists of the development and use of a model to<br />
simulate the transport and fate of sediment, nitrogen, and phosphorus in the <strong>Blackwater</strong><br />
<strong>Creek</strong> watershed. Please note that this scope only includes actual modeling activities, and<br />
does not include other necessary activities such as source assessment, that can be<br />
performed by others in the project team. In developing the model, we must follow the<br />
same three-step process that was followed in developing the hydrology model. This<br />
includes the following:<br />
• Model development – construction and parameterization,<br />
• Model calibration and validation, and<br />
• Predictive use of the model.<br />
A cursory review of the HSPF model inputs included in this document describes the<br />
parameters that must be defined to model sediment, nitrogen, and phosphorus. We will<br />
work with <strong>Lynchburg</strong> <strong>College</strong> staff to derive approximate values for these parameters<br />
using physical data sources to the greatest extent possible. The other parameters will be<br />
estimated using best professional judgment. Once all required model structure is<br />
assembled and running properly, we will calibrate and validate the model to ensure that<br />
the model represents actual conditions in the watershed as accurately as it can. These<br />
activities require observed sediment (TSS), nitrogen, and phosphorus data for <strong>Blackwater</strong><br />
<strong>Creek</strong> and as many tributaries as possible, which we will rely on <strong>Lynchburg</strong> <strong>College</strong> to<br />
provide. With sufficient adjustment made to the model to provide a satisfactory<br />
calibration and validation for each pollutant, the model will be ready for predictive use.<br />
This will involve the evaluation of formulated watershed management alternatives to<br />
determine their relative effectiveness. For purpose of developing this scope, we anticipate<br />
evaluation of ten alternatives.<br />
5.11 Bacteria Source Reduction Strategy.<br />
Goal 2, Objective D<br />
Increase development, maintenance, and use of best management practices<br />
(BMPs).<br />
EPA approved the Bacteria Total Maximum Daily Load study for the James River Basin<br />
on December 4, 2007. Specific action items, with suggested approaches, include:<br />
1. Removing all CSO’s and straight pipes in order to meet the load reduction.<br />
2. Reducing straight pipe input by educating the public.<br />
73
<strong>Blackwater</strong> <strong>Creek</strong> <strong>Watershed</strong> <strong>Management</strong> <strong>Plan</strong><br />
3. Reducing human bacteria loading from failing septic systems by implementing an<br />
educational program for septic tank pump maintenance as well as septic system<br />
repair/replacement programs. Alternative waste treatment systems can also be<br />
used.<br />
4. Reducing bacteria load from leaking sewer lines by implementing a sanitary<br />
sewer inspection and management program.<br />
5. Reducing direct livestock impact by fencing the livestock out of streams and<br />
installing stream crossing hardened areas. Livestock must have access to<br />
alternative water. Educate the public (farmers) about the benefits livestock will<br />
receive from staying out of the water.<br />
6. Reducing pasture and cropland run-off by implementing riparian buffers.<br />
Rotational grazing is also helpful in reducing run-off.<br />
7. Implementing Best <strong>Management</strong> Practices (BMPs) for more management of<br />
urban wash-off from parking lots and roads.<br />
8. Implementing restrictive ordinances to reduce fecal loads from pets, improve<br />
garbage collection and control, and improved street cleaning.<br />
9. Educating the public on implementing pet waste disposal stations.<br />
5.12 Confluence Study (BW-5).<br />
Goal 3, Objective A<br />
Improve analysis and reporting of the impacts of development.<br />
Sedimentation is of concern in this watershed. Three primary areas of concern have been<br />
identified: (1) new construction and agricultural practices that allow sediment to directly<br />
flow into streams, (2) increasing impervious surface resulting in increased volume and<br />
flow of stormwater, and (3) the removal of CSOs resulting in additional stormwater<br />
entering the streams during storm events, again increasing the volume and flow of the<br />
streams. All of these alter the hydrology of the watershed. Because of the complexity in<br />
measuring the effects of each source, it has been historically difficult to determine where<br />
to best spend available funding; (1) tighter enforcement on construction sites or (2)<br />
greater complexity in design to limit water flow from new projects.<br />
Due to the locations of activities within the watershed, we have the opportunity to study<br />
the relative impact of each type of sediment input by analyzing stream inputs at<br />
confluences. The focus of this study will be concentrated on the area above the Burton<br />
<strong>Creek</strong> and Rock Castle <strong>Creek</strong> confluence. Burton <strong>Creek</strong> is stable with forested and low<br />
density residential land use. Rock Castle is highly urbanizing.<br />
This study could include analysis and research, with recommendations, in the following<br />
areas:<br />
1. Measuring total suspended solids and turbidity during rain events and relating<br />
these findings to land use and land disturbing data.<br />
2. Determining impervious surface impact on suspended sediment loading during<br />
storm events.<br />
74
<strong>Blackwater</strong> <strong>Creek</strong> <strong>Watershed</strong> <strong>Management</strong> <strong>Plan</strong><br />
5.13 Continued <strong>Watershed</strong> Studies.<br />
Goal 3, Objective A & B<br />
Improve analysis and reporting of the impacts of development.<br />
Minimize the impacts of future development on the ecosystem.<br />
As the area is developed and watershed characteristics change, new studies and ideas<br />
emerge that are difficult to anticipate. The following list suggests potential ongoing<br />
studies needed through time and the development of this watershed.<br />
1. Analyze needs for Best <strong>Management</strong> Practice (BMP) retrofits.<br />
2. Zoning map evaluation for optimization of both development and water quality.<br />
3. Statistical evaluation of land use data (forest, commercial, residential,<br />
agricultural, etc.) for comparable watersheds with a more acceptable JRA overall<br />
score (Charlottesville – peer group from the JRA association) to determine impact<br />
on flow and water quality parameters in comparison to that of the <strong>Blackwater</strong><br />
<strong>Creek</strong> watershed. Format spreadsheet(s) of needed data and then correlate<br />
hydrology and water quality information.<br />
4. Using the study conducted in Item #3, evaluate the business climate in these same<br />
communities for dependent relationships between environmental regulations and<br />
local business growth (negative or positive impacts).<br />
5.14 Develop <strong>College</strong> Lake as a Regional Extended Detention Basin.<br />
Goal 3, Objective B<br />
Minimize the impacts of future development on the ecosystem.<br />
Throughout watersheds BW 3-6, extensive development and urbanization is occurring.<br />
The Virginia Storm Water Handbook, used extensively by engineers in the <strong>Blackwater</strong><br />
<strong>Creek</strong> watershed, recommends the following for extended detention basins:<br />
1. Extended detention basins should be constructed with marsh to increase pollutant<br />
removal up to 50%.<br />
2. Pollutant removal typically occurs within the first 6-12 hours of detention, thus<br />
the basin must be sized to detain water through these periods of time. Ideally, a<br />
24 hour detention should be achieved for best pollutant removal.<br />
3. A 20 foot buffer of vegetation should be constructed around the detention basin in<br />
order to effectively treat storm water runoff.<br />
These requirements are very land intensive. Meeting these requirements for even a oneyear<br />
storm may require more land than development sites are able to dedicate.<br />
There are a number of contributing factors to the local stormwater management concerns:<br />
1. Marsh and aquatic vegetation is often viewed as unaesthetic within commercial<br />
development.<br />
2. Homeowners worry that marsh areas will breed mosquitoes and other insects.<br />
3. Undersized and poorly developed detention basins are common.<br />
4. Submitted plans often meet only minimum standards for storm water quantity. If<br />
the plans meet the minimum requirements, they must be approved.<br />
75
<strong>Blackwater</strong> <strong>Creek</strong> <strong>Watershed</strong> <strong>Management</strong> <strong>Plan</strong><br />
The Virginia Storm Water Handbook recommends a regional storm water approach to<br />
improve storm water quality. <strong>College</strong> Lake is ideally situated to meet this need. It is<br />
below the confluence of the three major drainage tributaries thorough the City of<br />
<strong>Lynchburg</strong>. It is currently trapping a tremendous amount of sediment in <strong>Lynchburg</strong>. It<br />
contains significant marsh wetlands and is surrounded by a significant vegetated buffer.<br />
It meets all criteria as a large enhanced (with marsh) Regional Extended Detention Basin.<br />
This approach may be the best local treatment option.<br />
<strong>College</strong> Lake should be evaluated as a nutrient and sediment trapping detention basin,<br />
resulting in research, analysis, and recommendations for the following areas:<br />
1. Optimum depth and retention time<br />
2. Necessary wetland acreage, composition and hydrology (wetland restoration)<br />
to optimize removal of pollutants<br />
3. Maintenance schedules including initial dredging, estimation of filling time<br />
and necessary dredging schedule<br />
4. Access of dredging equipment and placement of dredge spoils<br />
5. Assessment of dissolved and suspended nutrients looking at relationship<br />
between removal efficiency and dissolved fraction of nutrients<br />
6. Feasibility of user fee to support maintenance of lake<br />
7. Maintenance of Dam and Lakeside Drive<br />
5.15 Land Conservation.<br />
Goal 4, Objective A<br />
Promote the concept of landowner stewardship.<br />
This action opportunity is will tie closely with the conservation efforts of each<br />
jurisdiction as described in Section 5.7 Additional Action Opportunities – Cross<br />
Jurisdictional Boundaries. Activities will include determining the best approach for land<br />
conservation in each jurisdiction, developing plans for the acquisition of funds, and<br />
promoting conservation. Given that much of the Bedford County portion of the<br />
watershed is not yet developed, Bedford County will be the focus for this project.<br />
All conservation tools should be reviewed for applicability and recommendations made<br />
based on findings in relationship to this watershed. Tools include, but are not limited to,<br />
overlay zoning, Agricultural and Forestal District (AFD) Designations, Land Preservation<br />
Agreements (Conservation Easements), Purchase of Development Rights (PDR),<br />
Transfer of Development Rights (TDR), transfers of land to land trusts, and resource<br />
protection incentive programs such as the Conservation Reserve Enhancement Program<br />
(CREP), Conservation Reserve Program (CRP), Environmental Quality Incentives<br />
Program (EQIP), and Wildlife Habitat Incentives Program (WHIP).<br />
The study should include the utilization of models to determine effective areas to focus<br />
conservation, for example Natural Heritage GIS layers. Research and recommendations<br />
will be developed in partnership with the Central Virginia Land Conservancy.<br />
76
<strong>Blackwater</strong> <strong>Creek</strong> <strong>Watershed</strong> <strong>Management</strong> <strong>Plan</strong><br />
5.16 Abandoned Properties.<br />
Goal 4, Objective A<br />
Promote the concept of landowner stewardship.<br />
Often properties will be discarded, and will not be considered for reuse or redevelopment.<br />
Reinvesting in these properties takes development pressures off of undeveloped land,<br />
resulting in fewer disturbances and more preservation. This can also can increase local<br />
tax bases and facilitate job growth.<br />
This study will be used to determine the existence of abandoned commercial properties<br />
within the <strong>Blackwater</strong> <strong>Creek</strong> watershed and to develop a plan of action for those<br />
properties. Included in this study should be the promotion of the redevelopment of<br />
identified properties. Each site will be inventoried, with data describing the physical<br />
characteristics of the land as well as impervious surface, stormwater dynamics, detention<br />
pond maintenance records, abandonment procedures, and water quality concerns.<br />
5.17 Develop a Citizen Educational Series.<br />
Goal 4, Objective A<br />
Promote the concept of landowner stewardship.<br />
The <strong>Blackwater</strong> <strong>Creek</strong> watershed has many opportunities to provide environmental<br />
education to many segments of population through outreach programs. An outreach<br />
campaign should include information about those areas in which citizens can make a<br />
difference.<br />
This study should first determine the topics of priority and the segments of population to<br />
focus on in priority order. A project task list should be developed to create lesson plans<br />
and resources, define people resources, and determine the order in which outreach will be<br />
conducted. This educational program could include watershed awareness (trails,<br />
advertisements, printed materials), personal stewardship, and watershed engagement<br />
where public becomes involved in the projects.<br />
Topics may include:<br />
1. Lawn Care Practices (Reducing Fertilization)<br />
2. Pet Waste <strong>Management</strong><br />
3. Converting Lawns to Native, Natural State<br />
4. Pest <strong>Management</strong> – Holistic Approaches<br />
5. Car Washing and Automotive Maintenance including Proper Disposal of Toxic<br />
Fluids<br />
6. Impervious Surface Reduction<br />
7. Vegetation <strong>Management</strong><br />
8. Stormwater <strong>Management</strong><br />
9. Septic Tank Maintenance<br />
10. Storm Drain Stenciling<br />
77
<strong>Blackwater</strong> <strong>Creek</strong> <strong>Watershed</strong> <strong>Management</strong> <strong>Plan</strong><br />
Targeted audiences may include:<br />
1. Public school campuses,<br />
2. Public forums sponsored by local colleges and universities, targeted toward<br />
various age groups,<br />
3. Local companies (employee educational programs),<br />
4. Churches and other community organizations.<br />
5.18 Promote Volunteer Monitoring.<br />
Goal 4, Objective B<br />
Promote and facilitate community-based protection/restoration activities.<br />
Develop a program to continually involve concerned citizens in water quality monitoring<br />
of the streams and lakes within the <strong>Blackwater</strong> <strong>Creek</strong> watershed, and to recruit new and<br />
additional citizen volunteers. In addition to water quality, this group can be organized to<br />
participate in stream cleanups, stream bank restoration, and to further educational<br />
programs for the general public.<br />
The primary focus will be to develop and collect usable data and to share that information<br />
with other local organizations. This group can heighten the awareness of how human<br />
activities impact the natural resources of our watershed. Finally, this group can become<br />
an advocate for organizing citizen volunteers for stream cleanup and restorations.<br />
This study is to compliment and add to the physical assessment of streams outlined in<br />
Section 5.20 Visual Assessment of Streams. The volunteering monitor citizens will select<br />
logical sites within each subwatershed and shall work under the guidelines and<br />
information available at the Virginia Department of Environmental Quality web<br />
locations:<br />
www.deq.virginia.gov/wqs/<br />
www.deq.virginia.gov/cmonitor<br />
And the Virginia Citizen Water Quality Monitoring Program Methods Manual.<br />
5.19 Create Additional Public Access Points to Streams.<br />
Goal 4, Objective C<br />
Promote an understanding of the value of our natural systems.<br />
The goal of this action opportunity is to provide more connectivity and public access to<br />
natural resources within the <strong>Blackwater</strong> <strong>Creek</strong> watershed. By identifying and building<br />
additional access points to streams and <strong>College</strong> Lake, it is our hope that we can heighten<br />
environmental awareness within the citizen base. These access points are intended to be<br />
added to and integrated with the existing inventory of trail and access points already<br />
along <strong>Lynchburg</strong> City’s <strong>Blackwater</strong> <strong>Creek</strong> trail system.<br />
This project is to include the identification of potential new points of access,<br />
identification of neighborhood concerns, and the solicitation of suggestions from the area<br />
residents. Analysis results are to be presented in the form of general recommendations,<br />
detail descriptions of each proposed site with information about stream access, and maps<br />
78
<strong>Blackwater</strong> <strong>Creek</strong> <strong>Watershed</strong> <strong>Management</strong> <strong>Plan</strong><br />
of specific access points. Proposed educational programs for each site are also<br />
recommended.<br />
5.20 Visual Assessment Monitoring (Stream Walks).<br />
Goal 4, Objective D<br />
Foster educational partnerships and programs.<br />
The goal is to develop a standardized program for routinely developing data which will<br />
help identify activities affecting the watershed streams. Stream walks are to be conducted<br />
in each stream reach within each subwatershed of the <strong>Blackwater</strong> <strong>Creek</strong> watershed<br />
seasonally, with a minimum of two times per year. This data should then be compiled<br />
into a database format, with queries and reporting for analysis of seasonal information<br />
and trends. The seasons are to be defined as:<br />
Winter (December, January, February)<br />
Spring (March, April, May)<br />
Summer (June, July, August)<br />
Fall (September, October, November)<br />
A mechanism should be developed for the routine evaluation of stream conditions, bank<br />
conditions, riparian buffers, and wetlands (loss/creation) over defined intervals of time at<br />
specified GPS locations. Recordings will include physical parameters such as air and<br />
water temperatures, width of the steam channel, depth of pools and runs, stream velocity,<br />
water odor and color, and observations concerning biota in and near the stream. This<br />
project will be coordinated with the DEQ Citizen stream monitoring (water chemistry)<br />
program described at http://www.deq.virginia.gov/cmonitor/.<br />
5.21 School Campuses.<br />
Goal 4, Objective D<br />
Foster educational partnerships and programs.<br />
Public and private school campuses are excellent places for educational and outreach<br />
programs. In addition to providing printed materials and presentations to students<br />
concerning the protection and preservation of the environment, a program promoting<br />
“green” practices for school campuses should be developed. This program will address<br />
the administrative staff of the school systems first, with educational programs developed<br />
for the maintenance staff. Topics to be covered include mowing practices, permeable<br />
surfaces, rain water management, and others. This program will be designed with<br />
flexibility, where materials can be tailored to the specific needs of a particular school<br />
campus.<br />
79
<strong>Blackwater</strong> <strong>Creek</strong> <strong>Watershed</strong> <strong>Management</strong> <strong>Plan</strong><br />
Section 6: Improvement <strong>Plan</strong> Implementation<br />
The <strong>Blackwater</strong> <strong>Creek</strong> <strong>Watershed</strong> <strong>Plan</strong>ning Committee has assigned priorities and has<br />
projected the implementation years for each action opportunity. It is important to note<br />
that these recommendations are not all inclusive, as additional action items will be<br />
identified with continued changes in land use and with additional research. Adjustment<br />
to priorities may also be necessary as more information becomes available. The<br />
improvement plan includes action opportunities for conservation and preservation, water<br />
quality and land use improvements, additional research, and education / outreach.<br />
The action opportunities will require the coordination of representatives from local<br />
government, educational organizations, businesses, and citizens. The completion of these<br />
action opportunities is expected to take a number of years due to resource availability and<br />
the nature of the projects. The support of local government planning departments,<br />
elected officials, leadership within the business community, and private citizens is<br />
necessary for success. Success is also dependent on the identification of funding sources.<br />
All of these are critical path items for the completion of the stated objectives and goals.<br />
The <strong>Blackwater</strong> <strong>Creek</strong> <strong>Watershed</strong> <strong>Plan</strong>ning Committee will continue to meet, with plans<br />
to initiate and support the defined objectives. The committee plans to continue working<br />
with locally formed environmental interest groups (i.e. GLEN, BCLP) and to develop an<br />
even more active interaction between these groups. It is intended that this alliance in the<br />
near future, will be able to act as a clearing house for local environmental initiatives,<br />
sharing information for both short term and long term environmental projects.<br />
80
<strong>Blackwater</strong> <strong>Creek</strong> <strong>Watershed</strong> <strong>Management</strong> <strong>Plan</strong><br />
Proposed Implementation Schedule for Recommended Improvement Opportunities<br />
Scheduled Year<br />
Area(s) Priority Action Opportunity 1 2 3 4 5 6 7 8 9 10<br />
All 1 5.1 Preservation of Streams x x x<br />
All 2 5.2 <strong>Blackwater</strong> <strong>Creek</strong> <strong>Watershed</strong> Trails x x x x x<br />
BW-5 2 5.3 Stream Restoration x x x x x<br />
BW-7<br />
BW-8<br />
City of 1 5.4 Adoption of New Regulations – <strong>Lynchburg</strong> x x x<br />
<strong>Lynchburg</strong><br />
Bedford 1 5.5 Adoption of New Regulations – Bedford x x x<br />
County<br />
Campbell 1 5.6 Adoption of New Regulations – Campbell x x x<br />
County<br />
All 1 5.7 Additional Action Opportunities – Cross<br />
Jurisdictional Boundaries<br />
x x x x x x x<br />
All 3 5.8 Erosion and Sedimentation (ESC) Ordinances<br />
and Fine Structure Overhaul.<br />
All 1 5.9 Retention / Detention Basin Evaluation and<br />
Recondition.<br />
x x x x x x<br />
x x x x x<br />
All 1 5.10 Model <strong>Watershed</strong> Hydrology. x x x<br />
City of 3 5.11 Bacteria Source Reduction Strategy. x x x<br />
<strong>Lynchburg</strong><br />
BW-4 3 5.12 Confluence Study. x x x<br />
BW-5<br />
All 3 5.13 Continued <strong>Watershed</strong> Studies. x x x x x<br />
BW-8 1 5.14 Develop <strong>College</strong> Lake as a Regional Extended<br />
Detention Basin.<br />
x x x x x x<br />
All 1 5.15 Land Conservation. x x x x x<br />
All 5 5.16 Abandoned Properties. x x<br />
All 1 5.17 Develop a Citizen Educational Series. x x x<br />
All 4 5.18 Promote Volunteer Monitoring. x x x x<br />
All 4 5.19 Create Additional Public Access Points to<br />
Streams.<br />
x x x x<br />
All 5 5.20 Visual Assessment Monitoring. x x<br />
All 1 5.21 School Campuses. x x x<br />
Scheduled Year<br />
Area(s) Priority* Action Opportunity 1 2 3 4 5 6 7 8 9 10<br />
*Scale of 1-5. One is highest priority.<br />
81
<strong>Blackwater</strong> <strong>Creek</strong> <strong>Watershed</strong> <strong>Management</strong> <strong>Plan</strong><br />
References<br />
Bedford County Virginia. 2007. Bedford County Comprehensive <strong>Plan</strong>.<br />
Barbour, M.T., J. Gerritsen, B.D. Snyder, and J.B. Stribling. 1999. Rapid Bioassessment Protocols for Use<br />
in Streams and Wadeable Rivers: Periphyton, Benthic Macroinvertebrates and Fish, Second Edition. EPA<br />
841-B-99-002. U.S. Environmental Protection Agency; Office of Water; Washington, D.C.<br />
Bedford County Virginia. June 2007. Bedford County 2025 Comprehensive <strong>Plan</strong>.<br />
Campbell County Virginia. October 2002. Campbell County Comprehensive <strong>Plan</strong>. <<br />
http://www.co.campbell.va.us/><br />
Cappiella, K. and K. Brown. 2001. Impervious Cover and Land Use in the Chesapeake Bay <strong>Watershed</strong>.<br />
Center for <strong>Watershed</strong> Protection. Ellicott City, MD.<br />
Center for <strong>Watershed</strong> Protection. August 1998. Better Site Design: A Handbook for Changing<br />
Development Rules in Your Community. Ellicott City, Maryland. 173 pp.<br />
Center for <strong>Watershed</strong> Protection. The Do-It-Yourself <strong>Watershed</strong> <strong>Plan</strong>ning Kit: Skills and Techniques for<br />
Saving Your Stream. Ellicott City, Maryland.<br />
Center for <strong>Watershed</strong> Protection. Article 30: The Economics of <strong>Watershed</strong> Protection. The Practice of<br />
<strong>Watershed</strong> Protection. CD-ROM. Ellicott City, Maryland.<br />
Chesapeake Bay Program. 2000. Chesapeake 2000 Agreement. Annapolis, MD.<br />
<br />
City of <strong>Lynchburg</strong>. Department of Community <strong>Plan</strong>ning & Development. Comprehensive <strong>Plan</strong> 2002-2020.<br />
September 2002.<br />
Commonwealth of Virginia. Chesapeake Bay Nutrient and Sediment Reduction Tributary Strategy for the<br />
James River, Lynnhaven and Poquoson Coastal Basins. 2005.<br />
Engineering Concepts, Inc. Letter to Tom Shahady and Patricia Fitzsimmons, from C.J. Mitchem. HSPF<br />
Model Applicability and Proposed Scope. 25 July 2007.<br />
Farnworth, E. G., M.C. Nichols, and C.N. Vann. 1979. Impact of sediments on nutrients and biota in<br />
surface waters of the United States. EPA-600/3-79-105. USEPA. Washington DC. 315 pp.<br />
Gannicott, P., T.D. Shahady, and P.A. Fitzsimmons. <strong>College</strong> Lake: Long – Term Assessment of Water<br />
Quality and Sediment Characterization. <strong>Lynchburg</strong> <strong>College</strong>, <strong>Lynchburg</strong>, Virginia. 2006.<br />
Greater <strong>Lynchburg</strong> Environmental Network. <strong>Lynchburg</strong>, Virginia.<br />
< www.glenetwork.org><br />
Hilsenhoff WL. 1988. Rapid field assessment of organic pollution with a family level biotic index. J. N.<br />
Am. Benthol. Soc. 7:65-68.<br />
Henley, W.F., M.A. Patterson, R.J. Neves and A.D. Lemly. 2000. Effects of Sedimentation and Turbidity<br />
on Lotic Food Webs: A Concise Review for Natural Resource Managers. Reviews in Fisheries Science<br />
8(2): 125-139.<br />
82
<strong>Blackwater</strong> <strong>Creek</strong> <strong>Watershed</strong> <strong>Management</strong> <strong>Plan</strong><br />
James River Association. January 2007. Building a Cleaner James River: Improving Local Building Codes<br />
& Ordinances to Protect the James River & Its Tributaries. <<br />
http://www.jamesriverassociation.org/publications.html><br />
Jenkins, RE and NM Burkhead. 1993. Freshwater fishes of Virginia. American Fisheries Society,<br />
Bethesda, Maryland.<br />
Karr, J.R. 1981. Assessment of biotic integrity using fish communities. Fisheries 66:21-<br />
27.<br />
Karr, JR and EW Chu. 1999. Restoring life in running waters: Better biological monitoring. Island Press.<br />
Washington DC.<br />
Lenat, DR. 1988. Water quality assessment of streams using a qualitative collection method for benthic<br />
macroinvertebrates. J. N. Am. Benthol. Soc. 7:222-233.<br />
<strong>Lynchburg</strong> Regional Chamber. <strong>Lynchburg</strong> Life: Fundamental Facts. 2007.<br />
< http://www.lynchburgchamber.org/lynchburglife/facts/><br />
McDonnell, M.J. and S.T.A. Pickett. 1990. Ecosystem Structure and Function Along Urban-Rural<br />
Gradients: An Unexploited Opportunity for Ecology. Ecology, 71:1232-1237.<br />
Merritt, RW and KW Cummins. 1996. Aquatic insects of North America. Kendall/Hunt Publishing.<br />
Dubuque Iowa.<br />
Newman, D. J., D. R. Perault, and T. D. Shahady. 2006. <strong>Watershed</strong> development and sediment<br />
accumulation in a small urban lake. Journal of Lake and Reservoir <strong>Management</strong> 22:303-307.<br />
Novak, MA and RW. Bode. 1992. Percent model affinity: a new measure of macroinvertebrate community<br />
composition. J. N. Am. Benthol. Soc. 11:80-85.<br />
Perault, DR., D.J. Newman, and T.D. Shahady. 2005. Muddy Waters: Landcover and Sedimentation in an<br />
Urban Lake. Proceedings of the 25 th ESRI International User Conference. San Diego, California.<br />
Plafkin, JL., MT Barbour, KD Porter, SK Gross and RM Hughes. 1989. Rapid bioassessment protocols for<br />
use in streams and rivers: benthic macroinvertebrates and fish. EPA/444/4-89-001. The United States<br />
Environmental Protection Agency, Waqshington, DC.<br />
Newman, D. J., D. R. Perault, and T. D. Shahady. 2006. In press. <strong>Watershed</strong> development and sediment<br />
accumulation in a small urban lake. Journal of Lake and Reservoir <strong>Management</strong>..<br />
Rohde, FC, RG Arndt, DG Lindquist and JF Parnell. 1994. Freshwater fishes of the Carolinas, Virginia,<br />
Maryland and Delaware. University of North Carolina Press, Chapel Hill NC.<br />
Shahady,T.D., P.A. Fitzsimmons. State of <strong>Blackwater</strong> <strong>Creek</strong> <strong>Watershed</strong>: <strong>Blackwater</strong> <strong>Creek</strong> <strong>Watershed</strong><br />
Initiative. <strong>Lynchburg</strong> <strong>College</strong>, <strong>Lynchburg</strong>, Virginia. 2006.<br />
Sprague, L.A., Zuellig, R.E., and Dupree, J.A., 2006, Effects of urbanization on stream ecosystems in the<br />
South Platte River Basin, Colorado and Wyoming, chap. A of Effects of urbanization on stream ecosystems<br />
in six metropolitan areas of the United States: U.S. Geological Survey Scientific Investigations Report<br />
2006-5101-A, 139 p.<br />
Swackhammer, C. and T.D. Shahady, 2002. Impact of Construction Site Run-Off on Water Quality and<br />
Macroinvetebrate Composition in Virginia Piedmont Streams. Water Resource Institution Proceedings,<br />
Blacksburg, Virginia.<br />
83
<strong>Blackwater</strong> <strong>Creek</strong> <strong>Watershed</strong> <strong>Management</strong> <strong>Plan</strong><br />
Quinn, J.M., R.J. Davies-Colley, CW Hickey, M.L. Vickers and P.A. Ryan. 1992. Effects of Clay<br />
Discharges on Streams. Hydrobiol. 248:235-247.<br />
U.S.Department of Agriculture Soil Conservation Service in cooperation with Virginia Polytechnic<br />
Institute and State University. 1977. Soil Survey of Campbell County and City of <strong>Lynchburg</strong>, Virginia.<br />
U.S. Environmental Protection Agency. Aquatic Buffers.<br />
< http://www.epa.gov/nps/ordinance/buffers.htm><br />
U.S. Environmental Protection Agency. Terms of Environment: Glossary, Abbreviations and Acronyms.<br />
<br />
U.S. Environmental Protection Agency. 1994. The Quality of Our Nations Water: 1992. Office of Water.<br />
Washington D.C. EPA 841-S-94-002.<br />
U.S. Environmental Protection Agency. 2002. Ambient Water Quality Criteria for Bacteria Guidelines.<br />
Office of Water. Washington D.C. EPA 823-B-02-003.<br />
U.S. Environmental Protection Agency. December 2003. Getting in Step: A Guide for Conducting<br />
<strong>Watershed</strong> Outreach Campaigns. Report No. EPA 841-B-03-002.<br />
U.S. Environmental Protection Agency. October 2005. Handbook for Developing <strong>Watershed</strong> <strong>Plan</strong>s to<br />
Restore and Protect Our Waters. Report No. EPA 841-B-05-005.<br />
U.S. Environmental Protection Agency. 2007. <strong>Watershed</strong> <strong>Plan</strong> Builder: Annotated Outline.<br />
.<br />
U.S. Environmental Protection Agency. <strong>Watershed</strong> Academy Web: Wetlands Functions and Values. <<br />
http://www.epa.gov/watertrain/wetlands/><br />
Virginia. Department of Conservation & Recreation. Local <strong>Watershed</strong> <strong>Management</strong> <strong>Plan</strong>ning in Virginia:<br />
A Community Water Quality Approach. 49pp.<br />
<br />
Virginia Department of Environmental Quality, 2007. Bacteria Total Maximum Daily Load Development<br />
for the James River Basin. Prepared by Engineering Concepts. May 2007.<br />
<br />
Virginia Department of Environmental Quality. Letter to Amanda Gray. <strong>Lynchburg</strong> CSOs as described in<br />
VPDES Permit No. VA0024970E. Combined Sewer Overflow Elimination Program. 28 November 2007.<br />
Virginia Department of Environmental Quality. Letter to Patricia Fitzsimmons. Wetland Information for<br />
the <strong>Blackwater</strong> <strong>Creek</strong> <strong>Watershed</strong> <strong>Management</strong> <strong>Plan</strong>. 4 October 2007.<br />
Virginia Department of Environmental Quality. Virginia Coastal Program: 2006 Coastal Grant Project<br />
Description and Final Summary.<br />
< http://www.deq.state.va.us/coastal/description/2006projects/82-06.html><br />
Virginia’s Region 2000 Local Government Council. Region 2000 Greenways & Blueways <strong>Plan</strong>: Amherst,<br />
Appomattox, Bedford & Campbell Counties and the Cities of Bedford and <strong>Lynchburg</strong>. 2003.<br />
<br />
Voshell, J.R. Jr., Ph.D. A Guide to Common Freshwater Invertebrates of North America. The McDonald<br />
and Woodward Publishing Company, Blacksburg, Virginia., 2002.<br />
84
<strong>Blackwater</strong> <strong>Creek</strong> <strong>Watershed</strong> <strong>Management</strong> <strong>Plan</strong><br />
Washington, HG. 1984. Diversity, biotic and similar indicies. A review with special relevance to aquatic<br />
systems. Water Research 18: 653-694.<br />
Waters, T.F. 1995. Sediment in Streams: Sources, Biological Effects and Control. American Fisheries<br />
Society, Maryland.<br />
85
<strong>Blackwater</strong> <strong>Creek</strong> <strong>Watershed</strong> <strong>Management</strong> <strong>Plan</strong><br />
Appendix A<br />
Additional Available Materials<br />
Pamphlet: The <strong>Blackwater</strong> <strong>Creek</strong> <strong>Watershed</strong> <strong>Management</strong> <strong>Plan</strong><br />
Recent <strong>Lynchburg</strong> News & Advance Articles:<br />
• Not quite fresh water. Thursday, July 13, 2006<br />
• Waters getting dirtier. Saturday, August 5, 2006<br />
• Watching over area waterways. Tuesday, August 15, 2006<br />
• <strong>College</strong> Lake may get help. Sunday, November 19, 2006<br />
• Goal: Improve water quality. Saturday, February 17, 2007<br />
• Saving <strong>College</strong> Lake. Friday, February 23, 2007<br />
• Forget hot tin roof, these will be 'green'. Saturday, March 3, 2007<br />
• DEQ to talk E. coli. Wednesday, May 2, 2007<br />
• DEQ lists ways to better protect area waterways. Saturday, May 5, 2007<br />
• Windsor Hills residents' concerns prompt water study. Tuesday, June 26, 2007<br />
• <strong>Watershed</strong> warriors wade into <strong>Lynchburg</strong>-area creeks. Saturday, July 21, 2007<br />
• A closer look at Dreaming <strong>Creek</strong>. Saturday, July 21, 2007<br />
• Team tours creek to gauge center's threat. Saturday, August 4, 2007<br />
• Shahady: Storm-water work causing increased erosion. Saturday, September 15,<br />
2007<br />
• Sedimentation and wetlands threatening to take over <strong>Lynchburg</strong>'s only lake.<br />
Saturday, October 6, 2007<br />
• Time's Very Short to Save <strong>College</strong> Lake. Thursday, October 11, 2007<br />
• Officials: Tomahawk <strong>Creek</strong> Has Fallen Prey to Development. Saturday,<br />
November 17, 2007<br />
• Cornerstone Streets Get OK. Thursday, January, 2008<br />
The <strong>Creek</strong>bed ChroniclesBog. What’s really going on in <strong>Lynchburg</strong>’s streams.<br />
http://creekbedchronicles.wordpress.com/<br />
<strong>Lynchburg</strong> <strong>College</strong> Green Letter from President Garrin, June 5, 2007<br />
WSET:<br />
Central Virginia Land Conservancy Saving Land.<br />
Posted: April 05, 2007 11:42 PM EST<br />
<strong>College</strong> & Elementary Students Team-Up on Wetlands Project.<br />
Posted: April 15, 2007 11:55 PM EST<br />
Could More Development Hurt the James River?<br />
Posted: June 12, 2007 11:19 PM EST<br />
Drought Helping the James River<br />
Posted: October 22, 2007 11:57 PM EST<br />
86
<strong>Blackwater</strong> <strong>Creek</strong> <strong>Watershed</strong> <strong>Management</strong> <strong>Plan</strong><br />
Reports:<br />
• “Building a Cleaner James River” January 2007 report by the James River<br />
Association<br />
• “State of the <strong>Blackwater</strong> <strong>Creek</strong> <strong>Watershed</strong>: <strong>Blackwater</strong> <strong>Creek</strong> <strong>Watershed</strong> Initiative”<br />
June 2006 report by <strong>Lynchburg</strong> <strong>College</strong> and Partners.<br />
• “Bacteria Total Maximum Daily Load Development for the James River Basin” May<br />
2007 report submitted by Virginia Department of Environmental Quality, prepared by<br />
Engineering Concepts, Inc.<br />
• “Muddy Waters: Landcover and Sedimentation in an Urban Lake,” by David R.<br />
Perault, David J. Newman, Jr., and Thomas D. Shahady<br />
87