printable form - The Center for Connected Learning and Computer ...
printable form - The Center for Connected Learning and Computer ...
printable form - The Center for Connected Learning and Computer ...

Create successful ePaper yourself
Turn your PDF publications into a flip-book with our unique Google optimized e-Paper software.
(Note: in addition to sliders <strong>and</strong> switches, some models have a third kind of setting, called a<br />
chooser. <strong>The</strong> Wolf Sheep Predation doesn't have any of these, though.)<br />
Gathering In<strong><strong>for</strong>m</strong>ation: Plots <strong>and</strong> Monitors<br />
A purpose to modeling is to gather data on a subject or topic that would be very difficult to do in a<br />
laboratory situation. NetLogo has two main ways of displaying data to the user: plots <strong>and</strong> monitors.<br />
Plots<br />
<strong>The</strong> plot in Wolf Sheep Predation contains three lines: sheep, wolves, <strong>and</strong> grass / 4. (<strong>The</strong> grass<br />
count is divided by four so it doesn't make the plot too tall.) <strong>The</strong> lines show what's happening in the<br />
model over time. To see which line is which, click on "Pens" in the upper right corner of the plot<br />
window to open the plot pens legend. A key appears that indicates what each line is plotting. In this<br />
case, it's the population counts.<br />
When a plot gets close to becoming filled up, the horizontal axis increases in size <strong>and</strong> all of the data<br />
from be<strong>for</strong>e gets squeezed into a smaller space. In this way, more room is made <strong>for</strong> the plot to<br />
grow.<br />
If you want to save the data from a plot to view or analyze it in another program, you can use the<br />
"Export Plot" item on the File menu. It saves this in<strong><strong>for</strong>m</strong>ation to your computer in a <strong><strong>for</strong>m</strong>at that can<br />
by read back by spreadsheet <strong>and</strong> database programs such as Excel. You can also export a plot by<br />
control−clicking (Mac) or right−clicking (Windows) it <strong>and</strong> choosing "Export..." from the popup menu.<br />
Monitors<br />
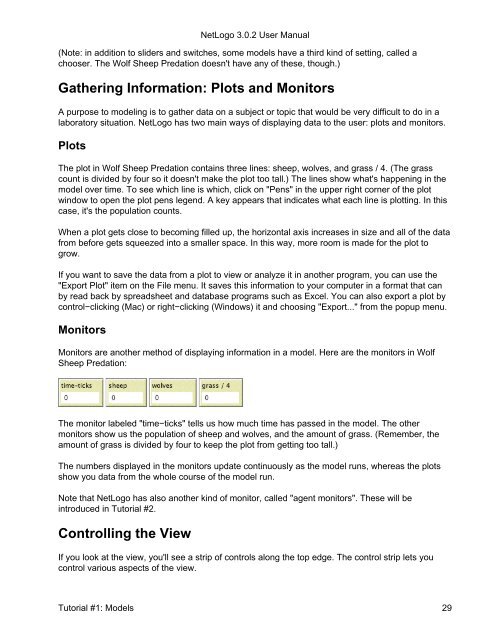
Monitors are another method of displaying in<strong><strong>for</strong>m</strong>ation in a model. Here are the monitors in Wolf<br />
Sheep Predation:<br />
<strong>The</strong> monitor labeled "time−ticks" tells us how much time has passed in the model. <strong>The</strong> other<br />
monitors show us the population of sheep <strong>and</strong> wolves, <strong>and</strong> the amount of grass. (Remember, the<br />
amount of grass is divided by four to keep the plot from getting too tall.)<br />
<strong>The</strong> numbers displayed in the monitors update continuously as the model runs, whereas the plots<br />
show you data from the whole course of the model run.<br />
Note that NetLogo has also another kind of monitor, called "agent monitors". <strong>The</strong>se will be<br />
introduced in Tutorial #2.<br />
Controlling the View<br />
NetLogo 3.0.2 User Manual<br />
If you look at the view, you'll see a strip of controls along the top edge. <strong>The</strong> control strip lets you<br />
control various aspects of the view.<br />
Tutorial #1: Models 29