Structural, ferroelectric and optical properties of PZT thin films
Structural, ferroelectric and optical properties of PZT thin films
Structural, ferroelectric and optical properties of PZT thin films

You also want an ePaper? Increase the reach of your titles
YUMPU automatically turns print PDFs into web optimized ePapers that Google loves.
ARTICLE IN PRESS<br />
Physica B 369 (2005) 135–142<br />
www.elsevier.com/locate/physb<br />
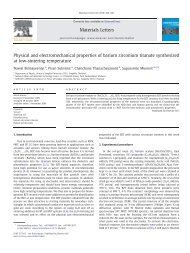
<strong>Structural</strong>, <strong>ferroelectric</strong> <strong>and</strong> <strong>optical</strong> <strong>properties</strong><br />
<strong>of</strong> <strong>PZT</strong> <strong>thin</strong> <strong>films</strong><br />
S.K. P<strong>and</strong>ey a, , A.R. James a , R. Raman a , S.N. Chatterjee a , Anshu Goyal a ,<br />
Ch<strong>and</strong>ra Prakash a , T.C. Goel b<br />
a Solid State Physics Laboratory, DRDO, Lucknow Road, Timarpur, Delhi 110 054, India<br />
b BITS Pilani Goa Campus, Goa 403726, India<br />
Received 8 November 2004; received in revised form 5 August 2005; accepted 5 August 2005<br />
Abstract<br />
We report on the structural, <strong>ferroelectric</strong> <strong>and</strong> <strong>optical</strong> <strong>properties</strong> <strong>of</strong> lead zirconate titanate (<strong>PZT</strong>) <strong>thin</strong> <strong>films</strong> (with a<br />
molar ratio <strong>of</strong> Zr:Ti::65:35) deposited by sol–gel technique on ITO-coated corning 7059 glass substrates. A seed layer <strong>of</strong><br />
PbTiO 3 (0.1 mm) was coated by sol–gel on the substrates before depositing <strong>PZT</strong>. A metal/<strong>ferroelectric</strong>/metal (MFM)<br />
structure was used for electrical property measurements, formed by depositing gold electrodes on top <strong>of</strong> the film. The<br />
<strong>films</strong> were characterized for C–V, I–V, P–E <strong>and</strong> <strong>optical</strong> transmission. Relatively low remnant polarization<br />
(P r ¼ 3:6 mC=cm 2 ) was observed for the <strong>films</strong>. Value <strong>of</strong> <strong>optical</strong> b<strong>and</strong> gap was found to be 3.4 eV. The results are<br />
discussed.<br />
r 2005 Elsevier B.V. All rights reserved.<br />
PACS: 42.55.Lt; 77.22.Ch; 77.22.Ej; 77.55.+f<br />
Keywords: <strong>PZT</strong>; Thin <strong>films</strong>; Sol–gel; Optical measurements<br />
1. Introduction<br />
Corresponding author. Tel.: +91 11 2392 1692;<br />
fax: +91 11 2391 3609.<br />
E-mail address: 628@ssplnet.org (S.K. P<strong>and</strong>ey).<br />
Lead zirconate titanate (<strong>PZT</strong>) <strong>thin</strong> <strong>films</strong> have<br />
been <strong>of</strong> great interest for many years for their<br />
applications in electronic devices, such as nonvolatile<br />
memories, infrared sensors, <strong>optical</strong> shutters,<br />
electro-optic devices, modulators, actuators,<br />
multi-layer capacitors (MLCs), etc. [1–3]. Recent<br />
research has demonstrated that electrodes made<br />
from indium tin oxide (ITO) can greatly improve<br />
the fatigue behavior <strong>of</strong> <strong>PZT</strong> in comparison with<br />
platinum electrodes. This is attributed to the<br />
ability <strong>of</strong> ITO to conduct anion vacancies, thereby<br />
dissipating space charge buildup at the capacitor–<br />
electrode interface. However, platinum has been<br />
reported to be a superior substrate by Madsen <strong>and</strong><br />
0921-4526/$ - see front matter r 2005 Elsevier B.V. All rights reserved.<br />
doi:10.1016/j.physb.2005.08.024
ARTICLE IN PRESS<br />
136<br />
S.K. P<strong>and</strong>ey et al. / Physica B 369 (2005) 135–142<br />
Weaver [4]. But for the application <strong>of</strong> the <strong>PZT</strong><br />
<strong>films</strong> in electro-optic devices, it is necessary to<br />
fabricate <strong>films</strong> having low <strong>optical</strong> losses as well as<br />
high electro-optic coefficients [3]. It has been<br />
reported that the <strong>optical</strong> loss in a <strong>PZT</strong> film is<br />
caused by the scattering <strong>of</strong> propagating light on<br />
the film surface, which is strongly dependent on<br />
the surface roughness <strong>of</strong> the film [5]. It is reported<br />
that the higher the spontaneous polarization <strong>and</strong><br />
dielectric constant, the higher the linear electrooptic<br />
coefficient <strong>of</strong> material [6]. For high remnant<br />
polarization (P r ), internal electric fields developed<br />
by charged defects near the electrodes or in the<br />
film volume are believed to play an important role<br />
in these phenomena [7,8]. Thus, correlated polarization–electric<br />
field (P–E), capacitance–voltage<br />
(C–V), <strong>and</strong> current–voltage (I–V) measurements<br />
are necessary in order to reveal the presence <strong>of</strong><br />
space charge regions (SCR) <strong>and</strong> to elucidate the<br />
problem <strong>of</strong> conduction mechanisms in <strong>PZT</strong> <strong>thin</strong><br />
<strong>films</strong> [9].<br />
A variety <strong>of</strong> techniques have been employed to<br />
fabricate <strong>PZT</strong> <strong>films</strong>, such as metallorganic chemical<br />
vapor deposition (MOCVD), sputtering, sol–<br />
gel <strong>and</strong> PLD. Among these, sol–gel method is the<br />
most popular one because <strong>of</strong> its low cost <strong>and</strong> ease<br />
<strong>of</strong> fabrication for the <strong>PZT</strong> system [10]. In the<br />
present work, we report on structural, morphological,<br />
<strong>ferroelectric</strong> <strong>and</strong> <strong>optical</strong> <strong>properties</strong> for<br />
sol–gel–grown Pb(Zr 0.65 Ti 0.35 )O 3 <strong>films</strong> with a seed<br />
layer <strong>of</strong> PbTiO 3 (deposited by sol–gel). The usage<br />
<strong>of</strong> a seed layer has been shown to be beneficial by<br />
several workers [3,11]. The possible reasons for<br />
low remnant polarization have been examined for<br />
its electro-optic usage.<br />
2. Experimental details<br />
The sol–gel <strong>PZT</strong> <strong>thin</strong> <strong>films</strong> were prepared using<br />
lead acetate tri-hydrate, zirconium-acetyl-acetonate,<br />
<strong>and</strong> titanium-isopropoxide as precursors.<br />
Acetic acid <strong>and</strong> 2-methoxy-ethanol were used<br />
as solvents. The molar ratio <strong>of</strong> Zr/Ti was kept at<br />
65/35 <strong>and</strong> a 4% excess <strong>of</strong> the lead precursor<br />
was added to the solution to compensate lead<br />
loss during heat treatment <strong>and</strong> to assist crystallization.<br />
Commercially available ITO (3000 Å)-coated<br />
corning 7059 glass was used as substrate. Seed<br />
layers <strong>of</strong> PbTiO 3 (PT) were prepared by the sol–gel<br />
technique using the above-mentioned alkoxides<br />
(0.1 mm thickness). A spin coating unit was used<br />
for the deposition <strong>of</strong> all sol–gel <strong>films</strong>. Substrates<br />
held by a vacuum-chuck were rotated at a speed <strong>of</strong><br />
2000 rpm for 20 s each. These <strong>films</strong> were pyrolyzed<br />
intermediately at 200 1 for 2 min, twice <strong>and</strong> finally<br />
at 600 1C. The seed layer was coated on all<br />
substrates prior to deposition <strong>of</strong> the <strong>PZT</strong> layers.<br />
The procedure followed for pyrolysis <strong>of</strong> <strong>PZT</strong> <strong>films</strong><br />
was the same as the one in the case <strong>of</strong> the PT seed<br />
layers. After coating the <strong>PZT</strong> layer, the final<br />
crystallization was achieved by annealing at<br />
650 1C, for 2 h in air. The details about the sol–gel<br />
technique have also been reported [12,13].<br />
The morphology <strong>of</strong> the <strong>films</strong> was characterized<br />
using atomic force microscopy (AFM, NT-MDT<br />
Solver P47 H) in the resonant mode operating at<br />
350 kHz <strong>and</strong> 38 nm amplitude. XRD patterns were<br />
recorded on a Philips <strong>thin</strong> film diffractometer<br />
(Model PW 3020) using a Cu (K a ) 1.54 A˚ X-ray in<br />
parallel beam geometry. The incident X-ray beam<br />
made an angle <strong>of</strong> 1.5 1 with the sample. A graphite<br />
monochromator was used in the secondary<br />
optics to minimize the background fluorescence/<br />
scattering.<br />
Optical transmission measurement was performed<br />
using CARY–5E UV-VIS-NIR spectrophotometer.<br />
The thickness <strong>of</strong> the film was<br />
measured from transmittance interference fringes.<br />
A sample measurement was also taken by Dektak-<br />
3 stylus pr<strong>of</strong>ilometer after making a physical step<br />
by chemical etching <strong>and</strong> compared with <strong>optical</strong>ly<br />
measured thickness value. The metal/<strong>ferroelectric</strong>/<br />
metal (MFM) structure was obtained by depositing<br />
gold top electrodes <strong>of</strong> size 500 mm with the<br />
help <strong>of</strong> shadow mask using cold DC sputtering. It<br />
is to be noted that the structure is asymmetric in<br />
terms <strong>of</strong> electrodes, the bottom one being ITO <strong>and</strong><br />
the top electrode is gold.<br />
Hysteresis loops were recorded using an automatic<br />
P–E loop tracer (RT-66A) <strong>of</strong> Radiant<br />
Technologies Inc. The remnant polarization (P r )<br />
<strong>and</strong> coercive field (E c ) were obtained from the P–E<br />
hysteresis loop.<br />
C–V measurements were done using an HP-<br />
4294A Impedance Analyser at 100 kHz with an
ARTICLE IN PRESS<br />
S.K. P<strong>and</strong>ey et al. / Physica B 369 (2005) 135–142 137<br />
oscillator level <strong>of</strong> 100mV <strong>and</strong> a delay <strong>of</strong> 2 s was<br />
used during measurement. I–V measurements were<br />
done using Keithley 428 current amplifier along<br />
with SR 830 Lock-in-Amplifier.<br />
3. Results <strong>and</strong> discussion<br />
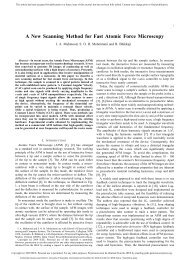
An X-ray diffractogram <strong>of</strong> <strong>PZT</strong> 65/35 <strong>thin</strong> film<br />
deposited by the sol–gel techniques is shown in<br />
Fig. 1. The XRD pattern shows the formation <strong>of</strong> a<br />
single-phase perovskite for <strong>PZT</strong> <strong>thin</strong> <strong>films</strong>. Formation<br />
<strong>of</strong> the unwanted pyrochlore phase was<br />
eliminated through a careful selection <strong>of</strong> deposition<br />
parameters. The selection <strong>of</strong> deposited parameters<br />
is based on our past experience <strong>of</strong> growing<br />
<strong>PZT</strong> <strong>thin</strong> <strong>films</strong> <strong>and</strong> from the literature available in<br />
this area. The <strong>films</strong> deposited were polycrystalline<br />
in nature. <strong>PZT</strong> <strong>films</strong> (0.5 mm thick) were deposited<br />
on ITO coated corning 7059 glass substrates<br />
by sol–gel with 0.1 mm (PbTiO 3 ) seed layer<br />
thickness. The stress in a <strong>thin</strong> film have always<br />
been the matter <strong>of</strong> considerable concern, on<br />
account <strong>of</strong> the fact that (i) thermal expansion<br />
coefficients between glass substrate <strong>and</strong> <strong>PZT</strong> film<br />
may contribute in inducing a tensile stress in the<br />
film <strong>and</strong> (ii) volume change induced by phase<br />
transition. Since the difference in thermal expansion<br />
is 1.0 10 6 /1C <strong>and</strong> is too less to cause<br />
Intensity (arb. units)<br />
(012)<br />
(110)<br />
<strong>PZT</strong>(65/35) on ITO coated glass<br />
(202)<br />
(024)<br />
(116)<br />
(018)<br />
(220)<br />
(128)<br />
20 30 40 50 60 70 80<br />
Fig. 1. X-ray diffractogram <strong>of</strong> <strong>PZT</strong> 65/35 <strong>thin</strong> <strong>films</strong> deposited<br />
by sol–gel.<br />
2θ<br />
severe cracking. The <strong>properties</strong> <strong>of</strong> the <strong>films</strong> are<br />
greatly dependent upon the effects <strong>of</strong> stress/strain<br />
in them. Although the strains in these <strong>films</strong> have<br />
not been studied in this research, it is felt the<br />
situation in polycrystalline <strong>films</strong> may be relatively<br />
lower. This is because a polycrystalline system<br />
provides for alleviation <strong>of</strong> stress through relaxation<br />
mechanisms, generally found to occur much<br />
more slowly in epitaxial <strong>films</strong>. The volume change<br />
may thus be the main reasons for the stress in the<br />
<strong>films</strong> <strong>and</strong> hence may lead to cracks also. The<br />
reason for low P r may also be attributed to<br />
cracks in the <strong>films</strong> since they are annealed at<br />
650 1C for 2 h. The <strong>PZT</strong> (Zr/Ti :: 40/60) <strong>films</strong><br />
annealed more than 10 min show cracks <strong>and</strong> are<br />
reported [3]. But authors have got better results <strong>of</strong><br />
P r <strong>and</strong> clear oriented AFM grain morphology for<br />
the <strong>PZT</strong> (65/35) <strong>films</strong> on Pt/Si substrates without<br />
cracks even after annealing at 650 1Cupto2h[13].It<br />
is to be noted that authors have used PbTiO 3 as seed<br />
layer but Kang et al. [3] have used <strong>PZT</strong> as seed layer.<br />
3.1. AFM measurements<br />
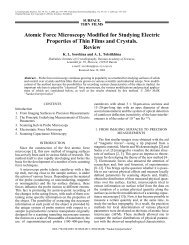
The AFM micrographs are shown in Fig. 2. The<br />
average surface roughness (R a ) in <strong>PZT</strong> <strong>films</strong><br />
deposited on ITO-coated corning 7059 substrates<br />
is 10 nm but three-dimensional (3D) picture <strong>of</strong><br />
AFM depicts a hazy <strong>and</strong> clear cracks surface <strong>and</strong><br />
no oriented growth in the film. Also, the <strong>PZT</strong>/PT/<br />
ITO/corning <strong>films</strong> surface looks hazy most probably<br />
due to the reaction <strong>of</strong> ITO with PT <strong>and</strong> <strong>PZT</strong><br />
as is also seen clearly from the transmittance<br />
curves (Fig. 5). This also could be a possible<br />
reason for the lowering <strong>of</strong> remnant polarization<br />
apart from cracks in the <strong>films</strong>. A clear grain size is<br />
expected for higher remnant polarization [13].<br />
3.2. I– V measurements<br />
The apparent decrease/change in I– V is mainly<br />
due to change in the conductivity nature <strong>of</strong> the<br />
electrode as seen in the <strong>optical</strong> transmission<br />
measurement. The results indicate the current<br />
transport through the <strong>PZT</strong> material due to field<br />
enhanced schottkey emission [9]. The results<br />
suggests that the two contacts are like back to<br />
back schottkey diode with the presence <strong>of</strong> large
ARTICLE IN PRESS<br />
138<br />
S.K. P<strong>and</strong>ey et al. / Physica B 369 (2005) 135–142<br />
Fig. 2. Atomic force micrograph (plane <strong>and</strong> 3-D views) <strong>of</strong> <strong>PZT</strong>/PT/ITO/corning glass by sol–gel.<br />
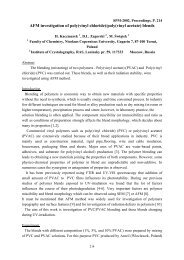
space charge region near the metal electrode<br />
(Fig. 3a <strong>and</strong> b). Sample deposited on Pt/Si shows<br />
higher conductivity compared to those deposited<br />
on ITO-coated glass. The samples deposited on<br />
ITO/ glass show shift <strong>of</strong> minimum current from<br />
0 V. This again suggests accumulation <strong>of</strong> remnant<br />
charge in the material. The remnant charge may be<br />
also due to presence <strong>of</strong> grain boundaries in the<br />
deposited materials as seen in AFM image (Fig. 2).<br />
The sample <strong>PZT</strong>/ITO shows no effect <strong>of</strong> trap<br />
free space-charge-limited current (SCLC) for<br />
which the slope ¼ 2. Instead, the slope after 5 V<br />
is much more than 2 indicating presence <strong>of</strong> traps in<br />
the material [14]. In contrast, the <strong>PZT</strong>/Pt/Si<br />
sample shows SCLC current dependence with a<br />
slope <strong>of</strong> 2 which indicates that it is a trap free<br />
material.<br />
3.3. C– V measurements<br />
The C–V curves for the <strong>films</strong> are shown in<br />
Fig. 4. The higher capacitance graph already
ARTICLE IN PRESS<br />
S.K. P<strong>and</strong>ey et al. / Physica B 369 (2005) 135–142 139<br />
Current (A)<br />
1E-4<br />
1E-5<br />
1E-6<br />
1E-7<br />
1E-8<br />
1E-9<br />
1E-10<br />
1E-11<br />
1E-12<br />
3a<br />
<strong>PZT</strong>/Pt/Si<br />
<strong>PZT</strong>/ITO<br />
1E-13<br />
-4 -2 0 2 4<br />
(a)<br />
Voltage (volts)<br />
Log (I)<br />
(b)<br />
1E-4<br />
1E-5<br />
1E-6<br />
1E-7<br />
1E-8<br />
1E-9<br />
1E-10<br />
1E-11<br />
3b<br />
Slope = 2<br />
Slope = 1<br />
<strong>PZT</strong>/Pt/Si<br />
<strong>PZT</strong>/ITO<br />
0.1 1 10<br />
Log (V)<br />
Fig. 3. (a) Current vs. voltage curves, (b) log (current) log<br />
(voltage).<br />
Capacitance (F)<br />
3.0x10 -9 <strong>PZT</strong>/ITO<br />
2.5x10 -9<br />
<strong>PZT</strong>/Pt/Si<br />
2.0x10 -9<br />
1.5x10 -9<br />
1.0x10 -9<br />
<strong>PZT</strong>/ITO/Glass<br />
5.0x10 -10<br />
-30 -20 -10 0 10 20 30<br />
Voltage (Volts)<br />
Fig. 4. Capacitance vs. voltage curves.<br />
reported [13] has been shown here for comparison.<br />
The inset in the graph shows the clear C–V graph<br />
<strong>of</strong> ITO/<strong>PZT</strong> film. The gap on Y-axes is mainly due<br />
to instrument limitations which gives values only<br />
for four cycles. If fifth cycle is done it will give a<br />
clear C– V without any gap. The shift <strong>of</strong> intersection<br />
<strong>of</strong> C–V curve at Y ¼ 0 axis is mainly due to<br />
space charge regions <strong>and</strong> DC biasing. The curve<br />
has the typical butterfly shape with two maxima<br />
that should correspond to the coercive fields. The<br />
values <strong>of</strong> voltages obtained from the two maxima<br />
<strong>of</strong> the C– V curve divided by thickness <strong>of</strong> the film<br />
should be nearly equal to twice the coercive field<br />
(E c ) <strong>of</strong> the P– E curve. A difference in the value<br />
may be attributed to the space charge regions,<br />
which could develop due to DC biasing in the C– V<br />
measurements. However, these capacitance values<br />
are much lower than our reported values for the<br />
<strong>PZT</strong> <strong>films</strong> on Pt/Si substrates [13]. Here again the<br />
possible reason for the low values <strong>of</strong> capacitance<br />
may be the electrode/<strong>PZT</strong> interaction. The C– V<br />
behavior <strong>of</strong> <strong>thin</strong>ner <strong>PZT</strong> <strong>films</strong> (thickness o50 nm)<br />
can also be understood from the semiconductor<br />
physics also. It is known that the depletion layer<br />
width (W d ) <strong>and</strong> junction capacitance (C j ) <strong>of</strong> a<br />
semiconductor/metal junction can be expressed as<br />
ðaÞ W d ¼ ½2 0 r ðV 0 þ VÞŠ 1=2<br />
½qNŠ 1=2<br />
<strong>and</strong><br />
ðbÞ C j ¼ A½q 0 r NŠ 1=2<br />
½2ðV 0 þ VÞŠ , 1=2<br />
where V is the reverse bias voltage, V 0 is the built<br />
in potential, N is the carrier concentration <strong>and</strong> e r is<br />
the dielectric constant <strong>of</strong> the material.<br />
Both these equations show the variation <strong>of</strong><br />
depletion width (W d ) <strong>and</strong> junction capacitance (C j )<br />
with the applied voltage. While applying a<br />
negative DC voltage at the bottom electrode, the<br />
space charge becomes less populated (or more<br />
depleted) near the <strong>PZT</strong>/electrode interface <strong>and</strong> this<br />
reduces the overall measured capacitance (b). As<br />
the voltage increases to about zero, the space<br />
charges become more populated (or less depleted)<br />
near both the top <strong>and</strong> bottom electrodes, thus the<br />
junction capacitance reaches a saturated value.
ARTICLE IN PRESS<br />
140<br />
S.K. P<strong>and</strong>ey et al. / Physica B 369 (2005) 135–142<br />
Therefore, a shoulder located near zero voltage is<br />
observed. As the voltage further increases to<br />
positive values, the maximum capacitance value<br />
should occur at the coercive voltage (i.e. 0.5–1 V<br />
for upward voltage sweep) because <strong>of</strong> polarization<br />
switching [15].<br />
3.4. P-E Measurements<br />
Fig. 4 shows the values <strong>of</strong> remnant polarization<br />
(P r ¼ 3:6 mC=cm 2 ) <strong>and</strong> coercive field<br />
(E c ¼ 107 kV=cm) for the <strong>films</strong> grown in this<br />
study. The higher P r value graph already reported<br />
[13] has been shown here for comparison. The<br />
inset in the graph shows the clear hysteresis <strong>of</strong> <strong>PZT</strong><br />
on ITO/glass. The P r values found in our <strong>films</strong> are<br />
relatively lower than the reported values. Also, the<br />
positive value <strong>of</strong> P r is greater than the negative<br />
value <strong>of</strong> P r . The polarization shift has been<br />
reported in ‘‘graded <strong>ferroelectric</strong>s’’ [16]. However,<br />
in a homogeneous <strong>PZT</strong> film the shift may be also<br />
due to electrode asymmetry [17]. This may be<br />
ascribed to the reaction <strong>of</strong> <strong>PZT</strong>/PT with the ITO<br />
layer as well as cracks in the <strong>films</strong> as is evident<br />
from the transmission <strong>and</strong> AFM studies. Tyunina<br />
et al. [18] reported values <strong>of</strong> P r <strong>and</strong> E c as 17 mC/<br />
cm 2 <strong>and</strong> 50 kV/cm, respectively. However, Boerasu<br />
et al. reported values <strong>of</strong> P r <strong>and</strong> E c as 9 mC/cm 2 <strong>and</strong><br />
39 kV/cm, respectively, by sol–gel. A higher P r <strong>of</strong><br />
30 mC/cm 2 for higher grain size was reported by<br />
Jang sik Lee et al. [19] on account <strong>of</strong> the larger<br />
grain size <strong>of</strong> the <strong>films</strong>. The remnant polarization<br />
(2P r )<strong>of</strong>26mC/cm 2 (for r<strong>and</strong>omly oriented <strong>films</strong>)<br />
<strong>and</strong> 46 mC/cm 2 (for <strong>films</strong> with preferred orientations)<br />
were reported by Kang et al. [3]. Authors<br />
have also reported growth <strong>of</strong> <strong>PZT</strong> <strong>films</strong> grown on<br />
Pt/Si (1 1 1) with a PT seed layer, by sol-gel showed<br />
excellent values <strong>of</strong> P r ¼ 56:8 mC=cm 2 [13].<br />
The dependence <strong>of</strong> electrical <strong>properties</strong> on a film<br />
thickness, can be explained by a model that<br />
incorporates a layer having low e in series with a<br />
normal <strong>PZT</strong> layer. The origins <strong>of</strong> the low e layers<br />
have been attributed to the following five possible<br />
mechanisms; a non-stoichiometric phase, a chemical<br />
reaction with the platinum electrode, space<br />
charge layer, stress <strong>and</strong> the size effects [20]. In the<br />
present study, <strong>of</strong> the aforementioned, it would<br />
appear that the space charge, stress <strong>and</strong> cracks<br />
have influence on the <strong>films</strong> electrical <strong>properties</strong>.<br />
Also, from the AFM data, it may be construed<br />
that there is no well-defined grain morphology<br />
observed on the surface <strong>of</strong> the <strong>films</strong> deposited on<br />
ITO-coated glass. This might be on account <strong>of</strong> the<br />
fact that the bottom electrode has seemingly<br />
interacted with the overlying <strong>PZT</strong> <strong>films</strong> deposited<br />
during the process <strong>of</strong> pyrolysis <strong>and</strong> subsequent<br />
annealing. This re-iterates the well-known fact that<br />
the interface between the substrate <strong>and</strong> the film is<br />
detrimental to the <strong>films</strong> <strong>properties</strong>. Further, it is<br />
has been reported that lead diffuses in ITO even at<br />
550 1C [4]. So, a lead diffusion in ITO could also be<br />
one <strong>of</strong> the reasons for reducing the remnant<br />
polarization.<br />
3.5. Optical measurements<br />
Optical transmittance was recorded for the <strong>PZT</strong><br />
film deposited on ITO-coated glass (Figs. 5, 6).<br />
The long wavelength absorption from 1000 to<br />
2500 nm observed for ITO glass is due to the<br />
occurrence <strong>of</strong> plasma resonance around 2500 nm.<br />
The transparency begins below the plasma resonance<br />
wavelength. It is to be noted that the same<br />
absorption is not observed for <strong>PZT</strong>-coated ITO<br />
glass. It is because the carrier concentration <strong>of</strong><br />
ITO has undergone a major reduction due to<br />
reaction <strong>of</strong> <strong>PZT</strong>/PT with ITO. Hence, the plasma<br />
resonance must have been shifted to much higher<br />
Polarisation (µC/cm 2 )<br />
100<br />
50<br />
0<br />
-50<br />
-100<br />
8<br />
6 <strong>PZT</strong> /ITO<br />
4<br />
2<br />
0<br />
2<br />
4<br />
6<br />
8<br />
300 200 100 0 100 200 300<br />
<strong>PZT</strong>/Pt/Si<br />
<strong>PZT</strong>/ITO<br />
-300 -200 -100 0 100 200 300<br />
Voltage (Volts)<br />
Fig. 5. Polarization vs. electric field hysteresis loop for <strong>PZT</strong> on<br />
ITO-coated glass.
ARTICLE IN PRESS<br />
S.K. P<strong>and</strong>ey et al. / Physica B 369 (2005) 135–142 141<br />
transmittance (%)<br />
120<br />
100<br />
80<br />
60<br />
40<br />
(1) Corning Glass<br />
(2) ITO on corning glass<br />
(3) <strong>PZT</strong> on ITO coated corning glass<br />
(2)<br />
(1)<br />
(3)<br />
(αhν) 2<br />
1.6x10 10<br />
1.2x10 10<br />
8.0x10 9<br />
4.0x10 9<br />
20<br />
0<br />
0 500 1000 1500 2000 2500 3000 3500<br />
wavelength (nm)<br />
wavelength. This is the reason for good transparency<br />
in the above-mentioned region. This must<br />
have serious implication on the performance <strong>of</strong><br />
ITO electrode. A graph between (ahn) 2 vs. hn was<br />
plotted as shown in Fig. 7 <strong>and</strong> the b<strong>and</strong> gap <strong>of</strong> the<br />
<strong>PZT</strong> film was estimated as 3.4 eV (a ¼ absorption<br />
coefficient , hn ¼ incident photon energy). This is<br />
in good agreement with a b<strong>and</strong> gap <strong>of</strong> 3.35 eV<br />
reported by Boerasu et al. [9].<br />
4. Conclusions<br />
Fig. 6. Transmittance curves for the <strong>films</strong>.<br />
<strong>Structural</strong>, morphological, <strong>ferroelectric</strong> <strong>and</strong><br />
<strong>optical</strong> <strong>properties</strong> <strong>of</strong> <strong>PZT</strong> <strong>thin</strong> <strong>films</strong> deposited on<br />
ITO-coated corning 7059 glass substrates were<br />
studied. A significant reason for low remnant<br />
polarization (P r ) was observed for <strong>PZT</strong> <strong>thin</strong> <strong>films</strong><br />
deposited on ITO-coated corning glass substrates<br />
by sol–gel technique using a seed layer <strong>of</strong> lead<br />
titanate (PbTiO 3 ). A low value <strong>of</strong> remnant<br />
polarization (P r ) was observed in the case <strong>of</strong> these<br />
<strong>films</strong>. The low value <strong>of</strong> polarization is mainly due<br />
to cracks, ITO/<strong>PZT</strong> interaction modifying the<br />
surface morphology, stress (due to volume change<br />
while phase formation) <strong>and</strong> Pb diffusion in ITO.<br />
The transmittance curves <strong>of</strong> the <strong>PZT</strong> showed a<br />
b<strong>and</strong> gap <strong>of</strong> 3.4 eV. The AFM picture shows<br />
morphology having nanosize surface roughness<br />
but unclear grain size indicative <strong>of</strong> modified <strong>PZT</strong>/<br />
PT/ITO layer structure.<br />
Acknowledgements<br />
Thanks are due to K. Zimik, Laser Science <strong>and</strong><br />
Technology Centre, Metcalfe House, Delhi for<br />
providing the AFM data <strong>and</strong> Dr. V R Balakrishnan<br />
for useful suggestions in analyzing the data.<br />
References<br />
0.0<br />
3.0 3.1 3.2 3.3 3.4 3.5 3.6<br />
hν (eV)<br />
Fig. 7. (ahn) 2 vs. hn plot showing <strong>optical</strong> b<strong>and</strong> gap.<br />
[1] J.F. Scott, L. Kammerdimer, M. Parris, S. Trayner,<br />
V. Ottenbacher, A. Shawabke, W.F. Oliver, J. Appl. Phys.<br />
64 (1988) 787.<br />
[2] M. Okuyama, Y. Matsui, H. Nakamo, Y. Hamakawa,<br />
Ferroelectrics 33 (1981) 235.<br />
[3] H.S. Kang, W.J. Lee, J. Vac. Sci. Technol. A 20 (4) (2002)<br />
1498.<br />
[4] L.D. Madsen, L. Weaver, J. Electronic Mater. 21 (1992)<br />
93.<br />
[5] D.K. Fork, F. Armani-Leplingard, J.J. Kingston, G.B.<br />
Anderson, in: B.W. Wessels, S.R. Marder, D.M. Walba<br />
(Eds.), Thin Film for Integrated Optics Applications,<br />
Materials Research Society, Pittsburgh, 1995, p. 189.<br />
[6] P. Gunter, Ferroelectrics 75 (1987) 5.<br />
[7] U. Robels, J.H. Calderwood, G. Arlt, J. Appl. Phys. 77<br />
(1995) 4002.<br />
[8] M. Grossman, O. Lohse, D. Bolten, U. Boettger,<br />
T. Schneller, R. Waser, J. Appl. Phys. 92 (2002) 2680.<br />
[9] I. Boerasu, L. Pintilie, M. Pereira, M.I. Vasilevskiy,<br />
M.J.M. Gomes, J. Appl. Phys. 93 (2003) 4776.<br />
[10] G. Yi, Z. Wu, M. Sayer, J. Appl. Phys. 64 (1988) 2717.<br />
[11] H. Du, D.W. Johnson Jr., W. Zhu, J.E. Grabner, G.W.<br />
Kammlot, S. Jin, J. Rogers, R. Willett, R.M. Fleming,<br />
J. Appl. Phys. 86 (4) (1999) 2220.<br />
[12] M. Es Souni, M. Abed, C.H. Solterbeck, A. Piorra, Mater.<br />
Sci. Eng. B 94 (2002) 229.<br />
[13] S.K. P<strong>and</strong>ey, A.R. James, C. Prakash, T.C. Goel,<br />
K. Zimik, Mater. Sci. Eng. B 112 (2004) 96.
ARTICLE IN PRESS<br />
142<br />
S.K. P<strong>and</strong>ey et al. / Physica B 369 (2005) 135–142<br />
[14] K.C. Kao, W. Hwang, Electrical Transport in Solids,<br />
Pergamon press, Oxford, Engl<strong>and</strong>, 1981.<br />
[15] S.M. Sze, Physics <strong>of</strong> Semiconductor Devices, Wiley,<br />
New York, 1981.<br />
[16] M. Brazier, M. McElfresh, S. Mansour, Appl. Phys. Lett.<br />
72 (1998) 1121.<br />
[17] K. Abe, S. Komatsu, N. Yanase, K. Sano, T. Kawakubo,<br />
Jpn. J. Appl. Phys. 36 (1) (1997) 5846.<br />
[18] M. Tyunina, J. Levoska, A. Sternberg, S. Leppavuori,<br />
J. Appl. Phys. 84 (1998) 6800.<br />
[19] J.-S. Lee, E.-C. Park, J.-H. Park, B.-I. Lee, S.-K. Joo,<br />
Ferroelectric Thin Films VIII. Symposium 217 (Mater.<br />
Res. Soc. Symp. Proceedings vol. 596).<br />
[20] C.H. Lin, P.A. Friddle, C.H. Ma, A. Daga, H. Chena,<br />
J. Appl. Phys. 90 (2001) 1509.