View PDF - The Friedman Foundation For Educational Choice
View PDF - The Friedman Foundation For Educational Choice
View PDF - The Friedman Foundation For Educational Choice

Create successful ePaper yourself
Turn your PDF publications into a flip-book with our unique Google optimized e-Paper software.
<strong>The</strong> <strong>For</strong>mula Behind Maryland’s K-12 Funding<br />
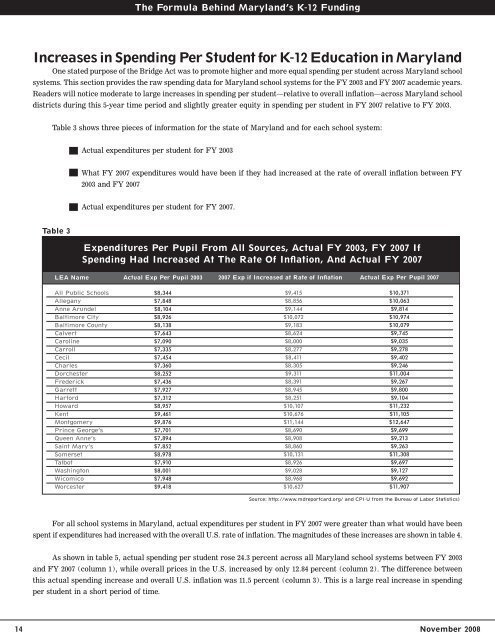
Increases in Spending Per Student for K-12 Education in Maryland<br />
One stated purpose of the Bridge Act was to promote higher and more equal spending per student across Maryland school<br />
systems. This section provides the raw spending data for Maryland school systems for the FY 2003 and FY 2007 academic years.<br />
Readers will notice moderate to large increases in spending per student—relative to overall inflation—across Maryland school<br />
districts during this 5-year time period and slightly greater equity in spending per student in FY 2007 relative to FY 2003.<br />
Table 3 shows three pieces of information for the state of Maryland and for each school system:<br />
Actual expenditures per student for FY 2003<br />
What FY 2007 expenditures would have been if they had increased at the rate of overall inflation between FY<br />
2003 and FY 2007<br />
Actual expenditures per student for FY 2007.<br />
Table 3<br />
Expenditures Per Pupil From All Sources, Actual FY 2003, FY 2007 If<br />
Spending Had Increased At <strong>The</strong> Rate Of Inflation, And Actual FY 2007<br />
LEA Name<br />
Actual Exp Per Pupil 2003<br />
2007 Exp if Increased at Rate of Inflation<br />
Actual Exp Per Pupil 2007<br />
All Public Schools<br />
Allegany<br />
Anne Arundel<br />
Baltimore City<br />
Baltimore County<br />
Calvert<br />
Caroline<br />
Carroll<br />
Cecil<br />
Charles<br />
Dorchester<br />
Frederick<br />
Garrett<br />
Harford<br />
Howard<br />
Kent<br />
Montgomery<br />
Prince George’s<br />
Queen Anne’s<br />
Saint Mary’s<br />
Somerset<br />
Talbot<br />
Washington<br />
Wicomico<br />
Worcester<br />
$8,344<br />
$7,848<br />
$8,104<br />
$8,926<br />
$8,138<br />
$7,643<br />
$7,090<br />
$7,335<br />
$7,454<br />
$7,360<br />
$8,252<br />
$7,436<br />
$7,927<br />
$7,312<br />
$8,957<br />
$9,461<br />
$9,876<br />
$7,701<br />
$7,894<br />
$7,852<br />
$8,978<br />
$7,910<br />
$8,001<br />
$7,948<br />
$9,418<br />
$9,415<br />
$8,856<br />
$9,144<br />
$10,072<br />
$9,183<br />
$8,624<br />
$8,000<br />
$8,277<br />
$8,411<br />
$8,305<br />
$9,311<br />
$8,391<br />
$8,945<br />
$8,251<br />
$10,107<br />
$10,676<br />
$11,144<br />
$8,690<br />
$8,908<br />
$8,860<br />
$10,131<br />
$8,926<br />
$9,028<br />
$8,968<br />
$10,627<br />
$10,371<br />
$10,063<br />
$9,814<br />
$10,974<br />
$10,079<br />
$9,745<br />
$9,035<br />
$9,278<br />
$9,402<br />
$9,246<br />
$11,004<br />
$9,267<br />
$9,800<br />
$9,104<br />
$11,232<br />
$11,105<br />
$12,647<br />
$9,699<br />
$9,213<br />
$9,263<br />
$11,308<br />
$9,697<br />
$9,127<br />
$9,692<br />
$11,907<br />
Source: http://www.mdreportcard.org/ and CPI-U from the Bureau of Labor Statistics)<br />
<strong>For</strong> all school systems in Maryland, actual expenditures per student in FY 2007 were greater than what would have been<br />
spent if expenditures had increased with the overall U.S. rate of inflation. <strong>The</strong> magnitudes of these increases are shown in table 4.<br />
As shown in table 5, actual spending per student rose 24.3 percent across all Maryland school systems between FY 2003<br />
and FY 2007 (column 1), while overall prices in the U.S. increased by only 12.84 percent (column 2). <strong>The</strong> difference between<br />
this actual spending increase and overall U.S. inflation was 11.5 percent (column 3). This is a large real increase in spending<br />
per student in a short period of time.<br />
14 November 2008