View PDF - The Friedman Foundation For Educational Choice
View PDF - The Friedman Foundation For Educational Choice
View PDF - The Friedman Foundation For Educational Choice

Create successful ePaper yourself
Turn your PDF publications into a flip-book with our unique Google optimized e-Paper software.
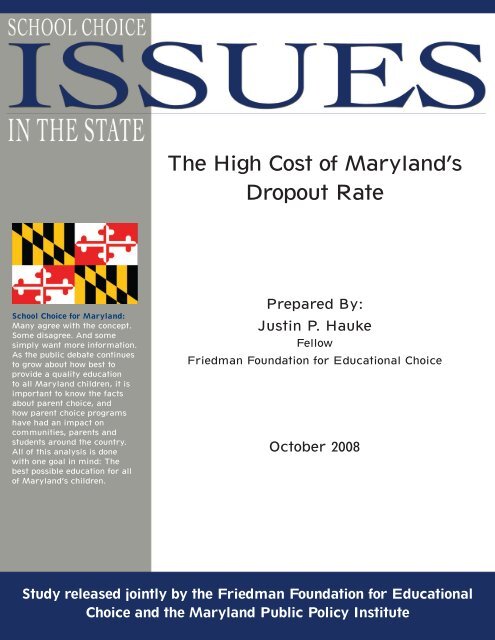
<strong>The</strong> High Cost of Maryland’s<br />
Dropout Rate<br />
School <strong>Choice</strong> for Maryland:<br />
Many agree with the concept.<br />
Some disagree. And some<br />
simply want more information.<br />
As the public debate continues<br />
to grow about how best to<br />
provide a quality education<br />
to all Maryland children, it is<br />
important to know the facts<br />
about parent choice, and<br />
how parent choice programs<br />
have had an impact on<br />
communities, parents and<br />
students around the country.<br />
All of this analysis is done<br />
with one goal in mind: <strong>The</strong><br />
best possible education for all<br />
of Maryland’s children.<br />
Prepared By:<br />
Justin P. Hauke<br />
Fellow<br />
<strong>Friedman</strong> <strong>Foundation</strong> for <strong>Educational</strong> <strong>Choice</strong><br />
October 2008<br />
Study released jointly by the <strong>Friedman</strong> <strong>Foundation</strong> for <strong>Educational</strong><br />
<strong>Choice</strong> and the Maryland Public Policy Institute
A MESSAGE FROM THE FRIEDMAN FOUNDATION:<br />
OUR CHALLENGE TO YOU<br />
Our research adheres to the highest standards of scientific rigor. We<br />
know that one reason the school choice movement has achieved such<br />
great success is because the empirical evidence really does show that<br />
school choice works. More and more people are dropping their opposition<br />
to school choice as they become familiar with the large body<br />
of high-quality scientific studies that supports it. Having racked up a<br />
steady record of success through good science, why would we sabotage<br />
our credibility with junk science?<br />
This is our answer to those who say we can’t produce credible research<br />
because we aren’t neutral about school choice. Some people think that<br />
good science can only be produced by researchers who have no opinions<br />
about the things they study. Like robots, these neutral researchers<br />
are supposed to carry out their analyses without actually thinking or<br />
caring about the subjects they study.<br />
But what’s the point of doing science in the first place if we’re never allowed<br />
to come to any conclusions? Why would we want to stay neutral<br />
when some policies are solidly proven to work, and others are proven<br />
to fail?<br />
That’s why it’s foolish to dismiss all the studies showing that school<br />
choice works on grounds that they were conducted by researchers who<br />
think that school choice works. If we take that approach, we would<br />
have to dismiss all the studies showing that smoking causes cancer,<br />
because all of them were conducted by researchers who think that<br />
smoking causes cancer. We would end up rejecting all science across<br />
the board.<br />
<strong>The</strong> sensible approach is to accept studies that follow sound scientific<br />
methods, and reject those that don’t. Science produces reliable empirical<br />
information, not because scientists are devoid of opinions and motives,<br />
but because the rigorous procedural rules of science prevent the<br />
researchers’ opinions and motives from determining their results. If<br />
research adheres to scientific standards, its results can be relied upon<br />
no matter who conducted it. If not, then the biases of the researcher<br />
do become relevant, because lack of scientific rigor opens the door for<br />
those biases to affect the results.<br />
So if you’re skeptical about our research on school choice, this is our<br />
challenge to you: prove us wrong. Judge our work by scientific standards<br />
and see how it measures up. If you can find anything in our work<br />
that doesn’t follow sound empirical methods, by all means say so. We<br />
welcome any and all scientific critique of our work. But if you can’t find<br />
anything scientifically wrong with it, don’t complain that our findings<br />
can’t be true just because we’re not neutral. That may make a good<br />
sound bite, but what lurks behind it is a flat rejection of science.
<strong>The</strong> High Cost of<br />
Maryland’s Dropout Rate<br />
Prepared By:<br />
Justin P. Hauke<br />
Fellow<br />
<strong>Friedman</strong> <strong>Foundation</strong> for <strong>Educational</strong> <strong>Choice</strong><br />
October 2008
Issues in the State<br />
Promising Start: An Empirical Analysis of How Ed<strong>Choice</strong> Vouchers Affect Ohio Public Schools<br />
August 2008<br />
Lost Opportunity: An Empirical Analysis of How Vouchers Affected Florida Public Schools<br />
March 2008<br />
<strong>The</strong> High Cost of High School Failure in New Jersey<br />
February 2008<br />
<strong>The</strong> Fiscal Impact of a Tuition Assistance Grant for Virginia’s Special Education Students<br />
April 2007<br />
Utah Public Education Funding: <strong>The</strong> Fiscal Impact of School <strong>Choice</strong><br />
January 2007<br />
<strong>The</strong> High Cost of Failing to Reform Public Education in Indiana<br />
October 2006<br />
Segregation Levels in Milwaukee Public Schools and the Milwaukee Voucher Program<br />
August 2006<br />
Florida’s Public Education Spending<br />
January 2006<br />
Spreading Freedom and Saving Money: <strong>The</strong> Fiscal Impact of the D.C. Voucher Program<br />
January 2006<br />
<strong>The</strong> Constitutionality of School <strong>Choice</strong> in New Hampshire<br />
May 2005<br />
An Analysis of South Carolina per Pupil State Funding<br />
February 2004<br />
A Guide to Understanding State Funding of Arizona Public School Students<br />
January 2004<br />
<strong>The</strong> Effects of Town Tuitioning in Vermont and Maine<br />
January 2002<br />
<strong>For</strong> a complete listing of the foundation’s research please visit our web site at www.friedmanfoundation.org.
Executive Summary<br />
<strong>The</strong>re is a divide in Maryland’s schools. Although the state’s high school graduation rate is above the national average, its<br />
urban school districts have suffered from years of decline. In 2007, the Baltimore city school district’s graduation rate was only<br />
35 percent, compared to 81.5 percent in Baltimore’s suburbs and 76 percent statewide. <strong>The</strong> divide between urban and suburban<br />
graduation rates in Maryland is the highest in the nation. Among the nation’s 100 largest school districts, Baltimore has the 98thlowest<br />
graduation rate.<br />
This study documents the public costs of high school dropouts in Maryland. We examine how Maryland’s decreasing graduation<br />
rates are materially affecting the state’s finances through reduced tax revenues, increased Medicaid costs and higher incarceration<br />
rates. This study examines how increased competition from private schools could raise public school graduation rates and save<br />
Maryland taxpayers millions of dollars each year.<br />
Key findings of this study include:<br />
Each year’s class of dropouts will cost Maryland taxpayers $42 million every year.<br />
About 27,000 Maryland students in the class of 2007 failed to graduate from high school. Independent estimates suggest<br />
that the state’s overall graduation rate is about 76 percent but urban graduation rates are well below 50 percent.<br />
On average, Maryland’s 393,200 working-age dropouts earn nearly $10,000 less a year than the state’s high school<br />
graduates, reducing overall state income by nearly $4 billion a year. Maryland dropouts can expect to earn $150,000<br />
less in their lifetimes than high school graduates.<br />
Every additional Maryland high school dropout costs the state approximately $1,555 a year in lost revenue, with total<br />
lifetime costs (in present value) of $35,180.<br />
<strong>The</strong>se cost estimates include only lost revenue from state taxes, increased Medicaid costs and increased incarceration<br />
costs. Because high school dropouts incur many other public costs, the true costs of Maryland’s high school dropouts<br />
are much higher.<br />
Maryland’s high school graduation rates are declining, even as the national graduation rate has been rising, indicating<br />
that dropout-related costs to Maryland taxpayers will increase each year.<br />
Expanded school choice programs improve public schools and produce millions of dollars in taxpayer savings every year.<br />
School districts with greater numbers of students in private schools have higher public school graduation rates.<br />
All Maryland children would benefit from increased competition from private schools.<br />
<strong>The</strong> beneficial effect of private school competition on public schools is large enough that even a modest school<br />
choice program could save Maryland taxpayers millions of dollars each year. <strong>For</strong> example, a 6 percent increase<br />
in Maryland’s statewide graduation rate would save Maryland taxpayers more than $5 million a year.
About the Author<br />
Justin P. Hauke is a securities analyst working in Chicago. He previously worked as an economic research analyst at the Federal<br />
Reserve Bank of St. Louis, where he helped develop econometric financial models and assisted with the bank’s monetary policy<br />
research. He later joined the Show-Me Institute, a Missouri-based free market think tank, where he conducted studies on Missouri<br />
education and tax policy. He has testified before the Missouri General Assembly on the economic impact of school choice<br />
programs. His research on Missouri public policy has been covered in newspapers across the state, including the St. Louis Post-<br />
Dispatch, the Kansas City Star and the Columbia Daily Tribune. He holds a bachelor’s degree in economics and mathematics<br />
from the University of Texas at Austin and a master’s degree in finance from Washington University in St. Louis.<br />
<strong>Friedman</strong> <strong>Foundation</strong> for <strong>Educational</strong> <strong>Choice</strong><br />
<strong>The</strong> <strong>Friedman</strong> <strong>Foundation</strong> for <strong>Educational</strong> <strong>Choice</strong>, dubbed “the nation’s leading voucher advocates” by the Wall<br />
Street Journal, is a nonprofit organization established in 1996. <strong>The</strong> origins of the foundation lie in the <strong>Friedman</strong>s’<br />
long-standing concern about the serious deficiencies in America’s elementary and secondary public schools. <strong>The</strong><br />
best way to improve the quality of education, they believe, is to enable all parents with the freedom to choose<br />
the schools that their children attend. <strong>The</strong> <strong>Friedman</strong> <strong>Foundation</strong> builds upon this vision, clarifies its meaning to<br />
the public and amplifies the national call for true education reform through school choice.<br />
Maryland Public Policy Institute<br />
Founded in 2001, the Maryland Public Policy Institute is a nonpartisan public policy research and education<br />
organization that focuses on state policy issues. Our goal is to provide accurate and timely research<br />
analysis of Maryland policy issues and market these findings to key primary audiences.
Acknowledgements<br />
<strong>The</strong> author would like to thank Greg <strong>For</strong>ster and Christian D’Andrea of the <strong>Friedman</strong> <strong>Foundation</strong>, Brian Gottlob of PolEcon Research,<br />
Jason Hannasch at the Show-Me Insitute and Dr. Michael Podgursky at the University of Missouri.
Table of Contents<br />
Introduction<br />
Dropouts in Maryland: An Urgent Problem With Serious Consequences<br />
Dropouts Cost Maryland Taxpayers Millions of Dollars Every Year<br />
Maryland Dropouts Earn $10,000 Less Each Year<br />
Lower Earnings Reduce Dropouts’ Lifetime Earnings Potential by $150,000<br />
Dropouts Reduce Maryland Tax Revenues by $193 Million a Year<br />
Dropouts Have Poorer Health and Are More Likely to Use Medicaid<br />
Maryland Dropouts Are Twice as Likely to Be Incarcerated<br />
Maryland Spends $1,555 on Each Dropout Every Year<br />
<strong>The</strong> Public Benefits of School <strong>Choice</strong> in Maryland<br />
Private School Competition Improves Public School Graduation Rates<br />
School <strong>Choice</strong> Programs Could Save Maryland Taxpayers Millions of Dollars<br />
Conclusions<br />
Endnotes<br />
10<br />
10<br />
12<br />
13<br />
14<br />
16<br />
17<br />
20<br />
22<br />
22<br />
23<br />
23<br />
24<br />
25
<strong>The</strong> High Cost of Maryland’s Dropout Rate<br />
Introduction<br />
Education reform is a crucial issue in Maryland. State lawmakers have taken steps to reexamine the declining graduation rates of the<br />
state’s public schools in the face of decreasing public education performance. In the 2008 legislative session, several bills were introduced<br />
to address education accountability and to provide more educational options. Recent studies by the Maryland Public Policy Institute have<br />
helped document the decline in Maryland public education and have raised public awareness of the need for school choice reform. 1<br />
<strong>The</strong> individual consequences of not completing high school—lower wages, higher unemployment rates, etc.—are clear. But less<br />
emphasis has been placed on the cost to society of declining graduation rates. A growing number of high school dropouts have both direct<br />
and indirect fiscal effects on Maryland taxpayers. Lower rates of labor-force participation, higher rates of unemployment and lower wages<br />
and salaries of those employed all are consequences of the failure of individuals to obtain a high school diploma. <strong>The</strong>se consequences<br />
affect all Maryland residents, depressing overall wage and job growth and imposing a fiscal drag on state expenditures associated with<br />
increased spending on social programs. Higher levels of education lead to positive effects on society in the form of reduced levels of public<br />
welfare programs, better health, lower crime rates and increased productivity.<br />
Little effort has been made to estimate the actual cost of Maryland high school dropouts beyond the traditional costs attributable to<br />
each individual dropout. Policy-makers agree that the general public must have a better understanding of the costs of the current system<br />
and of the myriad education reforms proposed.<br />
This study addresses several critical education reform issues pertinent to the Maryland debate. By estimating some of the public<br />
costs associated with declining graduation rates, this paper ideally will serve as a catalyst for education reform by highlighting the fiscal<br />
consequences of inaction. This study will also document the improved fiscal and social outcomes associated with existing private school<br />
competition and the likely outcomes of expanded school choice in Maryland.<br />
Previous research has found that school choice programs are effective in saving taxpayer money as well as expanding existing<br />
opportunities for children with the greatest educational needs. One analysis found that $444 million was saved nationally from 1990 to 2006<br />
because of school choice programs. 2 Existing tax-credit scholarship programs have been shown to save taxpayers in Pennsylvania, Arizona,<br />
Florida and elsewhere millions of dollars annually. 3 This study explores how expanded school choice may benefit Maryland taxpayers by<br />
improving high school graduation rates and reducing expenditures on social welfare programs, freeing up additional resources to be used<br />
toward educating students who remain in the public school system. 4<br />
Dropouts in Maryland: An Urgent Problem With Serious Consequences<br />
Over the past decade, increased attention has been focused on the declining graduation rates of America’s public high schools. Last<br />
year, the Editorial Projects in Education Research Center released a database of new high school retention figures that highlighted the<br />
extent of this problem and the degree to which many states have been underreporting official dropout rates.<br />
<strong>The</strong> data show that only 70 percent of high school students nationwide graduate from high school. More than half of these dropouts<br />
come from large urban “dropout factory” districts—including Baltimore—that have graduation rates below 50 percent. In fact, the Baltimore<br />
city school district, at 35 percent, has one of the lowest graduation rates in the country, ranking 98th among the nation’s 100 largest urban<br />
school districts. 5 U.S. Secretary of Education Margaret Spellings said of the data:<br />
We are finally moving from a state of denial to a state of acknowledgment [regarding high school graduation<br />
rates]. It’s hard to believe such a pervasive problem has remained in the shadows for so long. 6<br />
If current dropout rates continue, more than 50,000 of the 80,000 students who attend Baltimore city schools will fail to<br />
graduate. Currently, nearly 12 percent of Maryland’s working-age adults are high school dropouts. Figure 1, which shows the<br />
number of Maryland residents ages 20-64 (i.e., working age) by educational achievement, indicates that 393,200 adults across<br />
the state do not have a high school diploma. 7<br />
10 October 2008
<strong>The</strong> High Cost of Maryland’s Dropout Rate<br />
Figure 1<br />
Maryland Residents, Age 20-64<br />
Ph.D./Prof.<br />
151,701<br />
Master’s<br />
347,368<br />
Bachelor’s<br />
703,617<br />
Assoc.<br />
269,233<br />
Some College<br />
620,440<br />
HS Grads<br />
971,348<br />
Dropouts<br />
393,200<br />
0 200,000 400,000 600,000 800,000 1,000,000 1,200,000<br />
MARYLAND RESIDENTS AGE 20-64 BY EDUCATIONAL ATTAINMENT<br />
Source: U.S. Census Current Population Survey, March Supplement (2006, 2007) and author’s calculations<br />
Figure 2<br />
Maryland Graduation Rates are Lower than Reported<br />
100%<br />
REPORTED MARYLAND HIGH SCHOOL GRADUATION RATES<br />
90%<br />
86%<br />
80%<br />
79%<br />
75%<br />
74%<br />
74%<br />
70%<br />
70%<br />
60%<br />
50%<br />
40%<br />
MD Dept. of<br />
Education<br />
NCES<br />
Manhattan<br />
Institue<br />
Higher Education<br />
Information Services<br />
EPE<br />
Urban Institute<br />
Source: Maryland State Department of Education and independent research organizations<br />
October 2008<br />
11
<strong>The</strong> High Cost of Maryland’s Dropout Rate<br />
Moreover, many states and school districts significantly over-report their actual high school graduation rates, so the numbers<br />
reported in Figure 1 likely are understated. In Maryland, for example, state officials measure graduation rates based on the number<br />
of students who have officially dropped out of school. This method is accepted by the federal government for compliance with<br />
the No Child Left Behind Act but has been criticized by academic researchers. Maryland counts students as dropouts only if they<br />
officially register their withdrawal with the individual school in which they were enrolled. <strong>The</strong>se official withdrawals are accepted<br />
only if a parent has consented or the student is 18 or older. Consequently, official withdrawals are rare and most “official” state<br />
graduation rates are biased upward.<br />
Figure 2 compares Maryland’s officially reported high school graduation rate for the 2004-2005 academic school year with<br />
those of various independent educational research groups. 8 Independent estimates by the National Center for Education Statistics,<br />
the Manhattan Institute, the Higher Education Information Service, the Editorial Projects in Education Research Center (EPE)<br />
and the Urban Institute all indicate that Maryland’s graduation rates are much lower than officially reported. An average of these<br />
estimates puts Maryland’s graduation rate at close to 75 percent, more than 10 percentage points lower than the rate officially<br />
reported by the Maryland Department of Education. 9<br />
<strong>The</strong> EPE, known for the accuracy of its graduation rates, developed estimates for Maryland using a method known as the<br />
“cumulative promotion index,” which seeks to track student progress through the education system over time. 10 Figure 3 uses<br />
estimates from the EPE data to highlight the decline in Maryland’s high school graduation rate from 2001 to 2006. Although more<br />
recent figures are not yet available, a regression of Maryland’s graduation rates since 1995 against a linear time trend suggests<br />
that the state’s graduation rate is declining at a rate of 0.54 percent a year. Such a decrease would suggest that Maryland’s current<br />
graduation rate is likely below that of the national average.<br />
Figure 3<br />
Maryland High School Graduation Rates are Declining<br />
78<br />
Maryland<br />
U.S. Average<br />
76<br />
74<br />
72<br />
70<br />
68<br />
66<br />
2001 2002 2003 2004 2005 2006 2007 2008<br />
Source: EPE Education Week and author’s calculations<br />
Dropouts Cost Maryland Taxpayers Millions Every Year<br />
It is well documented that the level of education achieved is an important predictor of an individual’s future economic<br />
12 October 2008
<strong>The</strong> High Cost of Maryland’s Dropout Rate<br />
success. <strong>For</strong> the nearly 400,000 Maryland residents 20 to 64 years old who lack a high school diploma, the consequences of<br />
dropping out of school are clear. In 2007, 58,178 Maryland students graduated from high school. An estimated additional 26,997<br />
students should have graduated. <strong>The</strong> annual increase in high school dropouts highlights the importance of educational reform<br />
and the continual drain on public resources incurred by the state’s declining graduation rate. This section will document some<br />
of the individual consequences of dropping out of high school.<br />
Table 1 summarizes the effect of different levels of education on Maryland residents. <strong>The</strong> table indicates that residents<br />
without a high school diploma are less likely to be in the labor force and are more likely to be unemployed. <strong>The</strong>se individuals<br />
earn significantly less each year than high school graduates and are more likely to collect Medicaid benefits for themselves<br />
or a dependent child. Dropouts are also more likely to be incarcerated than high school graduates.<br />
Table 1<br />
Maryland Life Outcomes by <strong>Educational</strong> Achievement (Age 20-64)<br />
Dropouts<br />
HS<br />
Grads<br />
Some<br />
College<br />
Assoc.<br />
Degree<br />
Bachelor’s<br />
Degree<br />
Master’s<br />
Degree<br />
Ph.D./<br />
Prof.<br />
Percent in labor force<br />
68.8%<br />
79.9%<br />
75.7%<br />
84.0%<br />
85.9%<br />
88.9%<br />
80.7%<br />
Unemployment rate<br />
7.8%<br />
4.0%<br />
5.1%<br />
2.7%<br />
1.8%<br />
0.3%<br />
3.4%<br />
Annual earnings, total (gross)<br />
$16,570<br />
$26,216<br />
$28,415<br />
$35,271<br />
$51,732<br />
$66,466<br />
$38,580<br />
Percent on Medicaid or with child on Medicaid<br />
23.3%<br />
17.7%<br />
12.1%<br />
10.4%<br />
5.0%<br />
3.2%<br />
13.1%<br />
Incarceration rates (males only)<br />
White<br />
Hispanic<br />
0.93%<br />
2.00%<br />
0.39%<br />
1.2%<br />
0.27%<br />
NA<br />
0.08%<br />
NA<br />
ALL COLLEGE<br />
GRADS COMBINED<br />
African-American<br />
4.11%<br />
2.35%<br />
2.15%<br />
0.75%<br />
Source: U.S. Census Current Population Survey, March Supplement (2006, 2007) and author’s calculations<br />
Maryland Dropouts Earn $10,000 Less Each Year<br />
Figure 4 shows that high school dropouts are less likely to be in the labor force (working or looking for work) than those with<br />
higher education attainment. Dropouts who are in the labor force have the highest level of unemployment. <strong>The</strong> chart indicates that<br />
only 61 percent of high school dropouts are employed, while 31 percent are either unable to work or have stopped looking for work<br />
(and thus considered to be out of the labor force) and nearly 8 percent are unemployed. 11 Figure 5 indicates that high school dropouts<br />
are nearly twice as likely to be unemployed as high school graduates. <strong>The</strong> unemployment rate for high school dropouts in Maryland<br />
is 8 percent, compared to the state average of 3 percent. 12<br />
Figure 6 demonstrates the relationship between educational achievement and employment compensation in Maryland. A high<br />
school dropout can expect to earn nearly $10,000 less per year than a high school graduate. <strong>The</strong> wage difference between higher levels<br />
of educational achievement reflects the consequences of lower-paying jobs, lower labor-force participation and lower employment<br />
rates of high school dropouts.<br />
<strong>The</strong> difference in annual earnings between high school dropouts and high school graduates in Maryland suggest that state income<br />
was nearly $4 billion less than it would have been otherwise had each of its working age adults earned a high school diploma.<br />
October 2008<br />
13
<strong>The</strong> High Cost of Maryland’s Dropout Rate<br />
Figure 4<br />
Maryland Dropouts are Less Likely to be Employed<br />
Not in the Labor <strong>For</strong>ce<br />
Unemployed<br />
Working<br />
100%<br />
90%<br />
80%<br />
31%<br />
18%<br />
3%<br />
13%<br />
1%<br />
70%<br />
8%<br />
60%<br />
50%<br />
40%<br />
30%<br />
61%<br />
80%<br />
83.8%<br />
20%<br />
10%<br />
0%<br />
DROPOUTS HS GRADS 4-YR. COLLEGE<br />
DEGREE<br />
Source: U.S. Census Current Population Survey, March Supplement (2006, 2007) and author’s calculations<br />
Figure 5<br />
High School Dropouts are More Likely to be Unemployed<br />
MARYLAND UNEMPLOYMENT RATES BY EDUCATIONAL ATTAINMENT<br />
Master’s<br />
0.6%<br />
Bachelor’s<br />
Assoc.<br />
1.8%<br />
2.7%<br />
Some College<br />
HS Grads<br />
5.1%<br />
4.0%<br />
Dropouts<br />
7.8%<br />
0% 3% 6%<br />
9% 12%<br />
Source: U.S. Census Current Population Survey, March Supplement (2006, 2007) and author’s calculations<br />
Lower Earnings Reduce Dropouts’ Lifetime Earnings Potential by $150,000<br />
One of the most important concepts in economics is the power of compound interest. Small savings that earn modest<br />
14 October 2008
<strong>The</strong> High Cost of Maryland’s Dropout Rate<br />
rates of interest over 40 or 50 years can translate into sizable sums. <strong>The</strong>refore the earnings disparity illustrated in Figure 6<br />
becomes even more dramatic once we consider the effect over a high school dropout’s lifetime.<br />
Figure 6<br />
Maryland Dropouts Earn Almost $10,000 Less per year<br />
Ph.D./Prof.<br />
$98,509<br />
Master’s<br />
Bachelor’s<br />
$51,732<br />
$66,466<br />
Assoc.<br />
Some College<br />
HS Grads<br />
Dropouts<br />
$35,271<br />
$28,415<br />
$26,216<br />
$16,570<br />
0 20,000 40,000 60,000 80,000 100,000 1200,000<br />
MARYLAND RESIDENTS AGE 20-64 BY EDUCATIONAL ATTAINMENT<br />
Figure 7<br />
Source: U.S. Census Current Population Survey, March Supplement (2006, 2007) and author’s calculations<br />
Impact on Lifetime Wealth of High School Dropouts<br />
$450,000<br />
HS Dropout<br />
HS Graduate<br />
$375,000<br />
Cumulative Wealth<br />
$300,000<br />
$225,000<br />
$150,000<br />
$75,000<br />
$0<br />
18 21 24 27 30 33 36 29 42 45 48 51 54 57 60 63<br />
Source: U.S. Census Current Population Survey, March Supplement (2006, 2007) and author’s calculations<br />
October 2008<br />
15
<strong>The</strong> High Cost of Maryland’s Dropout Rate<br />
Figure 7 plots the potential increase in accumulated lifetime wealth of a high school graduate, compared to that of a<br />
high school dropout. In both cases, it is assumed that the individuals begin their working career at age 18 and retire at age<br />
65, earning the average annual salary of their demographic (i.e., $16,570 for high school dropouts and $26,216 for high school<br />
graduates) every year. In addition, it is assumed that both individuals are able to invest 5 percent of their gross income every<br />
year in a benchmark 70/30 stock/bond portfolio earning the historical rate of return. 13 Ignoring the impact of taxes and inflation<br />
on the portfolios, the increased wages of high school graduates translate into more than $150,000 in expected lifetime wealth<br />
potential than the portfolios of high school dropouts. A Monte Carlo simulation of the returns suggests that a high school<br />
graduate is 71 percent likely to accumulate more than $100,000 in lifetime wealth than a high school dropout. 14<br />
A more profound effect is the lifetime impact of a single high school dropout on the Maryland economy. Over the course<br />
of a high school dropout’s working career, the multiplier impact of the foregone $10,000 in additional annual income translates<br />
into more than $3 million in lost revenues. This $3 million could have been reinvested in the Maryland economy, fueling job<br />
and wage growth and overall productivity. Furthermore, Table 2 suggests that the aggregate annual income lost by Maryland’s<br />
393,200 working-age high school dropouts amounts to $3.8 billion in lost wages every year.<br />
Table 2<br />
Impact of Maryland High School Dropouts on State Income (Age 20-64)<br />
Education Level<br />
Population<br />
Average Earnings<br />
Total Earnings<br />
($ millions)<br />
No Dropouts [All Become HS Grads]<br />
($ millions)<br />
Dropouts<br />
393,200<br />
$16,570<br />
$6,515<br />
$0<br />
HS Grads<br />
971,348<br />
$26,216<br />
$25,465<br />
$35,772<br />
Some College<br />
620,440<br />
$28,415<br />
$17,630<br />
$17,630<br />
Associate’s Degree<br />
269,233<br />
$35,271<br />
$9,496<br />
$9,496<br />
Bachelor’s Degree<br />
703,617<br />
$51,732<br />
$36,399<br />
$36,399<br />
M.A./Ph.D./Prof.<br />
499,069<br />
$76,206<br />
$38,032<br />
$38,032<br />
Total<br />
3,456,907<br />
$38,629<br />
$133,537 million<br />
$137,330 million<br />
Difference<br />
$3,793 million<br />
Source: U.S. Census Current Population Survey, March Supplement (2006, 2007) and author’s calculations<br />
Dropouts Reduce Maryland Tax Revenues by $193 Million a Year<br />
<strong>The</strong> higher incomes of high school graduates described above have significant public consequences as well. Bettereducated<br />
individuals increase the productivity of Maryland’s economy and their contributions create a larger tax base. Higher<br />
graduation rates would provide additional tax and fee revenues to state and local governments.<br />
Data on the average earnings of working-age Maryland high school dropouts and graduates from the March CPS<br />
Supplement for 2006 and 2007 were used to calculate hypothetical tax liabilities using the “TAXSIM” model. This model,<br />
developed by the National Bureau of Economic Research, estimates a taxpayer’s federal and state income tax liabilities.<br />
Because of the complexity of the Maryland tax code, however, several simplifying assumptions were made to facilitate the<br />
analysis and to provide direct comparisons.<br />
Without data on spousal income, all taxpayers were treated as single taxpayers. This analysis also assumed that no<br />
16 October 2008
<strong>The</strong> High Cost of Maryland’s Dropout Rate<br />
taxpayers took advantage of idiosyncratic tax exemptions or credits (e.g., student loan interest or environmental tax credits). Because<br />
data on the individual taxpayers’ mortgage interest or property tax deductions were not available, it also was assumed that taxpayers<br />
were not homeowners. All income was treated as wage income since dividend, capital gains and interest income are taxed differently.<br />
<strong>The</strong> 2006 tax year was used as our basis, as it provides the most recent data.<br />
State tax liabilities were calculated for taxpayers with and without dependent-child exemptions and the number of returns were<br />
weighted according to the percentage of dropouts with and without dependent children, as indicated by Current Population Survey data. 15<br />
Although these are not precise tax liabilities, the TAXSIM estimates approximate the first-order effects of the tax cost of high school<br />
dropouts. As a result, the difference from the true income-tax costs associated with the earnings differential should be insignificant.<br />
Table 3 summarizes the lost tax revenues associated with Maryland’s high school dropouts. <strong>The</strong> income tax figure was calculated<br />
by computing the difference between graduate and non-graduate tax liabilities and then multiplying this difference by the number of<br />
working-age high school dropouts. <strong>The</strong> sales tax revenue was approximated based on the empirical data that show about 70 percent<br />
of Marylanders’ gross income is spent on consumption goods, of which about 50 percent are subject to sales tax. 16 <strong>The</strong> difference in<br />
gross income between dropouts and high school graduates was multiplied by this approximation based on the state sales tax rate of 6<br />
percent. 17<br />
Table 3 indicates that the lower earnings of Maryland’s working-age dropouts result in state income tax revenues that are $113<br />
million lower than they would be if all residents had obtained at least a high school diploma. <strong>The</strong> total annual tax revenue loss associated<br />
with the state’s existing high school dropouts is about $193 million (or about $490 per dropout), including $80 million in lost sales tax<br />
revenue. This amounts to about 5 percent of the state’s total 2007 general revenue education appropriation. 18<br />
Table 3<br />
Cost of Maryland High School Dropouts on State Tax Revenues<br />
Dependent Exemptions<br />
Total Income<br />
No Children<br />
1 Child<br />
2 or More Children<br />
HS Grads<br />
$26,216<br />
$983.76<br />
$404.40<br />
$0<br />
Dropouts<br />
$16,570<br />
$525.58<br />
$0<br />
$0<br />
Difference<br />
X<br />
Dropouts<br />
$458.18<br />
131,065<br />
$404.40<br />
131,065<br />
131,065<br />
Lost Income Tax Revenue<br />
-$64,618,586<br />
-$54,411,730<br />
-$30,527,126<br />
Total Lost Income Tax Revenue: $112,942,430<br />
Other Lost Tax & Fee Revenue: $79,648,951<br />
Total Annual Revenue Loss: $192,591,381<br />
Source: National Bureau of Economic Research TAXSIM model and author’s calculations<br />
Dropouts Have Poorer Health and Are More Likely to Use Medicaid<br />
Maryland residents who fail to obtain a high school diploma are at a much greater risk of reliance on safety-net programs such<br />
as Medicaid, Temporary Assistance to Needy Families, housing assistance and food stamps. <strong>The</strong> probability of being a beneficiary of<br />
one or more public-assistance programs increases dramatically for individuals who do not have a high school diploma.<br />
Dropouts increase the cost of state and federal health care programs because they are less likely to be covered by employers’<br />
health insurance or other privately provided programs. This is due to the fact that dropouts are less likely to be employed and<br />
October 2008<br />
17
<strong>The</strong> High Cost of Maryland’s Dropout Rate<br />
their low income levels qualify them for public welfare assistance. Moreover, uninsured dropouts increase health care premiums for all<br />
Marylanders by increasing the percentage of “uncompensated care” throughout the health care system. Uncompensated care increases<br />
the cost of health insurance premiums because it shifts the burdens of health care costs for those who can’t afford insurance onto the<br />
individuals and providers who pay for health care coverage.<br />
Figure 8 confirms that dropouts are a bigger health liability than Maryland residents with higher levels of educational achievement.<br />
Working-age dropouts in Maryland are, on average, in poorer health than the average state resident. Because high school dropouts are<br />
more likely to use public welfare programs to treat their health problems (discussed below), the general ill health of Maryland’s dropouts<br />
translates indirectly into higher costs for the health care system in Maryland in general.<br />
Figure 8<br />
High School Dropouts Generally Have Poorer Health<br />
50%<br />
Health of Maryland Residents<br />
40%<br />
30%<br />
20%<br />
10%<br />
Dropouts<br />
HS Grads<br />
Bachelor’s<br />
MA/PhD./Prof.<br />
0%<br />
Excellent Very Good Good Fair Poor<br />
Source: U.S. Census Current Population Survey, March Supplement (2006, 2007) and author’s calculations<br />
Perhaps the most direct public cost of dropout health care, however, is the impact that dropouts have on the state share of Medicaid<br />
contributions. More than 709,000 state residents received some form of Medicaid compensation in 2007, for a total federal and state cost<br />
of $5 billion (or an average of $7,334 per recipient). Medicaid costs are shared between the state and federal governments, with the state<br />
of Maryland paying about half the cost in 2007. 19 About 13 percent of Maryland’s adults were enrolled in one or more Medicaid benefit<br />
programs in 2007, making health care expenditures the second-largest gross spending category by the Maryland state government.<br />
<strong>Educational</strong> achievement and the probability of receiving Medicaid assistance are closely associated. Figure 9 provides a breakdown<br />
of Medicaid recipients by educational achievement and the resulting probability of receiving Medicaid assistance. <strong>The</strong> chart suggests that<br />
dropouts have a 23 percent probability of receiving Medicaid assistance. This probability drops to 17 percent for high school graduates<br />
and to less than 2 percent for Marylanders with post-graduate degrees. More than 200,000 Maryland dropouts receive Medicaid assistance,<br />
composing more than a quarter of the state’s total Medicaid patients.<br />
<strong>The</strong> CPS often underestimates the number and percentage of public-assistance recipients because of limitations on the individuals<br />
included in its samples. 20 As a result these costs should be seen as conservative.<br />
18 October 2008
<strong>The</strong> High Cost of Maryland’s Dropout Rate<br />
Figure 9<br />
Maryland Dropouts Have a Higher Probability of Utilizing Medicaid<br />
25%<br />
20%<br />
Probability of Receiving<br />
Medicaid Benefits in Maryland<br />
# of Medicaid Beneficiaries<br />
in Maryland<br />
250,000<br />
200,000<br />
15%<br />
150,000<br />
10%<br />
100,000<br />
5%<br />
50,000<br />
0%<br />
Dropouts HS Grads Some College Assoc. Bachelor’s Master’s Ph.D./Prof.<br />
0<br />
Source: U.S. Census Current Population Survey, March Supplement (2006, 2007) and author’s calculations<br />
Table 4<br />
Cost of Maryland High School Dropouts on State Medicaid Costs<br />
(all dollar figures in millions)<br />
Population<br />
Percent On or<br />
w/ Child on<br />
Medicaid<br />
Number On<br />
or w/Child<br />
on Medicaid<br />
Total Cost =<br />
Recipients x<br />
Average Cost<br />
State Share<br />
of Costs<br />
Number on<br />
Medicaid if All<br />
Graduated<br />
Total Cost =<br />
Recipients x<br />
Average Cost<br />
State Share<br />
of Medicaid<br />
Costs<br />
Dropouts<br />
393,200<br />
12.34%<br />
48,525<br />
$356M<br />
$178M<br />
0<br />
$0<br />
$0<br />
HS Grads<br />
971,348<br />
6.54%<br />
63,536<br />
$466M<br />
$233M<br />
89,255M<br />
$655M<br />
$327M<br />
Some College<br />
620,440<br />
4.26%<br />
26,424<br />
$194M<br />
$97M<br />
26,424M<br />
$194M<br />
$97M<br />
Associate’s Degree<br />
269,233<br />
2.31%<br />
6,226<br />
$46M<br />
$23M<br />
6,226M<br />
$46M<br />
$23M<br />
Bachelor’s Degree<br />
703,617<br />
1.40%<br />
9,867<br />
$72M<br />
$36M<br />
9,867M<br />
$72M<br />
$36M<br />
Post-graduate degree<br />
499,069<br />
0.48%<br />
2,381<br />
$17M<br />
$9M<br />
2,381M<br />
$17M<br />
$9M<br />
Total<br />
3,456,907<br />
156,959<br />
$1,151M<br />
$56M<br />
134,153M<br />
$984M<br />
$492M<br />
Annual Medicaid Cost of Dropouts<br />
22,806M<br />
$167M<br />
$84M<br />
Source: U.S. Census Current Population Survey, March Supplement (2006, 2007) and author’s calculations<br />
October 2008<br />
19
<strong>The</strong> High Cost of Maryland’s Dropout Rate<br />
To estimate the Medicaid costs associated with Maryland’s high school dropouts, we used CPS data to estimate the<br />
likelihood of an individual receiving Medicaid benefits. We then considered the difference in Medicaid recipients if all high<br />
school dropouts instead had received a diploma. <strong>The</strong> decline in Medicaid recipients was multiplied by the state’s average cost<br />
of Medicaid funding, not including the costs of elderly and disabled recipients—who put the greatest costs on the system—or<br />
administrative costs.<br />
Table 4 presents an estimate of the corresponding reduction in state Medicaid costs associated with a zero dropout rate.<br />
This table suggests that, if all working-age Maryland dropouts had received a high school diploma instead of dropping out of<br />
school, Maryland would have 22,806 fewer Medicaid recipients and save $82 million a year. However, because the CPS is known<br />
to underestimate the true number of Medicaid recipients, these figures should be seen as conservative.<br />
Maryland Dropouts Are Twice as Likely to Be Incarcerated<br />
Maryland spent about $1 billion, or 4 percent of the state budget, on criminal-incarceration costs in 2008. <strong>The</strong> state’s<br />
total incarceration costs average $31,200 per inmate a year ($6,312 of which is spent on variable costs e.g., food and medical<br />
costs), making the state one of the more expensive prison systems in the country. 21<br />
Although the probability of any one high school dropout being incarcerated is small, it is twice as high as it would<br />
be if the individual had earned a high school diploma. Our study estimated the incarceration costs associated with high<br />
school dropouts by relying on the difference in probability of being incarcerated associated with higher levels of educational<br />
achievement. Because of data limitations associated with incarceration rates, we were able to consider only the impact of male<br />
incarcerations in the cost estimates. <strong>The</strong> Maryland corrections system is populated primarily by males (about 85 percent),<br />
so this assumption will have little impact on the implied cost estimates. 22 Figure 10 shows the probability of white, Hispanic<br />
and African-American male dropouts being incarcerated at some point during their lifetime.<br />
Figure 10<br />
Dropouts are Twice as Likely to be Incarcerated<br />
5%<br />
4%<br />
White Males<br />
Hispanic Males<br />
African-American Males<br />
3%<br />
2%<br />
1%<br />
0%<br />
Dropouts HS Grads Some College College +<br />
Note: Data were unavailable for Hispanics with postsecondary education. Incarceration rates provided by Lochner and Moretti (2001).<br />
20 October 2008
<strong>The</strong> High Cost of Maryland’s Dropout Rate<br />
Since the CPS does not survey incarcerated or institutional participants, we relied on indirect estimates of Maryland criminal<br />
activity and incarceration rates from previous research. 23 <strong>The</strong>se estimates determined the likely number of Maryland dropouts from<br />
the 2007 graduating class who could be expected to be incarcerated at some point during their working-age lifetimes. We used data<br />
on the types of crime, average sentence length and average sentence served to construct a “weighted average” sentence that reflects<br />
the expected length of incarceration per incident. 24 This weighted average calculation suggests that the average prison time served<br />
per conviction is 7.5 years. This number was multiplied by the average annual variable cost per inmate ($6,312), and then multiplied<br />
again by our expected number of incarcerations.<br />
Like the Medicaid cost estimates, this cost calculation can be interpreted as conservative since it ignores many of the actual<br />
public costs of crime, such as the additional policing costs imposed on society and the administrative and capital costs associated<br />
with the criminal justice system in general. Moreover, these estimates do not consider the actual property, emotional and physical<br />
damages resulting from individual crimes.<br />
To account for the additional recidivism cost of crime—the tendency of convicted criminals to offend again—the final costs<br />
were multiplied by 0.6. <strong>The</strong> recidivism cost has been noted to be a particularly important cost factor in studies on the societal impact<br />
of crime. 25<br />
Table 5<br />
Cost of Maryland High School Dropouts on State Incarceration Rates<br />
Academic School Year<br />
Total Graduates<br />
Dropouts<br />
Graduation Rate (All Races Combined) 68.30%<br />
African American Male 61.60%<br />
2007<br />
58,168<br />
26,997<br />
Hispanic Male 63.30%<br />
White Male 80.30%<br />
Number of African-American Dropouts<br />
Percentage of African-American Dropouts<br />
Number of Hispanic Dropouts<br />
Percentage of Hispanic Male Dropouts<br />
Number of White Dropouts<br />
Percentage of White Male Dropouts<br />
Expected Incarcerations from Dropouts<br />
African-American<br />
Hispanic<br />
White<br />
Total Incarcerations<br />
Expected Incarcerations for w/out Dropouts<br />
African-American<br />
Hispanic<br />
White<br />
Total Incarcerations<br />
Projected Incarceration Costs ($ million)<br />
Projected Incarceration Costs no Dropouts ($ million)<br />
Incarceration Cost per Dropout<br />
Difference<br />
13,815<br />
38.10%<br />
2,799<br />
8.30%<br />
6,821<br />
47.80%<br />
568<br />
56<br />
63<br />
687<br />
325<br />
34<br />
27<br />
385<br />
$52.33 M<br />
$29.30M<br />
$23.02M<br />
$853<br />
Source: Lochner and Moretti (2001) and author’s calculations<br />
October 2008<br />
21
<strong>The</strong> High Cost of Maryland’s Dropout Rate<br />
Table 5 estimates the impact dropouts have on annual incarceration costs. Because Maryland does not report dropout rates<br />
by race, sex or ethnicity, we used the independent estimates reported by the Editorial Projects in Education Research Center. 26 This<br />
provided a basis for calculating the number of male dropouts for each demographic based on the composition of the graduating<br />
student body as a whole. 27 <strong>The</strong> next step was to calculate the probability of incarceration in any given year for each dropout of the<br />
graduation class, producing an estimate of the total number of expected incarcerations each year. <strong>The</strong>se estimates were compared<br />
with estimates of the expected number of incarcerations had each high school dropout graduated instead.<br />
Table 5 shows that the 2007 class of dropouts is expected to produce 687 incarcerations each year over the course of the class’s<br />
working career (about 50 years). However, if each of those dropouts had graduated instead, Maryland could expect only 385 incarcerations<br />
per high school class. This reduction in incarcerations would translate to savings of about $23 million annually, or about $853 per<br />
dropout. As the size of the dropout cohort increases, these costs will increase.<br />
Maryland Spends $1,555 on Each Dropout Every Year<br />
<strong>The</strong> sections above document some of the most direct costs associated with high school dropouts. An estimated 26,997 Maryland<br />
students failed to graduate from high school in 2007. Some of these dropouts will incur public costs amounting to tens of thousands of<br />
dollars while others may incur very little or no direct costs on Maryland taxpayers. To account for these differences, the costs associated<br />
with high school dropouts can be averaged across the entire dropout population to arrive at an average expected cost per dropout.<br />
Table 6<br />
Maryland Annual and Lifetime Costs per Dropout<br />
Lost state tax revenue $ 490<br />
Incarceration costs $ 853<br />
Medicaid costs $ 213<br />
Annual state cost per dropout $ 1,555<br />
Lifetime cost per dropout * $ 35,180<br />
* Lifetime cost per dropout expressed in present value<br />
Table 6 summarizes the “per dropout” costs associated with lower tax revenues, higher Medicaid spending and additional<br />
incarceration costs. <strong>The</strong>se figures suggest that each high school dropout will cost Maryland taxpayers $1,555 a year, incurring total lifetime<br />
costs of $35,180 (in present value). 28 This results in an annual $50 million social cost liability for the entire class of 2007 dropouts.<br />
It is important to note that these cost estimates should be considered a conservative benchmark; the true costs associated<br />
with Maryland’s high school dropout rate are much higher. <strong>The</strong> costs considered for this study are associated only with reduced tax<br />
revenue and higher spending on Medicaid and incarceration, not those associated with a slower economic growth rate or those paid<br />
by Marylanders indirectly or by the federal government.<br />
<strong>The</strong> Public Benefits of School <strong>Choice</strong> in Maryland<br />
Advocates of competition in education generally believe that not only will children who participate in school choice programs<br />
benefit, but that the overall productivity of public schools subjected to competition will increase as well. Nevertheless, most research<br />
on school choice initiatives focuses specifically on the effects on students participating in school choice programs. A more complete<br />
characterization of the effects of school choice, however, would include the impact on public schools. As this study has highlighted,<br />
the public costs associated with high school dropouts in Maryland are significant. <strong>The</strong>refore, if competition from private schools leads<br />
22 October 2008
<strong>The</strong> High Cost of Maryland’s Dropout Rate<br />
to higher public school graduation rates, the resulting public benefits will be significant. This section attempts to assess the potential<br />
impact of a modest school choice program in Maryland.<br />
Private School Competition Improves Public School Graduation Rates<br />
Assessing the impact of competition from private schools on nearby public school graduation rates require sophisticated<br />
statistical methods. 29 Few studies have employed methods rigorous enough to sufficiently control for confounding influences and thus<br />
estimate the true relationship. <strong>The</strong> main difficulty is that private schools typically do not appear randomly; rather, the demand for<br />
private schools arises partly in response to public school quality. In statistical terminology, the number of private school students and<br />
public school quality are “simultaneously determined.” Studies that look at the simple relationship between the percentage of private<br />
school students in an area and public school quality could thus draw the inaccurate conclusion that a high percentage of private school<br />
students in a district results in lower public school quality.<br />
But some studies have employed adequate methods and provide a growing body of evidence that competition from private schools<br />
improves achievement in neighboring public schools. Caroline Hoxby provides a review of this evidence. 30 Perhaps the best-designed<br />
study was conducted by Thomas Dee, 31 who used data from all U.S. counties from the National Center for Education Statistics’ Common<br />
Core of Data and found that most studies of the relationship between competition and public school graduation rates “dramatically<br />
underestimate the effect of competition from private schools on the rate of high school completion in public schools.” Dee’s results<br />
indicate that an increase in the percentage of students enrolled in private schools equal to one standard deviation (or about 6 percentage<br />
points of total enrollment in Maryland), is associated with a 1.7 percent decline in the overall public school dropout rate and a 3.4<br />
percent decline in districts where at least 20 percent of students are non-white.<br />
About 17.5 percent of Maryland students (or 178,081 students) are enrolled in private schools. However, there are large discrepancies<br />
in private school enrollment among Maryland counties. <strong>For</strong> example, only 9 percent of students in Queen Anne County are enrolled in<br />
private schools while more than 25 percent of students in Talbot County are so enrolled. In general, the percentage of students enrolled<br />
in private schools is higher in larger communities, with a standard deviation of enrollment among Maryland counties of 6 percent. 32<br />
Uncertainty about the accuracy of Maryland’s district-reported graduation rates (as discussed above) makes it difficult to perform<br />
an analysis of the relationship between competition in education and public school graduation rates. <strong>The</strong>refore, we employed a range<br />
of estimates produced by research conducted in other states and nationally. 33 This created an estimate that private school enrollment<br />
causes public school graduation rates to increase 2.4 percentage points (low impact) to 4.8 percentage points (high impact) for every<br />
one standard deviation (6 percent) increase in Maryland private school enrollment. <strong>The</strong>se estimates fall between the national results<br />
obtained in Dee’s study for other states.<br />
School <strong>Choice</strong> Programs Could Save Maryland Taxpayers Millions of Dollars<br />
<strong>The</strong> previous sections detailed the public costs of Maryland dropouts. <strong>The</strong>refore we can assess the impact of improved public<br />
school competition on state graduation rates to determine the cost benefits of an expanded school choice program in Maryland. Based<br />
on our estimates of per-student dropout costs and national estimates of the impact of private school enrollment on public school<br />
graduation rates, we found that increasing the total number of Maryland students enrolled in private schools by 6 percent (60,888<br />
students) would create:<br />
A statewide reduction of between 2,891 and 5,592 high school dropouts each year, based on the low- and high-impact estimates<br />
suggested by the positive benefits of increased public school competition.<br />
Combined public savings and increased revenue of $4.5 million to $9 million a year, the result of increased tax revenues and<br />
lower Medicaid and incarceration spending. As mentioned above, the annual savings likely would be even larger since high<br />
school dropouts have many additional social costs other than those considered above.<br />
Total public benefits of $270 million to $522 million over an expected lifetime of 60 years for each class of dropouts, based on<br />
average annual savings projections. <strong>The</strong> present value of these lifetime benefits, discounted at 4 percent each year (10-year<br />
October 2008<br />
23
<strong>The</strong> High Cost of Maryland’s Dropout Rate<br />
Treasury yield), is $102 million to $197 million, or about $93,300 ($35,180 in present value) in lifetime savings per dropout.<br />
Table 7 summarizes the public benefits associated with an expanded school choice program in Maryland. <strong>The</strong> savings realized<br />
ultimately depend on the size of the school choice program; that is, as the role of school choice is expanded, the annual social benefits<br />
will be greater. Moreover, many school choice programs have been shown to have direct fiscal benefits that are independent of the<br />
reduction in the number of public school dropouts. 34 Thus the ultimate benefits to Maryland taxpayers will be much larger than those<br />
considered in Table 7.<br />
Table 7<br />
<strong>The</strong> Public Benefits of a School <strong>Choice</strong> Program in Maryland<br />
Total Public Enrollment Grades 1-12<br />
Cohort of Potential Graduates<br />
Current Annual Dropouts<br />
Increase in % of New Jersey Students in Private Schools<br />
Annual Dropout Reduction<br />
Annual Public Benefits From Increase in School Competition<br />
Lifetime Public Benefits of 5.99 Percent Increase in Competition<br />
Lifetime Benefits Discounted to Present Value (at 4% per Year)<br />
838,955<br />
58,168<br />
26,997<br />
6 percentage points<br />
Low Impact Estimate<br />
High Impact Estimate<br />
Low Impact Estimate<br />
High Impact Estimate<br />
Low Impact Estimate<br />
High Impact Estimate<br />
Low Impact Estimate<br />
High Impact Estimate<br />
2,891.05<br />
5,592.26<br />
$4,496,536<br />
$8,697,815<br />
$269,734,750<br />
$521,757,778<br />
$101,705,690<br />
$196,733,031<br />
Average Lifetime Public Benefit of Reducing Each Dropout<br />
Average Lifetime Public Benefit of Reducing Each Dropout<br />
$93,300<br />
$35,180<br />
Source: Dee (1998) and author’s calculations<br />
Conclusions<br />
This study examined the cost of Maryland’s declining high school graduation rates. <strong>The</strong> analysis considered only the most<br />
direct costs associated with lower graduation rates. It is important to understand that these cost estimates only scratch the surface.<br />
<strong>The</strong> failure to educate Maryland’s children has a destabilizing effect on Maryland society, and results in numerous second-order and<br />
indirect cost effects. However, even the most visible costs described above emphasizes the need for educational reform and the fiscal<br />
cost of inaction.<br />
Each student who fails to graduate from high school produces a direct cost on Maryland taxpayers through lower tax revenues<br />
coupled with greater social costs, such as higher Medicaid and criminal incarceration appropriations. Recognizing these costs is<br />
important to understand the benefits of introducing more competition into public education in Maryland. Research suggests that<br />
expanding school choice programs in Maryland would significantly improve public high school graduation rates in a cost-effective way.<br />
Introducing educational competition would have a profound impact on reducing the costs associated with high school dropouts.<br />
Most importantly, school choice programs would provide meaningful choices for low-income families and would provide large<br />
public benefits equal to or greater than those realized by the students themselves.<br />
24 October 2008
Endnotes<br />
1<br />
See Lake, Allison. “Education Tax Credits and the BOAST Tax Credit Proposal,” Maryland Public Policy Institute, March 2007. Online at: http://tinyurl.<br />
com/6jcmnw.<br />
2<br />
See Aud, Susan L. “Education by the Numbers: <strong>The</strong> Fiscal Effect of School <strong>Choice</strong> Programs, 1990-2006,” <strong>The</strong> <strong>Friedman</strong> <strong>Foundation</strong>, April 2007.<br />
3<br />
See Podgursky, Michael; Brosky, Sarah, and Hauke, Justin P. “<strong>The</strong> Fiscal Impact of a Tuition Tax Credit Program in Missouri,” <strong>The</strong> Show-Me Institute,<br />
January 2008.<br />
4<br />
See Education Week at the EPERC. Online at: http://tinyurl.com/6q3nl3.<br />
5<br />
See Swanson, Christopher B. “Cities in Crisis: A Special Analytic Report on High School Graduation,” EPE Research Center, April 2008. Online at:<br />
http://tinyurl.com/23ttck.<br />
6<br />
See de Vise, Daniel. “New Figures Show High Dropout Rate,” Washington Post, May 10, 2007. Online at: http://tinyurl.com/347c4u.<br />
7<br />
U.S. Census Bureau, Current Population Survey, March 2007 Supplement. <strong>The</strong> CPS is known to understate dropout numbers because it does not sample<br />
populations in institutions (such as prisons) and because it does not distinguish between those who obtain a General <strong>Educational</strong> Development diploma<br />
and those who graduate from high school with a diploma. Research suggests that the labor market outcomes of a GED student are more similar to those<br />
of a dropout than a high school graduate, so the distinction is important. Since the CPS counts GED diploma recipients as high school graduates, its data<br />
will underreport the true public costs of Maryland’s high school dropouts.<br />
8<br />
Note that 2004-2005 was the most recent academic year in which all sources were comparable. <strong>The</strong> NCES and Urban Institute figures, however, are<br />
estimates derived from 2002-2003 academic year data, although the findings were published in 2006.<br />
9<br />
<strong>The</strong> Maryland Department of Education indicates that 3.54 percent of students in Maryland public schools drop out in any given year, suggesting a high<br />
school graduation dropout rate of approximately 85 percent. <strong>For</strong> further details, see the Maryland Department of Education School Fact Book, 2006-2007.<br />
10<br />
<strong>The</strong> cumulative promotion index method for calculating graduation rates is a widely accepted method used to estimate the numbers of students who<br />
fall off track for earning a diploma at various points between the ninth grade and the expected time of graduation.<br />
11<br />
Throughout this paper unless otherwise noted, I constrain the Maryland population sample size to reflect working age adults (i.e., ages 20-64). Analyzing<br />
the full state population would bias interpretation, since retired and younger Americans are not in the workforce and would present the illusion of lower<br />
labor force participation rates (among other consequences).<br />
12<br />
Unemployment rates differ in Figure 5 from those reported in Figure 4 because Figure 4 reported aggregate unemployment rates, i.e. the aggregate<br />
unemployment rate for all individuals with the reported level of educational achievement or higher. <strong>The</strong> state unemployment rate is for working-age<br />
adults (i.e., age 20-64).<br />
13<br />
I use the average annual returns of the S&P 500 and the iShares Lehman Aggregate Bond Index from 1950-2007 and 2001-2007, respectively, as a proxy<br />
for the respective stock/bond indices. Both indices are widely accepted as benchmark standards for their respective asset classes.<br />
14<br />
A Monte Carlo simulation is a statistical test that simulates thousands of potential asset returns, based on historical moments (i.e., the mean and<br />
volatility of the returns), in order to construct a distribution of potential portfolio outcomes.<br />
15<br />
Note that in this analysis I have aggregated all taxpayers with dependent children together into one group. <strong>The</strong> greater the number of children a taxpayer<br />
has, the higher the per-child tax exemptions. But for the income range considered, the difference between one or more children would have a negligible<br />
impact on the individual’s state income tax liability and therefore is immaterial.<br />
16<br />
See Brookings Institution, “Don’t Buy the Sales Tax,” Feb. 4, 1998, online at: http://www.brookings.edu/papers/1998/03taxes_gale.aspx.<br />
17<br />
Office of the Comptroller of Maryland, General Sales and Use Tax Levy.<br />
18<br />
Details of the Maryland budget can be found online at: http://tinyurl.com/5d862g.<br />
19<br />
See the Maryland Department of Health and Mental Health Fact Sheet, online at: http://tinyurl.com/5sk53l.<br />
20<br />
See Callahan, C., et.al., “A Longitudinal Model of Health Insurance, An Update: Employer Sponsored Insurance, Medicaid, and the Uninsured,” U.S.<br />
Department of Health and Human Services, working paper, 2005. Here (and throughout this paper) I am indebted to Brian J. Gottlob of PolEcon Research<br />
for his knowledge of and direction in using CPS data for economic analysis.<br />
21<br />
Details of Maryland incarceration and budget costs can be found online at http://mlis.state.md.us/2008rs/fnotes/bil_0003/hb0073.pdf and http://www.<br />
dpscs.state.md.us/aboutdpscs/statistics.shtml.<br />
22<br />
Maryland Department of Public Safety and Correctional Services Offender Characteristics, 2007. Online at: http://tinyurl.com/55oyrk.<br />
23<br />
Lochner, L., and Moretti, E. “<strong>The</strong> Effect of Education on Crime: Evidence from Prison Inmates, Arrests, and Self Reports,” National Bureau of Economic<br />
Research, Working Paper #8605, 2001.<br />
24<br />
<strong>The</strong> Maryland Department of Public Safety and Correctional Services provide in-depth details on the breakdown of criminal sentences by five-year<br />
increments in its 2000 annual report. I extrapolate from that report to construct a weighted-average criminal sentence of 16.4 years. (Details of the report<br />
are available online at: http://tinyurl.com/5rqjod.) In addition, the Maryland State Commission on Criminal Sentencing Policy found that the average<br />
Maryland inmate serves only 46 percent of his initial sentence before being released on parole or another form of community rehabilitation. Details of the<br />
report can be found online at: http://tinyurl.com/6lejg6.<br />
25<br />
See Gottlob, Brian J. “<strong>The</strong> High Cost of South Carolina’s Low Graduation Rate,” <strong>The</strong> <strong>Friedman</strong> <strong>Foundation</strong>, June 2007. <strong>The</strong> probability that a released<br />
prisoner will return to prison within five years is closer to 40 percent, but as the above-referenced study notes, a higher percentage of inmates have more<br />
than one subsequent incarceration and longer sentences. <strong>The</strong>refore, a single recidivism cost of 0.6 appears to be more appropriate.<br />
26<br />
Note that the most recent EPERC graduation rates are for the 2005 academic year, and therefore there is a discrepancy between actual graduation<br />
rates and academic year. However, graduation rates vary little from year to year, so the effect of this discrepancy should be small.<br />
27<br />
This may not be an exact 1:1 relationship but the true ratio should have little impact on the ultimate incarceration cost estimates.<br />
28<br />
This present value calculation assumes that all high school dropouts will retire at age 65. I used a discount rate of 4 percent, equal to the approximate<br />
yield of the current 10-year Treasury note, a common benchmark.<br />
29<br />
This section borrows heavily from Gottlob, Brian J. “<strong>The</strong> High Cost of South Carolina’s Low Graduation Rate,” <strong>The</strong> <strong>Friedman</strong> <strong>Foundation</strong>, June 2007.<br />
30<br />
Hoxby, C. “School <strong>Choice</strong> and Competition: Evidence from the United States,” Swedish Economic Policy Review, 10 (2003).<br />
31<br />
Dee, T. “Competition and Quality of Public Schools,” Economics of Education Review, 17 (1998), pp. 419-427.<br />
32<br />
All data and figures from this paragraph were obtained from the U.S. Census, as compiled and reported by the Maryland Department of Business and<br />
Economic Development. Online at: www.choosemaryland.org.<br />
33<br />
Brian J. Gottlob of PolEcon Research has conducted extensive research on the impact of state graduation rates in the following states: Missouri, Indiana,<br />
New Hampshire, North Carolina, South Carolina, New Jersey and Texas.<br />
34<br />
See Podgursky, Michael; Brosky, Sarah, and Hauke, Justin P. “<strong>The</strong> Fiscal Impact of a Tuition Tax Credit Program in Missouri,” <strong>The</strong> Show-Me Institute,<br />
January 2008.
THE FRIEDMAN FOUNDATION WELCOMES YOUR SUPPORT<br />
As a nonprofit 501(c)(3) organization, we rely solely on the generous support of our donors to continue promoting the <strong>Friedman</strong>’s vision for<br />
school choice throughout the country. Please send your tax-deductible gift today and help interject liberty and choice into our education system.<br />
Giving parents the freedom to choose the school that works best for their children is our goal, and with your help we can make it happen.<br />
Dr. Rose D. <strong>Friedman</strong>, Chairperson<br />
Dr. Milton <strong>Friedman</strong>, Founder<br />
Nobel Laureate and Founder of the <strong>Friedman</strong> <strong>Foundation</strong><br />
BOARD OF DIRECTORS<br />
Noted Economist and Founder of the <strong>Friedman</strong> <strong>Foundation</strong><br />
Professor, Santa Clara University<br />
THE FRIEDMAN FOUNDATION WELCOMES YOUR SUPPORT<br />
Gordon St. Angelo<br />
William J. Hume<br />
As a nonprofit 501(c)(3) organization, we President rely solely & CEO<br />
on the generous support Chairman of our of donors the Board, to Basic continue American, promoting Inc.<br />
the <strong>Friedman</strong>’s vision for<br />
school choice throughout the country. Janet Please F. Martel, send Vice your Chairperson<br />
tax-deductible gift today and help Samuel interject H. Husbands, liberty Jr.<br />
and choice into our education system.<br />
Attorney<br />
President, Husbands Capital Markets<br />
Giving parents the freedom to choose the school that works best for their children is our goal, and with your help we can make it happen.<br />
Lawrence A. O’Connor, Jr., Treasurer<br />
Executive Director, Butler Business Accelerator<br />
Dr. David D. <strong>Friedman</strong><br />
Sandra Jordan<br />
Owner & Creative Director, Jordan Winery<br />
Charles H. Brunie<br />
Brunie Associates<br />
Howard S. Rich<br />
Rich & Rich<br />
Dr. Patrick Byrne<br />
Fred Reams<br />
Chairman of the Board and President, Overstock.com<br />
Dr. Milton <strong>Friedman</strong>, Founder Reams Asset Management<br />
Nobel Laureate and Founder of the <strong>Friedman</strong> <strong>Foundation</strong><br />
Robert C. Enlow<br />
Dr. Michael Walker<br />
Executive Director & COO<br />
Senior Fellow, <strong>The</strong> Fraser Institute<br />
BOARD OF DIRECTORS<br />
Dr. Rose D. <strong>Friedman</strong>, Chairperson<br />
Dr. David D. <strong>Friedman</strong><br />
Dr. Rose D. <strong>Friedman</strong>, Co-Chairperson<br />
Noted Economist and Founder of the <strong>Friedman</strong> <strong>Foundation</strong><br />
Professor, Santa Clara University<br />
Noted Economist and Founder of the <strong>Friedman</strong> <strong>Foundation</strong><br />
Gordon St. Angelo<br />
William J. Hume<br />
Dr. Patrick Byrne, Co-Chairperson<br />
President & CEO<br />
Chairman of the Board, Basic American, Inc.<br />
Chairman of the Board and President, Overstock.com<br />
Janet F. Martel, Vice Chairperson<br />
Samuel H. Husbands, Jr.<br />
Gordon St. Angelo<br />
Attorney<br />
President, Husbands Capital Markets<br />
President & CEO<br />
Lawrence A. O’Connor, Jr., Treasurer<br />
Sandra Jordan<br />
Janet F. Martel, Vice Chairperson<br />
Executive Director, Butler Business Accelerator<br />
Owner & Creative Director, Jordan Winery<br />
Attorney<br />
Charles H. Brunie<br />
Howard S. Rich<br />
Lawrence A. O’Connor, Jr., Treasurer<br />
Brunie Associates<br />
Rich & Rich<br />
Executive Director, Butler Business Accelerator<br />
Dr. Patrick Byrne<br />
Fred Reams<br />
Charles H. Brunie<br />
Chairman of the Board and President, Overstock.com<br />
Reams Asset Management<br />
Brunie Associates<br />
Robert C. Enlow<br />
Dr. Michael Walker<br />
Executive Director & COO<br />
Robert C. Enlow<br />
Senior Fellow, <strong>The</strong> Fraser Institute<br />
Executive Director & COO<br />
Dr. David D. <strong>Friedman</strong><br />
Professor, Santa Clara University<br />
William J. Hume<br />
Chairman of the Board, Basic American, Inc.<br />
Samuel H. Husbands, Jr.<br />
President, Husbands Capital Markets<br />
Sandra Jordan<br />
Owner & Creative Director, Jordan Winery<br />
Howard S. Rich<br />
Rich & Rich<br />
Fred Reams<br />
Reams Asset Management<br />
Dr. Michael Walker<br />
Senior Fellow, <strong>The</strong> Fraser Institute
<strong>Friedman</strong> <strong>Foundation</strong> for <strong>Educational</strong> <strong>Choice</strong><br />
One American Square, Suite 2420<br />
Indianapolis, IN 46282<br />
Phone: 317-681-0745 • Fax: 317-681-0945<br />
www.friedmanfoundation.org<br />
Maryland Public Policy Institute<br />
1 Research Court, Suite 450<br />
Rockville, MD 20850<br />
Phone: 240-686-3510 • Fax: 240-686-3511<br />
www.mdpolicy.org<br />
One American Square, Suite 2420<br />
Indianapolis, IN 46282<br />
Nonprofit Org.<br />
U.S. Postage<br />
PAID<br />
Indianapolis, IN<br />
Permit #8478