Memo - The Friedman Foundation For Educational Choice
Memo - The Friedman Foundation For Educational Choice
Memo - The Friedman Foundation For Educational Choice

You also want an ePaper? Increase the reach of your titles
YUMPU automatically turns print PDFs into web optimized ePapers that Google loves.
Date: April 23, 2013<br />
To:<br />
All Interested Parties<br />
From:<br />
Re:<br />
Paul DiPerna, <strong>Friedman</strong> <strong>Foundation</strong> (paul@edchoice.org)<br />
Findings from the Texas K-12 & School <strong>Choice</strong> Survey<br />
Overview<br />
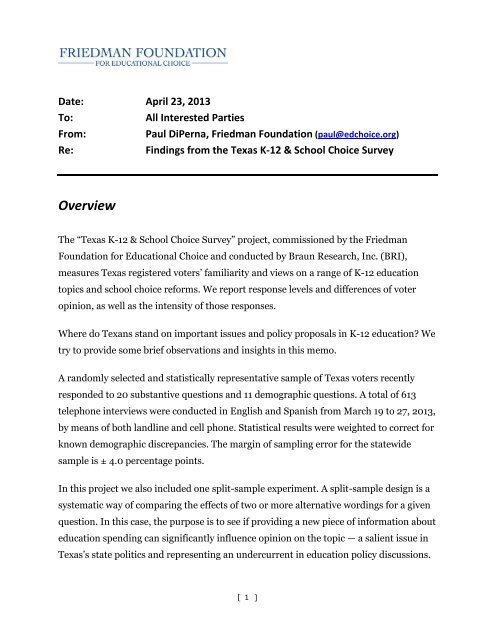
<strong>The</strong> “Texas K-12 & School <strong>Choice</strong> Survey” project, commissioned by the <strong>Friedman</strong><br />
<strong>Foundation</strong> for <strong>Educational</strong> <strong>Choice</strong> and conducted by Braun Research, Inc. (BRI),<br />
measures Texas registered voters’ familiarity and views on a range of K-12 education<br />
topics and school choice reforms. We report response levels and differences of voter<br />
opinion, as well as the intensity of those responses.<br />
Where do Texans stand on important issues and policy proposals in K-12 education? We<br />
try to provide some brief observations and insights in this memo.<br />
A randomly selected and statistically representative sample of Texas voters recently<br />
responded to 20 substantive questions and 11 demographic questions. A total of 613<br />
telephone interviews were conducted in English and Spanish from March 19 to 27, 2013,<br />
by means of both landline and cell phone. Statistical results were weighted to correct for<br />
known demographic discrepancies. <strong>The</strong> margin of sampling error for the statewide<br />
sample is ± 4.0 percentage points.<br />
In this project we also included one split-sample experiment. A split-sample design is a<br />
systematic way of comparing the effects of two or more alternative wordings for a given<br />
question. In this case, the purpose is to see if providing a new piece of information about<br />
education spending can significantly influence opinion on the topic — a salient issue in<br />
Texas’s state politics and representing an undercurrent in education policy discussions.<br />
[ 1 ]
Key Findings:<br />
Nearly three out of four registered voters in Texas (74%) are paying<br />
attention to issues in K-12 education. Roughly one-quarter of voters<br />
(25%) said they pay “very little” or no attention.<br />
See Question 1<br />
Voters who said they pay “a lot” of attention (45%) to K-12 education issues<br />
outnumber those who said they pay no attention (9%) by five-to-one.<br />
Parents of school-age children are clearly engaged. 1 About half of parents (64%) in<br />
the survey said they pay “a lot” of attention to education issues, a figure that is nearly<br />
twice as large as the proportion of non-parents (35%) giving the same response.<br />
Middle-age voters (ages 35 to 54) pay closer attention to these issues than<br />
younger voters (age 18 to 34) and older voters (age 55 or older). About 55% of<br />
middle-age voters are engaged on K-12 education issues, saying they pay “a lot” of<br />
attention. By comparison, 32% of younger voters and 44% of older voters<br />
indicated the same level of interest.<br />
Texans are significantly more likely to think that K-12 education has<br />
gotten off on the “wrong track” (55%), compared to the one-third of<br />
voters (33%) who say it is heading in the “right direction.”<br />
See Question 2<br />
Among the observed demographic groups, parents of children who are out of<br />
high school (60%), Independents (65%), middle-age voters (59%), and older<br />
voters (63%) are the most likely to hold a negative view on the direction of K-12<br />
1<br />
<strong>For</strong> this paper, the term “Parents” refers to those respondents who said they have one or more children in<br />
preschool through high school. “Non-Parents” may have children, but none are in this specific grade range.<br />
[ 2 ]
education in Texas. Younger voters are relatively more optimistic, but still less<br />
than half (43%) say things are moving in the “right direction.”<br />
More than half of respondents give negative marks to the state’s<br />
public school system (54% said “fair” or “poor”; 42% said “good”<br />
or “excellent”).<br />
See Question 3<br />
Republican responses are significantly different than both Democrats and<br />
Independents. <strong>The</strong> Republicans are clearly more positive in their views. Greater<br />
than half of Democrats (58%) and Independents (62%) gave negative ratings to<br />
the state’s system for public schools, greater than the proportion of Republicans<br />
(42%) saying the same. Conversely, 38% of Democrats and 36% of Independents<br />
described the public school system as “good” or “excellent.” But a solid majority<br />
of Republicans (55%) offered positive ratings.<br />
In terms of ideology, liberal responses differ from conservatives. Almost seven<br />
out of ten liberals (66%) gave negative ratings, which is greater than the<br />
proportion of conservatives (47%) saying the same. Conversely, 28% of liberals<br />
described the public school system as “good” or “excellent.” But a significantly<br />
higher proportion of conservatives (49%) offered these positive ratings. Political<br />
moderates were not significantly distinguishable from either ideology.<br />
One other demographic stands out. Younger voters (50%) are more likely to have<br />
a positive view of the public school system, compared to middle-age voters and<br />
older voters (38% each). Nearly six out of ten middle-age voters (58%) and older<br />
voters (59%) give the public school system a negative rating.<br />
Based on open-end survey responses, Texas voters do not know how<br />
much is spent per student in the public schools. <strong>The</strong>re is very low<br />
awareness about public spending on K-12 education.<br />
See Question 4<br />
[ 3 ]
Approximately $8,788 is spent on each student in Texas’s public schools, and<br />
only 10% of respondents could estimate the correct per-student spending range<br />
for the state (this dollar figure reflects “current expenditures” per student).<br />
Nearly 49% of respondents thought that $8,000 or less is being spent per student<br />
in the state’s public schools. Another 27% of voters said they “don’t know” and<br />
did not offer a spending number.<br />
When considering “total expenditures” per student ($11,100 in 2009-2010),<br />
which is another definition for educational spending, voter estimates appear even<br />
more dramatically off-target. 2<br />
Fully three-quarters of the survey respondents (75%) either underestimated<br />
educational spending per student (for either definition), or they could not give an<br />
answer or guess. No matter how one defines expenditures (per student), voters<br />
are poorly uninformed about how money is spent on K-12 education.<br />
When given the latest per-student spending information, voters are<br />
significantly less likely to say public school funding is at a level that is<br />
“too low,” compared to answering without having such information.<br />
See Questions 5A and 5B<br />
In an experiment, we asked two slightly different questions about the level of<br />
public school funding in Texas. On version 5A, 52% of voters said that public<br />
school funding is “too low.” However, on version 5B, which included a sentence<br />
referring to data on per-student funding in Texas ($8,788), the proportion of<br />
2<br />
“Current Expenditures” data include dollars spent on instruction, instruction-related support services,<br />
and other elementary/secondary current expenditures, but exclude expenditures on long-term debt service,<br />
facilities and construction, and other programs. “Total Expenditures” includes the latter categories.<br />
See Stephen Q. Cornman, Jumaane Young, and Kenneth C. Herrell, Revenues and Expenditures for Public<br />
Elementary and Secondary Education: School Year 2009–10 (Fiscal Year 2010) (NCES 2013-305). U.S.<br />
Department of Education. Washington, D.C.: National Center for Education Statistics (November 2012).<br />
URL: nces.ed.gov/pubs2013/2013305.pdf<br />
[ 4 ]
voters saying “too low” shrank by eleven percentage points to 41%, effectively a<br />
21% reduction.<br />
It seems that voters are likely to change their views on public school funding—at<br />
least for those who believe it is “too low”—if given accurate per-student spending<br />
information. This implication that opinion can turn on a single piece of data is<br />
important when considering political sound bites that focus on aggregate levels of<br />
public spending rather than how the money is allocated and spent per student.<br />
Voters are much more likely to give grades A or B to private/parochial<br />
schools in their local areas, compared to regular public schools and<br />
charter schools. When considering only those respondents who<br />
offered a grade, private schools (82% give an A or B) fare even better<br />
than regular public schools (50% give an A or B).<br />
See Questions 6A and 6B<br />
Approximately 64% of voters give an A or B to local private/parochial schools,<br />
while 48% give an A or B to regular public schools and 45% give an A or B to<br />
charter schools. Only 5% of voters give a D or F grade to private schools. Slightly<br />
more give low marks to charters (8%). This figure jumps a bit to 18% for public<br />
schools. It should be noted that a higher proportion of voters did not express a<br />
view for private schools (23%) or charter schools (33%), compared to the<br />
proportion that did not grade public schools (4%).<br />
Voters are nearly 2.5 times more likely to give an A to private/parochial schools<br />
(33%) compared to the proportion of responses giving an A to public schools (14%).<br />
When asked for a preferred school type, 47% of Texans would choose<br />
a private school first. A regular public school option is the secondmost<br />
frequently cited preference (34%). <strong>The</strong>re is a disconnect<br />
between voters’ school preferences and actual enrollment patterns in<br />
the state. Voters show a diverse range of schooling preferences.<br />
[ 5 ]
See Questions 7 and 8<br />
Approximately 4% of Texas’s K-12 student population attend private schools, but in<br />
our survey interviews, 47% of respondents would select a private school as a first<br />
option. About 93% of the state’s students attend regular public schools, but a much<br />
lower percentage of voters (34%) would choose a regular public school as a first<br />
choice. Approximately 3% of Texan students attend a charter school, but more than<br />
twice that proportion in our survey (8%) would like to send their child to a charter<br />
school. Another 8% of all voters said he/she would opt to homeschool their child.<br />
In a follow-up question, respondents in our survey prioritize “better education/quality”<br />
(13%) as the key attribute they are looking for in the selection of their preferred school.<br />
<strong>The</strong> second-most cited attribute is a statistical tie among “class size,” “individual<br />
attention,” “academics/curriculum,” and “teachers.” (each response garnering about<br />
9% of the overall total) Some caution is warranted when analyzing this item in the<br />
questionnaire. <strong>The</strong>se characteristics appear to be a higher priority over others on the<br />
list. However, any of these qualities may or may not attract more urgency as a second<br />
or third priority, which we do not explore in this survey.<br />
Texas voters are much more likely to favor charter schools (63%),<br />
rather than oppose such schools (22%). <strong>The</strong> net support for charter<br />
schools is large (+41 percentage points). Approximately 42% of voters<br />
say they are familiar with charter schools.<br />
See Questions 9 and 10<br />
Texas registered very large positive net support (+41 points) favoring charter<br />
schools. <strong>The</strong> intensity is also positive (+16 points). In other words, voters are<br />
more likely to say they “strongly favor” charter schools (25%) compared to those<br />
who said they “strongly oppose” (9%) such schools.<br />
When looking at various demographics, there are very few discernible differences<br />
among groups. Nearly all groups show at least 60% support for charter schools,<br />
[ 6 ]
the lone exceptions being parents with children past high school (59%) and lowincome<br />
voters (57%). <strong>The</strong> groups most likely to favor charters are voters living in<br />
Dallas/Ft. Worth (68%), conservatives (67%), suburbanites (66%), middleincome<br />
voters (68%), high-income voters (67%), and Latinos (68%). <strong>The</strong> groups<br />
more inclined to oppose charters are parents whose children are small-town<br />
voters (29%), Democrats (30%), and liberals (31%). 3<br />
<strong>The</strong> most intense support for charter schools is found among Republicans,<br />
conservatives, and middle-age voters. <strong>The</strong> least intensity of support comes from<br />
Democrats.<br />
Roughly 15% of voters did not express an opinion about charter schools.<br />
Voters overwhelmingly support the policy of “tax-credit scholarships.”<br />
<strong>The</strong> percentage of those who favor (72%) is more than triple the number<br />
of people who say they oppose such a school choice reform (20%).<br />
See Questions 11 and 12<br />
<strong>The</strong> net support is very large, roughly +52 percentage points. Likewise, the<br />
intensity of support is strong (+30 points) – more than three times as many<br />
respondents (43%) say they “strongly favor” tax-credit scholarships, compared to<br />
those who “strongly oppose” (13%).<br />
<strong>The</strong>re is majority support for tax-credit scholarships across all observed<br />
demographics. Support does not dip below 63% for any group. <strong>The</strong> observed<br />
demographic groups who are most likely to favor the policy include those living in<br />
the Houston area (79%), Republicans (84%), conservatives (81%), young voters<br />
(78%), middle-income voters (77%), and Latinos (79%). Those groups that are<br />
3 <strong>For</strong> this paper, “low-income” refers to respondents with annual household incomes less than $40,000;<br />
“middle-income” refers to respondents with annual household incomes at least equal to $40,000 but less<br />
than $80,000; “high-income” refers to respondents with annual household incomes at least equal to or<br />
greater than $80,000.<br />
[ 7 ]
more likely to oppose include parents whose children are past high school (27%),<br />
Independents (26%), liberals (29%), and older voters (26%).<br />
Generally speaking, there is intense support across all observed demographics.<br />
Republicans, conservatives, and Latinos show the most intense support for taxcredit<br />
scholarships.<br />
Eight percent of respondents did not express an opinion.<br />
In a follow-up and open-ended question, we asked for the reason why a<br />
respondent chose his/her view regarding school vouchers. Most frequently,<br />
he/she said some combination of “choice,” “freedom,” or “flexibility.” Nearly<br />
one-fifth of the respondents (18%) mentioned one or more of these terms.<br />
Voters clearly prefer universal access to tax-credit scholarships,<br />
compared to eligibility that is based solely on financial need.<br />
See Questions 13 and 14<br />
Nearly three out of four voters (74%) said they agree with the statement that “taxcredit<br />
scholarships should be available to all families, regardless of incomes and<br />
special needs.” Greater than half of respondents (55%) “strongly agree” with this<br />
statement. About two out of 10 (23%) disagree with this statement; 12% said they<br />
“strongly disagree.”<br />
Close to four out of 10 Texas voters (38%) said they agree with the statement that<br />
“tax-credit scholarships should only be available to families based on financial<br />
need.” Approximately 21% of all respondents “strongly agree” with this<br />
statement. More than half (58%) said they disagree with means-testing school<br />
tax-credit scholarships, and 34% said they “strongly disagree.”<br />
Texas voters support an “education savings account” system (called<br />
an “ESA”). <strong>The</strong> percentage of those who favor ESAs (61%) is much<br />
greater than the proportion who say they oppose this type of public<br />
[ 8 ]
policy (29%). <strong>The</strong> net support is substantial (+32 points), and the<br />
intensity is positive (+17 points).<br />
See Question 15<br />
Among observed demographics, support is highest among parents (71%), small<br />
town voters (70%), younger voters (68%), high-income voters (70%), and Latinos<br />
(72%). <strong>The</strong> groups that expressed the greatest opposition to ESAs are parents whose<br />
children are past high school (35%), rural voters (37%), and older voters (37%).<br />
Ten percent of respondents did not express an opinion about ESAs.<br />
Nearly two out of three Texans (66%) said they support school vouchers,<br />
compared to just 27% of voters who said they oppose such a school choice<br />
system. <strong>The</strong> margin of support is almost ten times the survey’s margin of<br />
error: +39 percentage points. Approximately 39% of respondents said<br />
they were at least somewhat familiar with school vouchers.<br />
See Questions 16 and 17<br />
<strong>The</strong> intensity for vouchers is positive (33% “strongly favor” vs. 18% “strongly<br />
oppose”). Most likely to support vouchers are Houston voters (71%), parents<br />
(70%), urban voters (71%), small town voters (71%), younger voters (74%), lowincome<br />
voters (71%), and Latinos (80%). Despite general positive support across<br />
groups, there are several groups that are significantly more inclined to oppose<br />
vouchers, including parents whose children are past high school (38%), rural<br />
voters (34%), and older voters (38%).<br />
<strong>The</strong>re is some variation when it comes to the intensity of support for school<br />
vouchers. <strong>The</strong> most intense support comes from parents of children in preschool<br />
through high school, low-income voters, and Latinos. Older voters are the least<br />
enthusiastic about vouchers.<br />
Nearly 7% of respondents did not express an opinion about school vouchers.<br />
[ 9 ]
A parent trigger policy garners solid support in Texas. Close to 56% of<br />
Texas voters favor some form of parent trigger accountability, compared<br />
to 31% of voters who said they oppose the idea. <strong>The</strong> net support is +25<br />
percentage points, and the positive intensity is +10 points. About 13% of<br />
respondents did not express an opinion.<br />
See Questions 18 and 20<br />
<strong>The</strong> demographic groups most likely to support a parent trigger option are<br />
parents (63%), suburban voters (66%), middle-age voters (61%), and middleincome<br />
voters (64%). A couple groups in particular appear more inclined than<br />
others to oppose a parent trigger policy: parents whose children are past high<br />
school (37%) and rural voters (41%).<br />
Parents of children in preschool through high school, self-identified liberals, and<br />
suburbanites show the most enthusiasm for the parent trigger. A number of<br />
groups show about the same tepid support for this policy, including: non-parents,<br />
urban voters, older voters, low-income voters, and Latinos.<br />
In a follow-up question, respondents were asked “if the state designated a public<br />
school as ‘low-performing’ or ‘failing,’ who do you feel should be held most<br />
responsible” for the designation. Voters were split. Most were inclined to assign<br />
fault with either the district superintendent and administration (28%) or the school<br />
board (25%). One out of five voters (20%) said the school’s principal and<br />
administration. Just 15% indicated teachers were most responsible.<br />
When considering the various actions that could occur from a parent<br />
trigger policy, more than one-third of voters (37%) said that offering a<br />
voucher or scholarship (to enroll in another school) was the best form<br />
of accountability action to serve affected students and families.<br />
See Question 19<br />
[ 10 ]
About one out of three Texans preferred offering vouchers or scholarships to<br />
students. <strong>The</strong> next two accountability actions were a statistical tie between<br />
dismissing and replacing the principal, staff, or teachers (22%) and converting<br />
the school into a public charter school (18%). Only 8% of voters expressed a<br />
preference for closing a school and relocating enrolled students.<br />
<strong>The</strong> demographic groups most likely to support a “voucher/scholarship option”<br />
are Dallas-Ft. Worth voters (47%), parents of children in PK-12 (41%), nonparents<br />
(42%), urban voters (49%), low-income voters (45%), and Latinos (48%).<br />
Compared to others, the groups relatively more likely to support dismissal and<br />
replacement of school staff are suburban voters (28%) and rural voters (27%).<br />
Houston voters (24%) and younger voters (23%) stated the highest levels of<br />
support for converting a low-performing school into charter school.<br />
About 16% of respondents did not express a preference.<br />
[ 11 ]
Survey Project & Profile<br />
Title:<br />
Survey Organization:<br />
Survey Sponsor:<br />
Release Partner:<br />
Texas K-12 & School <strong>Choice</strong> Survey<br />
Braun Research, Inc. (BRI)<br />
<strong>The</strong> <strong>Friedman</strong> <strong>Foundation</strong> for <strong>Educational</strong> <strong>Choice</strong><br />
Texas Public Policy <strong>Foundation</strong><br />
Interview Dates: March 19 to 27, 2013<br />
Interview Method:<br />
Interview Length:<br />
Language(s):<br />
Sample Frame:<br />
Sampling Method:<br />
Live Telephone | 70% landline and 30% cell phone<br />
12 minutes (average)<br />
English, Spanish<br />
Registered Voters<br />
Dual Frame; Probability Sampling; Random Digit Dial (RDD)<br />
Population Samples: TEXAS = 613<br />
Dallas-Ft. Worth = 185<br />
Houston = 143<br />
Margins of Error:<br />
TEXAS = ± 4.0 percentage points<br />
Dallas-Ft. Worth = ± 7.2 percentage points<br />
Houston = ± 8.2 percentage points<br />
Response Rates: Landline (LL) = 13.0%<br />
Cell Phone = 11.9%<br />
Weighting?<br />
Oversampling?<br />
Yes (Age, Race, Ethnicity, Gender, Region, and Landline/Cell)<br />
No<br />
Project Contact:<br />
Paul DiPerna | Research Director |paul@edchoice.org<br />
[ 12 ]