Effects of Storage Conditions on Complete Blood Cell Count ...
Effects of Storage Conditions on Complete Blood Cell Count ...
Effects of Storage Conditions on Complete Blood Cell Count ...

You also want an ePaper? Increase the reach of your titles
YUMPU automatically turns print PDFs into web optimized ePapers that Google loves.
Türk Biyokimya Dergisi [Turkish Journal <str<strong>on</strong>g>of</str<strong>on</strong>g> Biochemistry–Turk J Biochem] 2011; 36 (2) ; 165–174.<br />
Research Article [Araştırma Makalesi]<br />
Yayın tarihi 15 Haziran, 2011 © TurkJBiochem.com<br />
[Published <strong>on</strong>line 15 June, 2011]<br />
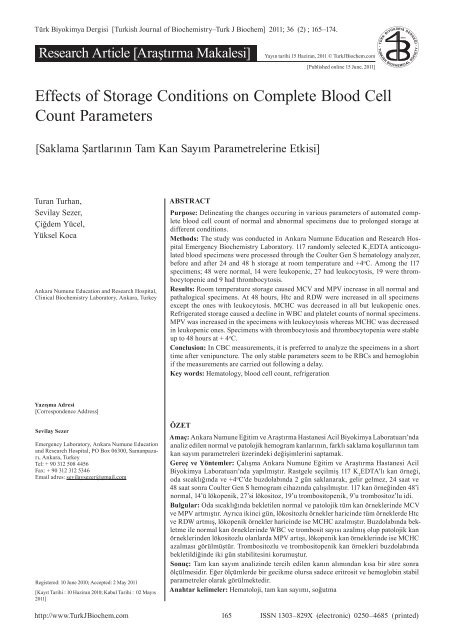
<str<strong>on</strong>g>Effects</str<strong>on</strong>g> <str<strong>on</strong>g>of</str<strong>on</strong>g> <str<strong>on</strong>g>Storage</str<strong>on</strong>g> <str<strong>on</strong>g>C<strong>on</strong>diti<strong>on</strong>s</str<strong>on</strong>g> <strong>on</strong> <strong>Complete</strong> <strong>Blood</strong> <strong>Cell</strong><br />
<strong>Count</strong> Parameters<br />
[Saklama Şartlarının Tam Kan Sayım Parametrelerine Etkisi]<br />
Turan Turhan,<br />
Sevilay Sezer,<br />
Çiğdem Yücel,<br />
Yüksel Koca<br />
Ankara Numune Educati<strong>on</strong> and Research Hospital,<br />
Clinical Biochemistry Laboratory, Ankara, Turkey<br />
ABSTRACT<br />
Purpose: Delineating the changes occuring in various parameters <str<strong>on</strong>g>of</str<strong>on</strong>g> automated complete<br />
blood cell count <str<strong>on</strong>g>of</str<strong>on</strong>g> normal and abnormal specimens due to prol<strong>on</strong>ged storage at<br />
different c<strong>on</strong>diti<strong>on</strong>s.<br />
Methods: The study was c<strong>on</strong>ducted in Ankara Numune Educati<strong>on</strong> and Research Hospital<br />
Emergency Biochemistry Laboratory. 117 randomly selected K 2<br />
EDTA anticoagulated<br />
blood specimens were processed through the Coulter Gen S hematology analyzer,<br />
before and after 24 and 48 h storage at room temperature and +4 o C. Am<strong>on</strong>g the 117<br />
specimens; 48 were normal, 14 were leukopenic, 27 had leukocytosis, 19 were thrombocytopenic<br />
and 9 had thrombocytosis.<br />
Results: Room temperature storage caused MCV and MPV increase in all normal and<br />
pathalogical specimens. At 48 hours, Htc and RDW were increased in all specimens<br />
except the <strong>on</strong>es with leukocytosis. MCHC was decreased in all but leukopenic <strong>on</strong>es.<br />
Refrigerated storage caused a decline in WBC and platelet counts <str<strong>on</strong>g>of</str<strong>on</strong>g> normal specimens.<br />
MPV was increased in the specimens with leukocytosis whereas MCHC was decreased<br />
in leukopenic <strong>on</strong>es. Specimens with thrombocytosis and thrombocytopenia were stable<br />
up to 48 hours at + 4 o C.<br />
C<strong>on</strong>clusi<strong>on</strong>: In CBC measurements, it is preferred to analyze the specimens in a short<br />
time after venipuncture. The <strong>on</strong>ly stable parameters seem to be RBCs and hemoglobin<br />
if the measurements are carried out following a delay.<br />
Key words: Hematology, blood cell count, refrigerati<strong>on</strong><br />
Yazışma Adresi<br />
[Corresp<strong>on</strong>dence Address]<br />
Sevilay Sezer<br />
Emergency Laboratory, Ankara Numune Educati<strong>on</strong><br />
and Research Hospital, PO Box 06300, Samanpazarı,<br />
Ankara, Turkey<br />
Tel: + 90 312 508 4456<br />
Fax: + 90 312 312 5346<br />
Email adres: sevilaysezer@gmail.com<br />
Registered: 10 June 2010; Accepted: 2 May 2011<br />
[Kayıt Tarihi : 10 Haziran 2010; Kabul Tarihi : 02 Mayıs<br />
2011]<br />
ÖZET<br />
Amaç: Ankara Numune Eğitim ve Araştırma Hastanesi Acil Biyokimya Laboratuarı’nda<br />
analiz edilen normal ve patolojik hemogram kanlarının, farklı saklama koşullarının tam<br />
kan sayım parametreleri üzerindeki değişimlerini saptamak.<br />
Gereç ve Yöntemler: Çalışma Ankara Numune Eğitim ve Araştırma Hastanesi Acil<br />
Biyokimya Laboratuarı’nda yapılmıştır. Rastgele seçilmiş 117 K 2<br />
EDTA’lı kan örneği,<br />
oda sıcaklığında ve +4 o C’de buzdolabında 2 gün saklanarak, gelir gelmez, 24 saat ve<br />
48 saat s<strong>on</strong>ra Coulter Gen S hemogram cihazında çalışılmıştır. 117 kan örneğinden 48’i<br />
normal, 14’ü lökopenik, 27’si lökositoz, 19’u trombositopenik, 9’u trombositoz’lu idi.<br />
Bulgular: Oda sıcaklığında bekletilen normal ve patolojik tüm kan örneklerinde MCV<br />
ve MPV artmıştır. Ayrıca ikinci gün, lökositozlu örnekler haricinde tüm örneklerde Htc<br />
ve RDW artmış, lökopenik örnekler haricinde ise MCHC azalmıştır. Buzdolabında bekletme<br />
ile normal kan örneklerinde WBC ve trombosit sayısı azalmış olup patolojik kan<br />
örneklerinden lökositozlu olanlarda MPV artışı, lökopenik kan örneklerinde ise MCHC<br />
azalması görülmüştür. Trombositozlu ve trombositopenik kan örnekleri buzdolabında<br />
bekletildiğinde iki gün stabilitesini korumuştur.<br />
S<strong>on</strong>uç: Tam kan sayım analizinde tercih edilen kanın alımından kısa bir süre s<strong>on</strong>ra<br />
ölçülmesidir. Eğer ölçümlerde bir gecikme olursa sadece eritrosit ve hemoglobin stabil<br />
parametreler olarak görülmektedir.<br />
Anahtar kelimeler: Hematoloji, tam kan sayımı, soğutma<br />
http://www.TurkJBiochem.com<br />
165<br />
ISSN 1303–829X (electr<strong>on</strong>ic) 0250–4685 (printed)
Introducti<strong>on</strong><br />
Laboratory practices carried out by centralized laboratories<br />
make it critical to know the specimen storage<br />
c<strong>on</strong>diti<strong>on</strong>s well. Transport <str<strong>on</strong>g>of</str<strong>on</strong>g> collected blood specimens<br />
to centralized laboratories can lead to a delay in testing<br />
for several hours. <strong>Cell</strong>ular elements are known to have<br />
a limited stability in blood c<strong>on</strong>taining ethylenediamine<br />
tetraacetate (EDTA) [1]. Excessive delays in processing,<br />
however, might compromise the reliability <str<strong>on</strong>g>of</str<strong>on</strong>g> results. Limited<br />
number <str<strong>on</strong>g>of</str<strong>on</strong>g> studies have been c<strong>on</strong>ducted with all<br />
the currently used hematology analyzers for the effects<br />
<str<strong>on</strong>g>of</str<strong>on</strong>g> storage <strong>on</strong> analysis [2-4]. Delays in analysis may have<br />
caused different results in both normal and pathological<br />
specimens [2].<br />
Manufacturers <str<strong>on</strong>g>of</str<strong>on</strong>g> automated analyzers and published<br />
literature <str<strong>on</strong>g>of</str<strong>on</strong>g>ten state that blood specimens, kept at either<br />
room temperature or at +4 o C (refrigerated) for up to<br />
24 hours, generally reveal reliable results for <strong>Complete</strong><br />
<strong>Blood</strong> <strong>Cell</strong> <strong>Count</strong> (CBC) [2-4]. However, these studies<br />
may not be satisfactory as the high variety <str<strong>on</strong>g>of</str<strong>on</strong>g> analyzers<br />
used are c<strong>on</strong>sidered. Besides, no c<strong>on</strong>sensus was reached<br />
about which paremeters can still be reliable in delays<br />
over 24 hours when the analyzers were out <str<strong>on</strong>g>of</str<strong>on</strong>g> order due<br />
to different reas<strong>on</strong>s [2-4,6].<br />
In order to decide whether to accept or reject the aged<br />
specimen, laboratory staff needs to be familiar with the<br />
changes known to occur in blood specimens during storage<br />
[3].<br />
In the present study, Beckman Coulter Gen–S (COUL-<br />
TER Corp, Miami, USA) hematology analyzer was used<br />
in order to compare the stability <str<strong>on</strong>g>of</str<strong>on</strong>g> normal and pathological<br />
blood specimens collected in K 2<br />
EDTA tubes and<br />
stored at +4 o C and +25 o C up to 48 hours and evaluated if<br />
there is an advantage <str<strong>on</strong>g>of</str<strong>on</strong>g> storing at +4 o C.<br />
Materials and Methods<br />
A total <str<strong>on</strong>g>of</str<strong>on</strong>g> 117 randomly selected K 2<br />
EDTA anticoagulated<br />
blood specimens were processed through the Coulter<br />
Gen S hematology analyzer at Ankara Numune<br />
Educati<strong>on</strong> and Research Hospital Emergency Biochemistry<br />
Laboratories. Two specimens were taken from<br />
each patient into two separate tubes. Am<strong>on</strong>g the 117<br />
specimens; 48 <str<strong>on</strong>g>of</str<strong>on</strong>g> them were normal, 14 <str<strong>on</strong>g>of</str<strong>on</strong>g> them were<br />
leukopenic (white cell count, 11.0 x 10 3 /µL), 19<br />
<str<strong>on</strong>g>of</str<strong>on</strong>g> them were thrombocytopenic (platelet count, 400 x 10 3 /µL). <strong>Blood</strong> specimens were kept<br />
at either room temperature or in refrigerator prior to<br />
analysis up to 48 hours.<br />
Each sample was drawn into 4 mL capacity K 2<br />
EDTA<br />
BD Vacutainer tubes. Each sample was analyzed at<br />
time point <str<strong>on</strong>g>of</str<strong>on</strong>g>
Table 1. Range <str<strong>on</strong>g>of</str<strong>on</strong>g> initial automated CBC and differential <str<strong>on</strong>g>of</str<strong>on</strong>g> specimens<br />
included in the study<br />
Parameter Range Mean %*<br />
WBC, x10 9 /L 4.4-11.3 9 2.13<br />
NE, % 45.5-73.1 59.8 1.81<br />
LY, % 18.3-44.2 22.6 5.13<br />
MO, % 2.6-13 9.05 3.36<br />
EO, % 0.00-7.00 8.5 6.14<br />
BA, % 0.00-1.2 0.2 22.36<br />
NE, x10 9 /L 1.31-6.71 5.4 3.56<br />
LY, x10 9 /L 0.9-3.22 2 4.47<br />
MO, x10 9 /L 0.12-1.13 0.8 5.59<br />
EO, x10 9 /L 0.00-0.700 0.75 7.30<br />
BA, x10 9 /L 0.00-1.2 0.05 4.25<br />
RBC, x10 12 /L 4.1-5.1 5.35 1.21<br />
Hemoglobin, g/dL 12.3-15.3 16.05 0.71<br />
Hematocrit, % 36-45 47.15 0.45<br />
MCV, fL 80-97 88.05 1.53<br />
MCH, pg 27.5-33.2 30.05 1 .22<br />
MCHC , g/dL 32.0-36.0 34.1 0.74<br />
RDW-CV, % 11.5-14.5 14.9 2.79<br />
Platelet, x10 9 /L 150-450 210.5 2.75<br />
MPV, fL 7.0-12.0 10.5 1.78<br />
* within-run precisi<strong>on</strong> values from analyses <str<strong>on</strong>g>of</str<strong>on</strong>g> medium samples<br />
Results<br />
Am<strong>on</strong>g the normal specimens stored at room temperature;<br />
WBC, RBC, hemoglobin and platelets were relatively<br />
stable; the MCV, RDW and MPV each increased over<br />
time at day 1 and day 2; Htc increased at day 2 while<br />
MCHC descended over time; each change was statistically<br />
significant (p
Table 3. Mean percent changes induced by storage <str<strong>on</strong>g>of</str<strong>on</strong>g> normal specimens at room temperature and refrigerated<br />
Refrigerated Room Temperature<br />
Normal<br />
(n= 48)<br />
WBC<br />
( x 10 9 /L)<br />
RBC<br />
(10 12 /L )<br />
HGB<br />
( g/dL)<br />
HCT<br />
(%)<br />
MCV<br />
( fL)<br />
MCH<br />
(pg)<br />
MCHC<br />
( g/dL)<br />
RDW<br />
(%)<br />
PLT<br />
(x 10 9 /L)<br />
MPV<br />
(fL)<br />
Fresh 24 h<br />
Change<br />
(%)<br />
CI(95%)<br />
Change CI(95%)<br />
Change CI(95%)<br />
Change CI(95%)<br />
48 h<br />
24h<br />
48h<br />
(%)<br />
(%)<br />
(%)<br />
Lower Upper Lower Upper Lower Upper Lower Upper<br />
7.7 7.6* 1.30 0.005 0.219 5.70* 25.97^ 1.549 2.575 7.7 0 -0.052 0.069 7.7 0 -0.042 0.126<br />
4.73 4.71 0.42 -0.006 0.033 4.72 0.21 0.012 -0.033 4.68 1.06 -0.034 0.129 4.71 0.42 0.003 0.030<br />
13.6 13.6 0.00 -0.123 -0.018 13.70 -0.74 -0.123 -0.031 13.5 0.74 -0.198 0.264 13.6 0.00 -0.071 0.000<br />
40.6 40.7 -0.25 -0.277 0.181 40.80 -0.49 -0.464 0.048 41.1 -1.23 -1.304 0.300 42.3 -4.19^ -1.909 -1.432<br />
85.9 85.6 0.35 -0.884 1.405 86.50* -0.70 -0.940 -0.221 87.8* -2.21 -2.337 -1.516 89.8* -4.54^ -4.316 -3.513<br />
28.8 29* -0.69 -0.309 -0.111 29* -0.69 -0.310 -0.106 29 -0.69 -0.307 -5.131 28.9 -0.35 -0.285 -0.064<br />
33.4 33.5 -0.30 -0.323 0.040 33.40 0.00 -0.209 0.172 32.9* 1.50 0.276 0.677 32.1* 3.89^ 1.057 1.463<br />
13.9 13.8 0.72 -0.024 0.145 13.70 1.44 0.013 0.228 14.8* -6.47^ -1.073 -0.697 15.5* -11.51^ -1.824 -1.426<br />
257 247* 3.89 4.841 15.82 225* 12.45 22.601 42.066 258 -0.39 -3.676 2.218 258 -0.39 -3.777 2.694<br />
8.8 9.3* -5.68 -0.670 -0.383 9.60* -9.09^ -1.114 -0.569 9.3* -5.68 -0.394 -7.230 10* -13.64^ -1.424 -1.100<br />
* p
Table 5. Mean percent changes induced by storage <str<strong>on</strong>g>of</str<strong>on</strong>g> specimens having leukocytosis at room temperature and +4 o C<br />
Refrigerated Room Temperature<br />
L .cytosis<br />
(n=27)<br />
Fresh 24 h<br />
Change<br />
(%)<br />
CI(95%) 48 h<br />
Change<br />
CI(95%) 24h<br />
Change<br />
(%)<br />
CI(95%) 48h<br />
Change<br />
(%)<br />
CI(95%)<br />
Lower Upper (%) Lower Upper Lower Upper Lower Upper<br />
WBC<br />
16.6 16.32 1.69 -0.157 1.572 14.67 11.63 -1.198 5.1838 16.20 2.41 -0.283 1.195 16.70 -0.60 -1.114 0.744<br />
( x 109/L)<br />
RBC<br />
4.51 4.57 -1.33 -0.228 0.373 4.41 2.22 -0.232 0.4350 4.56 -1.11 -0.202 0.078 4.57 -1.33 -0.195 0.087<br />
(1012/L )<br />
HGB<br />
12.69 13.08 -3.07 -0.552 0.623 12.64 0.39 -0.740 1.2368 13.10 -3.23 -0.561 0.139 13.07 -2.99 -0.490 0.246<br />
( g/dL)<br />
HCT<br />
38.13 41.21 -8.08^ -3.835 0.299 40.19 -5.40^ -4.832 1.6177 39.80 -4.38^ -2.440 -0.507 40.88* -7.21^ -3.435 -1.460<br />
(%)<br />
MCV<br />
85.37 90.1* -5.54^ -5.942 -3.485 90.97* -6.56^ -7.042 -4.1725 87.16* -2.10 -2.815 -1.480 89.52* -4.86^ -5.185 -3.688<br />
( fL)<br />
MCH<br />
28.55 28.63 -0.28 -0.211 0.204 29.09 -1.89 -1.307 0.2334 28.70 -0.53 -0.243 0.043 28.63 -0.28 -0.149 0.216<br />
(pg)<br />
MCHC<br />
33.36 31.72 4.92^ 1.282 2.282 31.79 4.71^ 0.639 2.5010 32.86 1.50 0.449 0.935 31.90* 4.38^ 1.372 2.004<br />
( g/dL)<br />
RDW<br />
15.07 16.15 -7.17^ -1.793 -0.363 16.06 -6.57^ -1.753 -0.2241 15.8 0.00 -1.647 -0.071 16.50 -9.49^ -2.219 -0.662<br />
(%)<br />
PLT<br />
292 283 3.08 -2.918 37.918 252 13.70^ -17.11 96.965 283 3.08 -1.929 19.114 289 1.03 -5.431 7.283<br />
(x 109/L)<br />
MPV<br />
8.23 9.37 -13.85^ -1.436 -0.841 9.33 -13.37^ -1.383 -0.8685 8.94* -8.63^ -0.951 -0.552 9.68* -17.62^ -1.904 -1.236<br />
(fL)<br />
* p
Table 6. Mean percent changes induced by storage <str<strong>on</strong>g>of</str<strong>on</strong>g> specimens having leukopenic at room temperature and +4 o C<br />
Refrigerated Room Temperature<br />
L.copenic<br />
(n=14)<br />
Fresh 24 h<br />
Change<br />
(%)<br />
CI(95%) 48 h<br />
Change<br />
CI(95%) 24h<br />
Change<br />
(%)<br />
CI(95%) 48h<br />
Change<br />
(%)<br />
CI(95%)<br />
Lower Upper (%) Lower Upper Lower Upper Lower Upper<br />
WBC<br />
( x 10 9 /L)<br />
RBC<br />
(10 12 /L )<br />
HGB<br />
( g/dL)<br />
HCT<br />
(%)<br />
MCV<br />
( fL)<br />
MCH<br />
(pg)<br />
MCHC<br />
( g/dL)<br />
RDW<br />
(%)<br />
PLT<br />
(x 10 9 /L)<br />
MPV<br />
(fL)<br />
2.02 1.91 5.45 0.031 0.195 1.80 10.89 -0.255 0.712 1.84 8.91 -0.038 0.409 2.02 0.00 -0.090 -0.090<br />
2.9 2.91 -0.34 -0.022 0.009 2.59 10.69^ -0.150 0.777 2.90 0.00 -0.010 0.011 2.90 0.00 -0.025 0.029<br />
8.6 8.64 -0.47 -0.109 0.024 7.64 11.16^ -0.570 2.484 8.60 0.00 -0.064 0.050 8.67 -0.81 -0.163 0.006<br />
25.16 25.55 -1.55 -0.889 0.104 22.60 10.17^ -2.410 7.539 25.36 -0.79 -0.467 0.067 25.88* -2.86 -1.154 -0.288<br />
88.12 88.71 -0.67 -2.044 0.858 88.92 -0.91 -2.980 1.380 88.55 -0.49 -1.025 0.168 90.25* -2.42 -3.161 -1.096<br />
30.47 30.45 0.07 -0.274 0.316 30.85 -1.25 -1.310 0.553 30.38 0.30 -0.089 0.274 31.38 -2.99 -2.487 0.672<br />
34.47 34.22 0.73 0.201 0.687 30.85* 10.50^ -1.416 0.945 34.20 0.78 -0.023 0.566 33.88 1.71 0.200 0.970<br />
16.13 16.4 -1.67 -0.812 0.269 15.82 1.92 -0.772 1.401 16.47 -2.11 -0.630 -0.055 17.32* -7.38^ -1.695 -5.128<br />
96 96 0.00 -3.468 2.896 83.00 13.54^ -16.21 41.786 99.00 -3.13 -7.032 0.603 98.00 -2.08 -5.432 2.003<br />
8.12 8.68 -6.90^ -0.942 -0.186 8.52 -4.93 -1.304 0.489 8.71 -7.27^ -1.005 -0.179 9.35* -15.15^ -1.588 -0.868<br />
* p
In specimens with thrombocytosis, storage at room temperature<br />
caused an increase in Htc, MCV, RDW, MPV<br />
and a decrease in MCHC (p
Table 7. Mean percent changes induced by storage <str<strong>on</strong>g>of</str<strong>on</strong>g> specimens having thrombocytosis at room temperature and +4 o C<br />
Refrigerated Room Temperature<br />
T.cytosis<br />
(n=19)<br />
Fresh 24 h<br />
Change<br />
(%)<br />
CI(95%) 48 h<br />
Change<br />
CI(95%) 24h<br />
Change<br />
(%)<br />
CI(95%) 48h<br />
Change<br />
(%)<br />
CI(95%)<br />
Lower Upper (%) Lower Upper Lower Upper Lower Upper<br />
WBC<br />
11.53 11.28 2.17 -0.016 0.505 6.26 45.71^ -5.287 15.821 11.64 -0.95 -0.289 0.066 11.33 1.73 -0.219 0.619<br />
( x 10 9 /L)<br />
RBC<br />
4.01 4.05 -1.00 -0.076 0.003 3.58 10.72^ -0.579 1.439 4.01 0.00 -0.023 0.023 4.00 0.25 -0.016 0.034<br />
(10 12 /L )<br />
HGB<br />
10.77 10.91 -1.30 -0.199 -0.066 9.53 11.51^ -1.828 4.317 10.81 -0.37 -0.099 0.033 10.80 -0.28 -0.073 0.029<br />
( g/dL)<br />
HCT<br />
32.88 33.6 -2.19 -1.955 0.532 29.38 10.64^ -6.163 13.163 33.08 -0.61 -0.457 0.057 34.11* -3.74 -1.686 -0.758<br />
(%)<br />
MCV<br />
83.66 84.88 -1.46 -4.486 2.042 84.80 -1.36 -5.026 2.759 84.17 -0.61 -1.253 0.231 87.00* -3.99^ -4.601 -2.065<br />
( fL)<br />
MCH<br />
27.58 27.6 -0.07 -0.233 0.211 28.93 -4.89^ -4.175 1.486 27.63 -0.18 -0.316 0.227 27.70 -0.44 -0.321 0.076<br />
(pg)<br />
MCHC<br />
32.78 32.46 0.98 -0.981 1.625 33.58 -2.44^ -3.845 2.245 32.66 0.37 -0.157 0.401 31.70 3.29^ 0.591 1.586<br />
( g/dL)<br />
RDW<br />
16.92 17.24 -1.89 -1.140 0.496 16.91 0.06 -1.200 1.222 17.14 -1.30 -0.602 0.157 18.23* -7.74^ -1.732 -0.889<br />
(%)<br />
PLT<br />
541 522 3.51 -0.167 37.94 452 16.45^ -103.99 283.10 540 0.18 -10.415 13.526 544 -0.55 -16.20 9.765<br />
(x 10 9 /L)<br />
MPV<br />
7.22 8.15 -12.88^ -1.890 0.023 8.42 -16.62^ -2.615 0.215 7.86 -8.86^ -0.753 -0.535 8.55* -18.42^ -1.756 -0.910<br />
(fL)<br />
* p
Table 8. Mean percent changes induced by storage <str<strong>on</strong>g>of</str<strong>on</strong>g> specimens having thrombocytopenic at room temperature and +4 o C<br />
Refrigerated Room Temperature<br />
T.cytopeni<br />
(n=19)<br />
Fresh 24 h<br />
Change<br />
(%)<br />
CI(95%) 48 h<br />
Change<br />
CI(95%) 24h<br />
Change<br />
(%)<br />
CI(95%) 48h<br />
Change<br />
(%)<br />
CI(95%)<br />
Lower Upper (%) Lower Upper Lower Upper Lower Upper<br />
WBC<br />
6.25 5.99 4.16 0.093 0.432 6.25 0.00 -0.304 0.304 5.76 7.84 -0.196 1.186 6.14 1.76 -0.041 0.273<br />
( x 109/L)<br />
RBC<br />
3.52 3.5 0.57 -0.006 0.038 3.41 3.13 -0.087 0.300 3.51 0.28 -0.006 0.019 3.51 0.28 -0.001 0.027<br />
(1012/L )<br />
HGB<br />
10.58 10.61 -0.28 -0.082 0.040 10.34 2.27 -0.416 0.911 10.60 -0.19 -0.059 0.027 10.62 -0.38 -0.077 0.014<br />
( g/dL)<br />
HCT<br />
31.32 32.31 -3.16 -1.614 -0.375 31.75 -1.37 -2.616 1.753 31.74 -1.34 -0.763 -0.078 32.33* -3.22 -1.478 -0.552<br />
(%)<br />
MCV<br />
89.21 89.76 -0.62 -4.372 -0.732 90.19 -1.10 -5.234 -0.723 90.24 -1.15 -1.802 -0.250 92.03* -3.16 -3.876 -1.765<br />
( fL)<br />
MCH<br />
30.54 30.63 -0.29 -0.281 0.102 31.21 -2.19 -1.588 0.251 30.52 0.07 0.119 0.151 30.63 -0.29 -0.293 0.103<br />
(pg)<br />
MCHC<br />
34.18 33.43 2.19 0.258 1.257 33.68 1.46 -0.501 1.511 33.81 1.08 0.112 0.634 33.31* 2.55^ 0.493 1.252<br />
( g/dL)<br />
RDW<br />
15.67 16.61 -6.00 -1.542 -0.349 16.06 -2.49 -1.331 0.534 16.49 -5.23^ -1.190 -0.459 17.23* -9.96^ -2.090 -1.032<br />
(%)<br />
PLT<br />
69 69 0.00 -3.201 4.043 69.00 0.00 -8.200 9.147 71.00 -2.90 -4.943 1.785 70.00 -1.45 -3.309 2.361<br />
(x 109/L)<br />
MPV<br />
8.65 9.24 -6.82^ -1.082 -0.096 9.00 -4.05 -1.007 0.302 9.01 -4.16 -0.752 0.036 9.65* -11.56^ -1.478 -0.531<br />
(fL)<br />
* p
the measurements are carried out following a delay especially<br />
for the evaluati<strong>on</strong>s we made with the normal<br />
specimens. For other parameters; delayed processing affects<br />
stability. The delays and the possible effect <str<strong>on</strong>g>of</str<strong>on</strong>g> these<br />
delays <strong>on</strong> the results should be indicated in the reports.<br />
However, in case <str<strong>on</strong>g>of</str<strong>on</strong>g> necessity; for Coulter Gen-S analyzer;<br />
it can be c<strong>on</strong>cluded that it is possible to maintain the<br />
stability <str<strong>on</strong>g>of</str<strong>on</strong>g> specimens by refrigerated storage up to two<br />
days with some limitati<strong>on</strong>s.<br />
C<strong>on</strong>flict <str<strong>on</strong>g>of</str<strong>on</strong>g> interest<br />
The authors declare that they have no c<strong>on</strong>flict <str<strong>on</strong>g>of</str<strong>on</strong>g> interest.<br />
References<br />
[1] Lawrence AC, Bevingt<strong>on</strong> JM, Young M. (1975) <str<strong>on</strong>g>Storage</str<strong>on</strong>g> <str<strong>on</strong>g>of</str<strong>on</strong>g> blood<br />
and the mean corpuscular volume. J Clin Pathol. 28:345-9.<br />
[2] Gulati GL, Hyland LJ, Kocher W, Schwarting R. (2002) Changes<br />
in automated complete blood cell count and differential leukocyte<br />
count results induced by storage <str<strong>on</strong>g>of</str<strong>on</strong>g> blood at room temperature.<br />
Arch Pathol Lab Med. 126: 336-42.<br />
[3] Hedberg P, Lehto T. (2009) Aging stability <str<strong>on</strong>g>of</str<strong>on</strong>g> complete blood<br />
count and white blood cell differential parameters analyzed by<br />
Abbott CELL-DYN Sapphire hematology analyzer. Int J Lab<br />
Hematol. 31: 87-96.<br />
[4] Buttarello M. (2004) Quality specificati<strong>on</strong> in haematology: the<br />
automated blood cell count. Clin Chim Acta. 346: 45-54.<br />
[5] Internati<strong>on</strong>al Council for Standardizati<strong>on</strong> <str<strong>on</strong>g>of</str<strong>on</strong>g> Haemotology<br />
(1993). Recommendati<strong>on</strong>s <str<strong>on</strong>g>of</str<strong>on</strong>g> the Internati<strong>on</strong>al Council for Standardizati<strong>on</strong><br />
in Haemotology for ethylendiamine-tetraacetic acid<br />
anticoagulati<strong>on</strong> <str<strong>on</strong>g>of</str<strong>on</strong>g> blood for blood cell counting and sizing. Am<br />
J Clin Pathol. 100:371-2.<br />
[6] Picard F, Gicquel C, Marnet L, Guesnu M, Levy JP. (1999) Preliminary<br />
evaluati<strong>on</strong> <str<strong>on</strong>g>of</str<strong>on</strong>g> the new hematology analyzer COULTER<br />
GEN-S in a university hospital. Clin Chem Lab Med. 37(6):681-<br />
6.<br />
[7] Ricos C, Alvarez V, Cava F, Garcia-Lario JV, Hernandez A, Jimenez<br />
CV, Minchinela J, Perich C, Sim<strong>on</strong> M. (1999) Current<br />
databases <strong>on</strong> biologic variati<strong>on</strong>: pros, c<strong>on</strong>s and progress. Scand<br />
J Clin Lab Invest. 59:491-500.<br />
[8] Wood BL, Andrews J, Miller S, Sabath DE. (1999) Refrigerated<br />
storage improves the stability <str<strong>on</strong>g>of</str<strong>on</strong>g> the complete blood cell count<br />
and automated differential. Am J Clin Pathol. 112(5):687-95.<br />
[9] Warner BA, Reard<strong>on</strong> DM. (1991) A field evaluati<strong>on</strong> <str<strong>on</strong>g>of</str<strong>on</strong>g> the Coulter<br />
STKS. Am J Clin Pathol. 95(2):207-17.<br />
Turk J Biochem, 2011; 36 (2) ; 165–174.<br />
174<br />
Turhan et al.