The Greek diaspora in Eastern Europe and the Former Soviet Union
The Greek diaspora in Eastern Europe and the Former Soviet Union
The Greek diaspora in Eastern Europe and the Former Soviet Union

Create successful ePaper yourself
Turn your PDF publications into a flip-book with our unique Google optimized e-Paper software.
to <strong>the</strong> United Nations about <strong>the</strong>ir country’s decision to forbid<br />
<strong>the</strong>ir return but <strong>the</strong> UN never recognised <strong>the</strong>m as (political)<br />
refugees. This attitude could possibly be expla<strong>in</strong>ed<br />
by <strong>the</strong> prevail<strong>in</strong>g anti-communist context <strong>in</strong> which every<br />
decision <strong>in</strong> western <strong>Europe</strong>, <strong>and</strong> consequently <strong>in</strong> <strong>the</strong> UN,<br />
was made at <strong>the</strong> time.<br />
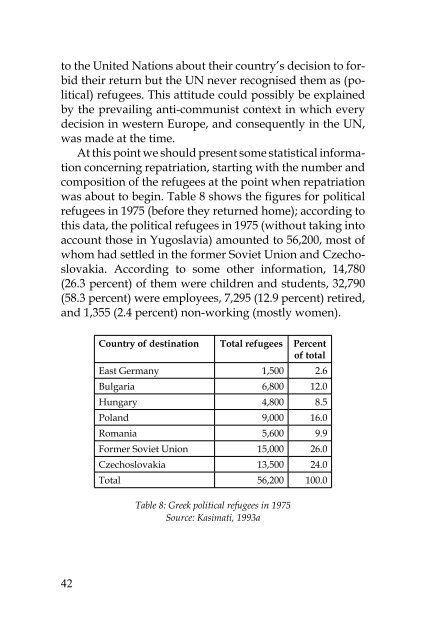
At this po<strong>in</strong>t we should present some statistical <strong>in</strong>formation<br />
concern<strong>in</strong>g repatriation, start<strong>in</strong>g with <strong>the</strong> number <strong>and</strong><br />
composition of <strong>the</strong> refugees at <strong>the</strong> po<strong>in</strong>t when repatriation<br />
was about to beg<strong>in</strong>. Table 8 shows <strong>the</strong> figures for political<br />
refugees <strong>in</strong> 1975 (before <strong>the</strong>y returned home); accord<strong>in</strong>g to<br />
this data, <strong>the</strong> political refugees <strong>in</strong> 1975 (without tak<strong>in</strong>g <strong>in</strong>to<br />
account those <strong>in</strong> Yugoslavia) amounted to 56,200, most of<br />
whom had settled <strong>in</strong> <strong>the</strong> former <strong>Soviet</strong> <strong>Union</strong> <strong>and</strong> Czechoslovakia.<br />
Accord<strong>in</strong>g to some o<strong>the</strong>r <strong>in</strong>formation, 14,780<br />
(26.3 percent) of <strong>the</strong>m were children <strong>and</strong> students, 32,790<br />
(58.3 percent) were employees, 7,295 (12.9 percent) retired,<br />
<strong>and</strong> 1,355 (2.4 percent) non-work<strong>in</strong>g (mostly women).<br />
Country of dest<strong>in</strong>ation Total refugees Percent<br />
of total<br />
East Germany 1,500 2.6<br />
Bulgaria 6,800 12.0<br />
Hungary 4,800 8.5<br />
Pol<strong>and</strong> 9,000 16.0<br />
Romania 5,600 9.9<br />
<strong>Former</strong> <strong>Soviet</strong> <strong>Union</strong> 15,000 26.0<br />
Czechoslovakia 13,500 24.0<br />
Total 56,200 100.0<br />
Classification accord<strong>in</strong>g to age, provides us with <strong>the</strong><br />
follow<strong>in</strong>g data: 15,000 (26.7 percent) were born outside<br />
Greece (<strong>and</strong> were up to 25 years old <strong>in</strong> 1975), 20,000 (35.6<br />
percent) were up to 18 years old upon leav<strong>in</strong>g Greece (<strong>and</strong><br />
up to 45 years old <strong>in</strong> 1975), <strong>and</strong> 21,200 (37.7 percent) were<br />
over 18 years old upon leav<strong>in</strong>g Greece (<strong>and</strong> over 45 years<br />
old <strong>in</strong> 1975). This data reveals <strong>the</strong> tragedy of many EAM/<br />
ELAS fighters who died outside of <strong>the</strong>ir country because of<br />
<strong>the</strong> long duration of <strong>the</strong>ir exile. <strong>The</strong> proportion of former<br />
fighters return<strong>in</strong>g home would be even smaller after 1975<br />
because mass repatriation did not beg<strong>in</strong> earlier than 1982.<br />
Table 9 shows <strong>the</strong> educational composition of <strong>the</strong> refugee<br />
workforce <strong>in</strong> 1975 which is worthy of note. <strong>The</strong> workforce<br />
of <strong>the</strong> 56,200 political refugees consisted of 32,790 persons,<br />
3,385 (10 percent) of whom were graduates of higher<br />
education <strong>in</strong>stitutes, 4,434 (13.5 percent) were high school<br />
or technical school graduates, <strong>and</strong> 11,595 (35.3 percent)<br />
were graduates of occupational schools (specialised technical<br />
schools). In addition, 11,320 (34.5 percent) had been<br />
had been given vocational tra<strong>in</strong><strong>in</strong>g <strong>and</strong> mostly consisted<br />
of those political refugees who had been over 18 years old<br />
upon leav<strong>in</strong>g Greece <strong>and</strong>, due to <strong>the</strong>ir age <strong>and</strong> low educational<br />
level, did not proceed to fur<strong>the</strong>r education. 2,056 (6,2<br />
percent) unskilled persons, were ei<strong>the</strong>r disabled or older<br />
people who did not achieve any vocational specialisation.<br />
Table 8: <strong>Greek</strong> political refugees <strong>in</strong> 1975<br />
Source: Kasimati, 1993a<br />
42 43