2007 Silicon Valley Projections - Silicon Valley Leadership Group
2007 Silicon Valley Projections - Silicon Valley Leadership Group
2007 Silicon Valley Projections - Silicon Valley Leadership Group

Create successful ePaper yourself
Turn your PDF publications into a flip-book with our unique Google optimized e-Paper software.
<strong>2007</strong> <strong>Silicon</strong> <strong>Valley</strong> <strong>Projections</strong><br />
Tough Challenges—Hopeful Signs<br />
• Housing • Transportation • Education & Workforce Preparation<br />
• Energy & Environment • Healthcare • Tax Policy
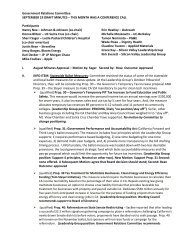
<strong>Silicon</strong> <strong>Valley</strong><br />
Forty cities in four counties
Tough Challenges – Hopeful Signs.<br />
Let us start with a rather bold statement: <strong>Silicon</strong> <strong>Valley</strong> is still the<br />
preeminent technology region in the world. What we must realize is that<br />
our valley is not the only top-tech region in the world. We must sustain<br />
our strengths while not white-washing our weaknesses.<br />
<strong>Projections</strong> <strong>2007</strong> is a first of its kind look at <strong>Silicon</strong> <strong>Valley</strong> compared to not<br />
only twelve top innovation regions in the United States, but also several<br />
key technology clusters around the globe.<br />
Let’s start with our strengths. We have a world class university system, an<br />
overwhelming advantage in venture capital funding, promising signs for<br />
clean technology clusters, a diverse mix of technology and life science<br />
industries, and the best workers in the world.<br />
Yet we must also direct attention to our disadvantages – high housing<br />
costs, an inadequate transportation system, uneven performance in our<br />
k-12 education system, the rising costs of healthcare, and steep energy<br />
prices. Add to this mix regulatory and tax policies that are not competitive<br />
with other states let alone other nations.<br />
The entrepreneurial spirit that drives <strong>Silicon</strong> <strong>Valley</strong> must also drive our<br />
public policies to keep and grow jobs, our economy, and quality of life.<br />
<strong>Silicon</strong> <strong>Valley</strong> is still the capital of innovation that is the envy of the earth’s<br />
economy, but our success is not a birthright, we must rise up and compete<br />
for it everyday.<br />
We hope “<strong>Projections</strong> <strong>2007</strong>: Tough Challenges – Hopeful Signs” will further<br />
initiate the dialogue and innovation necessary to move <strong>Silicon</strong> <strong>Valley</strong><br />
forward.<br />
Contents<br />
<strong>Silicon</strong> <strong>Valley</strong> Market Dyanmics<br />
3<br />
Transportation<br />
13<br />
Education and Workforce Preparation<br />
17<br />
Environment<br />
23<br />
Healthcare<br />
31<br />
Energy<br />
37<br />
Housing<br />
43<br />
Tax Policy<br />
47<br />
Acknowledgements<br />
53<br />
Carl Guardino<br />
President and CEO<br />
<strong>Silicon</strong> <strong>Valley</strong> <strong>Leadership</strong> <strong>Group</strong><br />
William T. Coleman III<br />
Chairman of the Board<br />
<strong>Silicon</strong> <strong>Valley</strong> <strong>Leadership</strong> <strong>Group</strong><br />
Chairman and CEO<br />
Cassatt Corporation<br />
1
Introduction<br />
<strong>Silicon</strong> <strong>Valley</strong> continues to assert itself as a global center of innovation. And the pioneering tradition of the <strong>Valley</strong><br />
is alive and well, with both private and public sector initiatives underway to begin to tackle the persistent chaland<br />
to address the quality of life concerns that — if allowed to continue unchecked — threaten to weaken the <strong>Valley</strong>’s<br />
lenges for the region’s business climate. Nonetheless, the future competitiveness of the <strong>Valley</strong> hinges on the ability<br />
to make the tough decisions and explore the creative options needed to reduce the excessive costs of doing business<br />
position as a global and US innovation leader.<br />
Over the years the <strong>Valley</strong> has been buffeted by the severe crosswinds of change:<br />
• The <strong>Valley</strong> has become one of the costliest places in the United States — and the world — to do business<br />
• Investment in infrastructure, housing stock, and education have lagged the growth and needs of the population<br />
and businesses<br />
• The United States — and the <strong>Valley</strong> — have not produced the volume of engineering, scientific, math, and other<br />
core talent necessary to fuel the high technology engine<br />
• Outsourcing — and offshoring — have blown through the <strong>Valley</strong> in successive waves of manufacturing,<br />
customer service, information technology, and shared services<br />
• Looking at manufacturing, beyond certain capital intensive and logistics-sensitive processes, manufacturing<br />
activity has fled the <strong>Valley</strong> in waves to lower cost jurisdictions<br />
So significant and fundamental are these forces that the pace of the recovery and the very future of the <strong>Valley</strong> are at stake.<br />
It is in this context that we present a framework for viewing the private sector engine that propels <strong>Silicon</strong> <strong>Valley</strong>.<br />
This framework examines the requirements of individual companies to prosper at different stages of a company’s<br />
evolution. It provides a useful way to view the needs of companies at different levels of maturity and, at the macro<br />
level, offers insights into the overarching trends for industries clustered in <strong>Silicon</strong> <strong>Valley</strong>:<br />
• Value Chain — Operationally, in functional units and by the needs of each unit<br />
• Lifecycle — Over time, as the company and these units develop and mature, the evolving drivers of company<br />
success<br />
From a public policy perspective — the Value Chain and Lifecycle vantages provide unique insights into the needs of<br />
the private sector and the economy, to prioritize, and gain perspective on how different levels of government can<br />
best respond.<br />
In the next section of this report, the industries that serve as the engine for <strong>Silicon</strong> <strong>Valley</strong> are reviewed, with a distinction<br />
between primary and secondary industries. Next, the Value Chains and Lifecycles for core industries are presented.<br />
Finally, a discussion of <strong>Silicon</strong> <strong>Valley</strong>’s competitiveness relative to other U.S. and global innovation centers.<br />
2
<strong>Silicon</strong> <strong>Valley</strong><br />
Industry Overview
<strong>Silicon</strong> <strong>Valley</strong> Industry Overview<br />
Definition of Industries<br />
The <strong>Silicon</strong> <strong>Valley</strong> <strong>Leadership</strong> <strong>Group</strong> has historically organized<br />
its view of issues, the analytic work that it conducts, and<br />
its framing of policy recommendations by industry sectors.<br />
Member companies were organized into 12 business sectors in<br />
2006 Economic Competitiveness Survey and CEO Business<br />
Climate Summit. Those 12 sectors were collapsed into seven<br />
categories. For the purpose of this year’s <strong>Silicon</strong> <strong>Valley</strong><br />
<strong>Projections</strong> study and focus of policy, we are focusing on the<br />
same seven industry clusters, distinguishing between the<br />
Internet/Communications and the utility sectors.<br />
We have distinguished the eight industries into two groups,<br />
listed in the table below:<br />
• Primary (or Core)—the industry clusters that drive the<br />
<strong>Silicon</strong> <strong>Valley</strong> economy. These industries can be thought of<br />
as the economic engines of <strong>Silicon</strong> <strong>Valley</strong>, at the center of<br />
innovation, competitive advantage, employment, and<br />
around which the economy and other economic sectors<br />
revolve. These industries are outwardly focused, competing<br />
in the global marketplace. These primary industries are the<br />
focus of the Value Chain and Lifecycle frameworks that we<br />
have developed and competitive analysis that we have conducted.<br />
As described later in this section, the value chain<br />
of functions for these and secondary industries span all<br />
types of operations, including R&D, manufacturing/distribution,<br />
and supporting shared services. The table to the<br />
right defines the key segments within each industry.<br />
• Secondary—For the most part, secondary industries support<br />
primary industries—the core companies and their<br />
economic activities or the major impacts that emanate<br />
from them. Generally locally focused in their products and<br />
services, companies within these support industries may be<br />
locally-based or the local operations of national or global<br />
firms. While General Manufacturing would typically be<br />
classified as a primary industry in many local economies, as<br />
it is predominantly outwardly focused and also drives secondary<br />
industry support services, based on the size and<br />
nature of the General Manufacturing sector in <strong>Silicon</strong><br />
<strong>Valley</strong>, it is classified as a secondary industry in this study.<br />
The main sectors within General Manufacturing are listed<br />
below, the listing a function of employment in the <strong>Silicon</strong><br />
<strong>Valley</strong> region. It should be noted that, a sizable portion<br />
of the general manufacturing sector within the <strong>Valley</strong>,<br />
supports the <strong>Valley</strong>’s primary industries.<br />
Industry<br />
Primary<br />
Technology<br />
(High-Technology)<br />
Life Sciences<br />
Financial & Professional<br />
Services<br />
Secondary<br />
General Manufacturing<br />
Telecommunications<br />
Utilities<br />
Education<br />
Healthcare<br />
Definition<br />
Software<br />
Hardware/Equipment<br />
Internet Commerce<br />
Medical Device/Diagnostics<br />
Biotechnology<br />
Venture Capital<br />
Investment Banking<br />
Engineering<br />
Consulting<br />
Food<br />
Chemicals<br />
Transportation Equipment<br />
Fabricated Metals<br />
Machinery<br />
Service providers<br />
Service providers<br />
Service providers<br />
Service providers<br />
Defining the Value Chain<br />
Any given company is comprised of a chain of highly interrelated,<br />
but distinguishable activities—a “value chain” of<br />
activities. Depending on the industry and focus of the company,<br />
these activities can be broken down by functions or types<br />
of operations. These activities are intertwined both linearly<br />
by sequential processes (e.g. sourcing/manufacturing/distribution)<br />
and/or tie into one another through hierarchies driving<br />
or supporting one another (senior management directing<br />
functions and business units; shared services supporting the<br />
business units). These activities are broadly encapsulated into<br />
the following clusters of activities:<br />
• <strong>Leadership</strong> and Strategy: senior management, research &<br />
development, product development & engineering, product<br />
marketing<br />
• Manufacturing/Production: core manufacturing, delivery<br />
of services (for service companies), product testing, quality<br />
assurance, and manufacturing support<br />
4
<strong>Silicon</strong> <strong>Valley</strong> Industry Overview<br />
• Logistics Network: direct/indirect materials supply chain,<br />
inbound/outbound logistics, and distribution network<br />
• Shared Services: support functions, traditionally includes<br />
finance, information technology, human resources, legal,<br />
procurement, and corporate real estate.<br />
• Customer Focus: sales, retail, technical support, customer<br />
support.<br />
Along this continuum, the operations can be conducted by the<br />
company (“captive”) or by an outside party (“outsource”), with<br />
many variations and combination between these two bookends.<br />
The company and components of the value chain may be<br />
physical, organizational, and/or led in a centralized or decentralized<br />
manner. In the case of the latter, operations may be<br />
widely dispersed across the globe, often with business units<br />
highly autonomous and with distinct support operations and<br />
infrastructure.<br />
For each value chain function the primary operating success<br />
drivers are divided into two categories:<br />
• Cost of operations: focus is on major costs that impact the<br />
overall cost of the value chain activity.<br />
• Operating conditions: focus is qualitative and non-cost<br />
operating factors in the external environment that can<br />
be leveraged for success or that may adversely impact the<br />
success of the value chain activity.<br />
In the tables that follow, the key value chain functions for each<br />
of the <strong>Silicon</strong> <strong>Valley</strong> primary industries and the key operating<br />
cost and condition factors are listed for each function. The<br />
functions and factors have, by necessity, been generalized<br />
across sectors and companies within the primary industries,<br />
with the focus on the key operating cost and condition success<br />
factors.<br />
Consulting LLP.<br />
Consulting LLP.<br />
Consulting LLP.<br />
5
<strong>Silicon</strong> <strong>Valley</strong> Industry Overview<br />
Life Cycles<br />
Beyond the Value Chain in our model of industries and companies,<br />
we layer the perspectives gained from viewing the<br />
needs of a company over its lifespan. This maturity model<br />
charts a company over four stages: 1) Start-up, 2) Adolescence,<br />
3) Adulthood, and 4) Maturity. The exhibit below presents the<br />
characteristics typically exhibited by a company in each of the<br />
four stages.<br />
As the company evolves, it changes its strategy and focus, the<br />
nature and depth of its operations, and its cost and profitability<br />
structure. We caution that in today’s highly competitive,<br />
global business climate the evolution of a company is far from<br />
smooth or certain, and not as straightforward as is represented<br />
in the exhibit. The leap from Start-up to Adolescence is particularly<br />
precarious. Beyond simple survivability, challenges<br />
can include being acquired/taken over, loss of control to equity<br />
holders, merging, joint ventures, internal disputes, and<br />
going public.<br />
As those of us approaching and fording middle age know,<br />
Adulthood and Maturity bring their challenges—sustaining<br />
innovation can be difficult, there is a need to build infrastructure,<br />
but bureaucracy lurks around every corner, while<br />
headcount and costs can escalate with a life of their own. With<br />
size, a company must continually innovate–competition can<br />
sprout up overnight.<br />
<strong>Leadership</strong> changes, with<br />
operations a focus<br />
Multiple products & services<br />
Expanding markets<br />
Focus on revenue & profitability<br />
Corporate infrastructure developed,<br />
but tactical, and inefficient<br />
Consulting LLP.<br />
6
<strong>Silicon</strong> <strong>Valley</strong> Industry Overview<br />
Competing Metro Areas<br />
As innovation within the <strong>Valley</strong>’s primary industries becomes<br />
more global, competition from domestic and international<br />
communities has increased. Given the differing attributes for<br />
various aspects of each industry’s value chain, no competing<br />
area has a strong advantage across all value chains.<br />
However, many areas have attributes similar to the <strong>Valley</strong><br />
and will continue to compete in the innovation space. Many<br />
competing communities also have attributes that support<br />
manufacturing and distribution more competitively than the<br />
<strong>Valley</strong> due to attractive operating conditions and moderate costs.<br />
Technology<br />
Community<br />
<strong>Silicon</strong> <strong>Valley</strong><br />
Domestic<br />
Communities<br />
Austin, TX<br />
Boston, MA<br />
Denver, CO<br />
Portland, OR<br />
San Diego, CA<br />
Seattle, WA<br />
Washington, DC<br />
International<br />
Communities<br />
Bangalore, India<br />
Berlin, Germany<br />
Dublin, Ireland<br />
Grenoble, France<br />
London, England<br />
Prague, Czech Republic<br />
Shanghai, China<br />
Singapore<br />
St. Petersburg, Russia<br />
Stockholm, Sweden<br />
Tokyo, Japan<br />
Software/<br />
Hardware<br />
development<br />
✓<br />
✓<br />
✓<br />
✓<br />
✓<br />
✓<br />
✓<br />
✓<br />
✓<br />
✓<br />
✓<br />
✓<br />
✓<br />
✓<br />
✓<br />
✓<br />
✓<br />
✓<br />
✓<br />
Manufacturing/<br />
Production<br />
✓<br />
✓<br />
✓<br />
✓<br />
✓<br />
✓<br />
✓<br />
✓<br />
✓<br />
✓<br />
✓<br />
✓<br />
✓<br />
✓<br />
✓<br />
✓<br />
✓<br />
✓<br />
Distribution/<br />
Media<br />
✓<br />
✓<br />
✓<br />
✓<br />
✓<br />
✓<br />
✓<br />
✓<br />
✓<br />
✓<br />
✓<br />
✓<br />
✓<br />
Customer<br />
Support<br />
✓<br />
✓<br />
✓<br />
✓<br />
✓<br />
✓<br />
✓<br />
✓<br />
✓<br />
✓<br />
✓<br />
✓<br />
✓<br />
✓<br />
✓<br />
✓<br />
✓<br />
✓<br />
✓<br />
✓ Competitive Advantage ✓ Moderately Competitive Less Competitive<br />
7
<strong>Silicon</strong> <strong>Valley</strong> Industry Overview<br />
Life Sciences<br />
Community<br />
Research &<br />
Development<br />
Clinical<br />
Trials<br />
manufacturing Distribution<br />
<strong>Silicon</strong> <strong>Valley</strong><br />
✓<br />
✓<br />
✓<br />
Domestic<br />
Communities<br />
✓<br />
Boston, MA<br />
✓<br />
✓<br />
✓<br />
Chicago, IL<br />
✓<br />
✓<br />
✓<br />
New Jersey<br />
✓<br />
✓<br />
✓<br />
Raleigh-Durham, NC ✓<br />
✓<br />
✓<br />
San Diego, CA<br />
✓<br />
✓<br />
✓<br />
Seattle, WA<br />
✓<br />
✓<br />
✓<br />
Washington, DC<br />
✓<br />
✓<br />
International<br />
Communities<br />
Basel, Switzerland<br />
✓<br />
✓<br />
✓<br />
Dublin, Ireland<br />
✓<br />
✓<br />
✓<br />
San Juan, Puerto Rico ✓<br />
✓<br />
✓<br />
Singapore<br />
✓<br />
✓<br />
✓<br />
✓<br />
✓ Competitive Advantage ✓ Moderately Competitive Less Competitive<br />
Financial & Professional Services<br />
Community<br />
<strong>Silicon</strong> <strong>Valley</strong><br />
Boston, MA<br />
New York<br />
Washington, DC<br />
Service<br />
Innovation/<br />
Marketing<br />
✓<br />
✓<br />
✓<br />
✓<br />
Core<br />
Service<br />
Delivery<br />
Shared<br />
Services/Back<br />
Office<br />
✓ Competitive Advantage ✓ Moderately Competitive Less Competitive<br />
✓<br />
✓<br />
✓<br />
✓<br />
8
<strong>Silicon</strong> <strong>Valley</strong> Industry Overview<br />
<strong>Silicon</strong> <strong>Valley</strong> Market Dynamics<br />
Key market dynamics for <strong>Silicon</strong> <strong>Valley</strong> are anticipated to continue<br />
to reflect the innovation focus of the area, including a<br />
highly compensated workforce and the availability of venture<br />
capital. Median household income in the <strong>Valley</strong> continues to<br />
significantly exceed that of competing metro areas. Further,<br />
venture capital investments in the <strong>Valley</strong> have continued to<br />
be four times that of the closest competing metro area and<br />
commonly approach the aggregate investment levels of<br />
all competing metro areas combined. However, global competition<br />
for skills, cost of living, limited housing stock, and<br />
erosion in the region’s quality of life will have an impact on<br />
the <strong>Valley</strong>. Population and civilian labor force growth are<br />
expected to lag lower-cost areas of the country, especially in<br />
the South and Southeast. An additional limitation to future<br />
competitiveness is the relatively low number of housing units<br />
in relation to the number of households. Additional housing<br />
stock within a reasonable commute of employment centers<br />
within the <strong>Valley</strong> will be key to attracting and retaining<br />
talent within the region.<br />
2005 Median Income Population<br />
, Association of Bay Area Governments (ABAG).<br />
Consulting LLP.<br />
Consulting LLP.<br />
Venture Capital Investment by Region, 2003-2005<br />
9
<strong>Silicon</strong> <strong>Valley</strong>’s Competitive Position<br />
<strong>Silicon</strong> <strong>Valley</strong> Industry Overview<br />
Civilian Labor Force Employment and Unemployment 16+, 2005, 2010<br />
<strong>Silicon</strong> <strong>Valley</strong>, CA 1,109,800 1,899,374 58% 1,199,200 2,041,200 59%<br />
, Association of Bay Area Governments (ABAG).<br />
Consulting LLP.<br />
NOTE: <strong>Silicon</strong> <strong>Valley</strong> is defined as San Mateo and Santa Clara Counties.<br />
Number of H1-B Visa Certifications<br />
Housing Statistics 2005<br />
Consulting LLP.<br />
Viewed from the perspectives gained from the frameworks and<br />
comparative review presented earlier, <strong>Silicon</strong> <strong>Valley</strong>’s core<br />
strengths are clearly in the innovation, creativity, and product<br />
and service development at the front-end of the value chain,<br />
which drive the success and global eminence of its primary<br />
industries. And it is noteworthy that <strong>Silicon</strong> <strong>Valley</strong> stands out<br />
compared with leading global innovation centers for having<br />
diverse strengths, significant competitive advantages across<br />
several value chain segments in both technology and life sciences,<br />
the two industries we evaluated for global competitive<br />
standings.<br />
Consulting LLP.<br />
1.02<br />
1.05<br />
1.04<br />
1.05<br />
1.05<br />
1.05<br />
1.08<br />
1.06<br />
1.07<br />
1.05<br />
1.05<br />
1.05<br />
This “power alley” is a function of the high talent that resides<br />
in the <strong>Valley</strong>, its significant agglomeration of companies large<br />
and small, the Bay Area’s leading engineering and science<br />
programs at its world-class universities, and a highly unique<br />
spirit and culture of innovation that exists in the high technology,<br />
life sciences, and other sectors.<br />
The lifecycle model provides further perspective on <strong>Silicon</strong><br />
<strong>Valley</strong>’s economy and its future. In the Start-up and<br />
Adolescence phases, innovation and the creation of products<br />
and services drive the success of the company. At these stages,<br />
other aspects of the value chain are immature and less substantial<br />
contributors to the core success of the company.<br />
10
<strong>Silicon</strong> <strong>Valley</strong> Industry Overview<br />
Manufacturing/production, distribution, shared services, and<br />
customer support are developing platforms upon which to<br />
support the launch of a new product or service into the market.<br />
They are necessary to keep the company going–but not at the<br />
core to the early success. Some are outsourced, some growing<br />
in scale and maturity internally. Generally speaking, the<br />
talent needs are more ubiquitous, yet the costs of this labor<br />
and capital investment, real estate, taxes, and services begin<br />
to rapidly escalate as the company progresses through the lifecycle<br />
to adulthood. As the company finds its way into the<br />
adulthood and maturity stages, the size, scale, and costs of the<br />
downstream value chain have escalated to the point that they<br />
can be a drag on growth and profitability. Not only have these<br />
support activities grown disproportionately in size, put they<br />
typically grow without design for efficiency, process,<br />
economies of scale, and performance.<br />
In the Bay Area, with its high-cost structure and the business<br />
climate that has evolved, the costs to maintain and operate the<br />
downstream activities of the value chain may well become<br />
prohibitive. Facing the dramatically lower costs of geographies<br />
that compete for each of these segments of the Value<br />
Chain, especially international competitors, many <strong>Silicon</strong><br />
<strong>Valley</strong> companies are forced to explore reducing the size<br />
of these functions–through reengineering, outsourcing or<br />
redeployment–not uncommonly offshore.<br />
• The 1970’s witnessed the beginnings of the exodus of<br />
manufacturing from the <strong>Valley</strong>. Moving in concentric<br />
waves— manufacturing operations fled first to lower-cost<br />
locations in the Bay Area and the State, then to surrounding<br />
states and the West, then Mexico, and now China and<br />
other, once unimagined niches around the globe. Today, it<br />
is largely highly specialized manufacturing linked to core<br />
processes that remain in the <strong>Valley</strong>.<br />
<strong>Silicon</strong> <strong>Valley</strong>’s Competitive Position<br />
Consulting LLP.<br />
11
<strong>Silicon</strong> <strong>Valley</strong> Industry Overview<br />
• Customer support and shared services have followed.<br />
While concentric redeployment has similarly taken place,<br />
the patterns and geographies have been different than for<br />
manufacturing. With a deep pool of educated, productive<br />
labor, low labor costs, solid language skills, relatively<br />
low risk, and a supportive government as requisites in a<br />
location, companies began moving these operations from<br />
the <strong>Valley</strong>. As companies grow and their markets and<br />
operations have become global, they have typically developed<br />
global/regional models for customer support and<br />
shared services.<br />
• The developing next wave is the sourcing of engineering<br />
and higher skilled talent to other geographies. Companies<br />
are diversifying their talent and innovation through the<br />
development of centers in key technology centers across the<br />
globe, in both established and emerging locales.<br />
This expansion outward has at its core a combination of<br />
pull and push factors:<br />
• While <strong>Silicon</strong> <strong>Valley</strong> is in its scale, depth, and breadth<br />
unrivaled in the talent that resides here, other locations<br />
across the globe are producing deep and strong talent.<br />
Spreading operations across the globe provides 24-hour<br />
access and speed to innovation. It also diversifies the<br />
risk associated with having all of your talent and innovation<br />
in one market.<br />
• As the cost of living escalates, housing choices become<br />
limited, public education degrades, commutes become<br />
unbearable, and public services and infrastructure are<br />
not able to keep up with the demands of the population,<br />
it is becoming difficult to retain and attract talent to<br />
the <strong>Valley</strong>.<br />
12
Transportation
Transportation<br />
By 2017, approximately 160,000 more cars will be competing<br />
for space on <strong>Silicon</strong> <strong>Valley</strong>’s roads-the equivalent of a lane of<br />
cars, lined up bumper to bumper, from San Jose to San Diego.<br />
And that’s just counting cars owned by <strong>Silicon</strong> <strong>Valley</strong> residents.<br />
Thousands more will be pouring over the Pacheco and<br />
Altamont passes, or chugging up Hwy 101 from the Monterey<br />
Bay Area, to jobs in <strong>Silicon</strong> <strong>Valley</strong>.<br />
That increase demonstrates the challenge <strong>Silicon</strong> <strong>Valley</strong>-and<br />
indeed all of the high tech regions in the nation-face. As our<br />
population, the ratio of car ownership, and commute distances<br />
increase, congestion on our roadways is rising. All of the<br />
nation’s top high tech regions currently endure “undesirable”<br />
highway congestion levels, according to the U.S. Bureau of<br />
Transportation Statistics. These conditions erode our quality<br />
of life. But the situation poses another less visible, but grave,<br />
threat. The more we drive, the more greenhouse gases we generate-emissions<br />
that are dramatically and rapidly changing the<br />
climate of our planet.<br />
Transportation & Greenhouse Gases<br />
Scientists generally agree that the Earth’s temperature is rising<br />
and human activities are accelerating that trend. Human-generated<br />
greenhouse gases-pollutants such as carbon dioxide,<br />
methane, and nitrous oxide that trap the Earth’s heat, are<br />
increasing at a faster rate than any period over the last several<br />
thousand years.<br />
The earth has been getting markedly warmer since the late<br />
19th century, evidenced by, among other things, melting glaciers,<br />
decreased snow pack in the Sierra Nevada and other<br />
mountain ranges, and increasing drought in the American<br />
Recommended Strategies to Reach California<br />
2020 Greenhouse Gas Emissions Goal<br />
Other Transportation Strategies: Transit,<br />
Biofuels, Efficient Land Use, Technology,<br />
Fees, Truck Improvements (anti-idling,<br />
Efficiency, etc.), Other.<br />
Note: 2020 Emissions Goal=California 1990 GHG Emissions level.<br />
Source: Climate Action Team.<br />
Southwest. But the most rapid changes have occurred within<br />
the last two decades. According to the California Climate<br />
Action Team, that trend is expected to escalate in the 21st<br />
century due in large part to as yet unrealized warming from<br />
climate change pollutants already in the atmosphere-pollutants<br />
generated by burning coal, oil, and natural gas and clearcutting<br />
forests to make way for agriculture and other human<br />
activities.<br />
While there is some disagreement about the speed at which<br />
the earth is warming and the specific changes it will trigger,<br />
there is wide concurrence that if we continue on our current<br />
trajectory there will be severe consequences. According to the<br />
California Air Resources Board (CARB), California will likely<br />
experience more weather extremes (stronger and more frequent<br />
storms, flooding and heat waves), reduced water supply<br />
due to snowpack melt, extensive coastal damage due to rising<br />
sea levels, more forest fires and more respiratory illness.<br />
Recognizing the threat, in 2005 Governor Schwarzenegger<br />
established ambitious greenhouse gas emission reduction targets<br />
for California. Those reductions are being pursued<br />
through a variety of means; including replanting forests,<br />
increasing the energy efficiency of appliances and utilizing<br />
biogas digesters to reduce methane emissions from farms and<br />
landfills. But transportation offers the opportunity for the<br />
biggest reductions.<br />
Reducing Vehicle Emissions<br />
Passenger vehicles, freight, rail and aviation account for more<br />
than 40% of California’s greenhouse gas emissions. Passenger<br />
vehicle emissions comprise two-thirds of that total. What is<br />
more, vehicle emissions are one of the fastest growing sources<br />
of greenhouse gas emissions. Those statistics spurred<br />
California to adopt strict emission standards for new passenger<br />
vehicles in 2004-the first in the nation.<br />
The regulations issued by CARB require automakers to reduce<br />
greenhouse gas emissions of vehicles sold in the state by 30<br />
percent by 2016, starting with the 2009 model year. Since<br />
then, 10 other states have followed California’s lead, including<br />
three states that are home to high tech regions–Massachusetts,<br />
Washington and Oregon.<br />
The nation’s major automakers sued to overturn the regulation<br />
arguing that the standard is so severe it would drive up prices<br />
and cripple new-car sales. The regulation is in limbo until the<br />
suit is resolved. But record high gas prices have created a<br />
demand for more fuel efficient vehicles-which also have lower<br />
emissions.<br />
14
Transportation<br />
In 2005, Californians purchased one-quarter of the hybrids on<br />
the market. Currently 1.2% of total vehicle sales in the nation<br />
are hybrids. National sales of hybrids have generally doubled<br />
every year since 2000. Other alternatives, such as biodiesel,<br />
ethanol and hydrogen are gaining ground, but still represent<br />
only a tiny fraction of our fuel portfolio. Hydrogen fuel cells<br />
are still prohibitively expensive and we don’t yet have the ability<br />
to produce and distribute large quantities of ethanol and<br />
biodiesel. Improved battery performances are giving a boost to<br />
plug-in hybrids, which can operate for 20 miles solely on electricity.<br />
The technology relies on an existing distribution system-the<br />
electrical grid-but must overcome concerns about<br />
power plant emissions. At least two auto manufacturers,<br />
Toyota and Honda, have said they plan to offer flexible-fuel<br />
plug-in hybrids soon<br />
Two-Pronged Approach: Reduce Emissions<br />
and Increase Commute Alternatives<br />
If CARB’s greenhouse gas reduction rule is upheld, the state<br />
would be able to stabilize its greenhouse gas emissions by<br />
2010. That would be a significant achievement. But if<br />
California is to avoid the devastating impacts of global warming,<br />
we will need to reduce our emissions even further. Plus,<br />
swapping petroleum-guzzling cars to alternative fuel vehicles<br />
will do nothing to address our very real congestion problems,<br />
particularly in job centers such as <strong>Silicon</strong> <strong>Valley</strong>.<br />
We need a two-pronged approach: we need to reduce our<br />
tailpipe emissions and decrease the number of miles we drive,<br />
particularly solo. We need to increase our use of transit, carpooling,<br />
telecommuting, walking and biking.<br />
California Global Warming Emissions by Sector<br />
Transportation Sector Greenhouse Gas Emissions<br />
Region/<br />
Metro-Area<br />
Commute<br />
by Auto<br />
Carpool<br />
Commute by<br />
Mass Transit<br />
1.7%<br />
2.6%<br />
4.7%<br />
Work at<br />
Home<br />
Walk<br />
Bicycle<br />
Raleigh-Durham, NC<br />
Austin, TX<br />
<strong>Silicon</strong> <strong>Valley</strong> (Santa Clara<br />
and San Mateo counties)<br />
San Diego, CA<br />
Fairfax County, VA<br />
Portland, OR/Vancouver, WA<br />
Seattle, WA<br />
Boston, MA<br />
78.5%<br />
76.5%<br />
75.8%<br />
12.9%<br />
13.7%<br />
12.4%<br />
3.5%<br />
3.6%<br />
3.3%<br />
2.3%<br />
2.1%<br />
1.9%<br />
0.4%<br />
0.6%<br />
1.1%<br />
73.9%<br />
73.4%<br />
73.1%<br />
70.4%<br />
68.2%<br />
13.0%<br />
13.1%<br />
11.5%<br />
12.6%<br />
8.2%<br />
3.4%<br />
7.3%<br />
6.3%<br />
80%<br />
13.9%<br />
4.4%<br />
4.2%<br />
4.6%<br />
4.4%<br />
3.4%<br />
3.4%<br />
1.3%<br />
3.0%<br />
3.2%<br />
5.3%<br />
0.6%<br />
0.1%<br />
0.8%<br />
0.7%<br />
0.5%<br />
Source: US Census Bureau<br />
15
Transportation<br />
Reducing the number of cars on our roads by 1 percent would<br />
decrease traffic congestion by 5 percent. But making that shift<br />
would be a major cultural change. <strong>Silicon</strong> <strong>Valley</strong> has one of the<br />
highest rates of solo commute driving compared to the<br />
nation’s other high tech centers, according to the 2000 US<br />
Census. Only Raleigh-Durham, NC and Austin, Texas exceed<br />
the <strong>Valley</strong>’s 76% solo driving record.<br />
Nevertheless, high fuel prices are providing a real incentive for<br />
many to use commute alternatives. In 2006, ridership on<br />
VTA’s light rail line, Caltrain and on BART, met or exceeded<br />
2000 levels. Caltrain’s decision to increase its baby bullet<br />
(express) service and VTA’s light rail extension to Milpitas and<br />
Campbell made those systems more convenient to commuters.<br />
And transit agencies are using technology to try to make transit<br />
more attractive: providing real-time transit information;<br />
offering wi-fi connections, and enabling transit users to find,<br />
reserve and pay for limited parking via cell phone, the internet<br />
and on board navigation systems. We also need to build<br />
more homes and jobs in walking distance to transit, and make<br />
our neighborhoods more pedestrian and bicycle-friendly. But<br />
all of this takes money which, despite an upturn in the state’s<br />
economy, is still in short supply.<br />
Best Practices - Lessons Learned<br />
The City of Portland was the first local government in the<br />
nation to adopt a greenhouse gas reduction plan. Since 1990,<br />
the city has reduced its emissions by 12.5% while national<br />
emissions increased by about 13%.<br />
The reason is due in part to Portland's 75% boost in transit<br />
usage and nearly 10% increase in bicycling and walking since<br />
1990. The city accomplished this by expanding transit service<br />
(adding two major light rail lines, a streetcar line and increasing<br />
service frequency on major arterials), building more than<br />
100 miles of bicycle infrastructure and constructing numerous<br />
high-density, pedestrian-friendly developments near its transit<br />
stations. The city also uses incentives, mass marketing, and<br />
grassroots outreach to promote commute alternatives.<br />
Building a Sustainable<br />
Transportation System<br />
Ironically, the extent to which we succeed in reducing our fuel<br />
consumption, we diminish California’s primary sources of<br />
transportation funding: the gas tax and the sales tax on gasoline.<br />
Yet, the need to maintain, improve and operate our roads,<br />
highways, and transit systems continues to grow. The state is<br />
still digging its way out of a decade-long, multi-billion transportation<br />
infrastructure shortfall that will only be partly<br />
assuaged by the passage of a $20 billion transportation bond<br />
on the November 2006 ballot. To reduce greenhouse gas<br />
emissions and address California’s sizeable infrastructure<br />
needs, California will need to restructure the way it finances<br />
transportation. For instance, California could:<br />
• Substantially Increase the Gas Tax, which was last raised in<br />
1990 and has lost 1/3 of its value to inflation since then.<br />
This would also discourage solo driving. But it would not<br />
resolve the conflict between greater fuel efficiency and<br />
shrinking revenues.<br />
• Adopt Distance-Based Fees based on vehicle fuel efficiency<br />
and distance traveled. Europe has applied such fees to<br />
freight trucks with enormous success, significantly reducing<br />
emissions and miles driven without reducing the volume<br />
of goods transported.<br />
• Institute Congestion Pricing on User Fees, varying the fee<br />
in relation to demand. For example, tolls priced higher<br />
during peak commute hours can encourage those who can<br />
to shift their time of travel to non-peak hours. This distributes<br />
demand across other time periods when there is more<br />
roadway capacity. The rate can be set so that it is revenue<br />
neutral or generates excess funds.<br />
• Adopt Feebates—a combination of fees and rebates—to<br />
encourage the manufacture and purchase of cleaner, more<br />
fuel efficient vehicles. Consumers purchase the vehicle of<br />
their choice, but receive a rebate or pay a surcharge if their<br />
selection is above or below a certain standard of performance.<br />
The program can be designed so that it is revenue<br />
neutral or generates a positive cash flow.<br />
“Lifeline” rates could be established for low-income motorists<br />
for all of these policies to ensure equity.<br />
Magnifying the Impact<br />
California’s emissions policies alone cannot curb global warming.<br />
Its real power is that other states are following California’s<br />
lead, magnifying its impact.<br />
Yet as bold as it is, California’s vehicle emissions policy is only<br />
a first step. We will need to pursue a variety of policies—better<br />
integrate transportation and land use, provide more and<br />
better transportation alternative for commuters, and transition<br />
our entire economy off of carbon-based fuels-to avoid the<br />
more severe consequences of global warming. Our task now is<br />
to adopt the right combination of economic incentives, fiscal<br />
policies and regulatory standards that will spur the type of<br />
technological innovation and institutional change necessary to<br />
more radically reduce our emissions. If it does, <strong>Silicon</strong> <strong>Valley</strong><br />
is well positioned to serve as the locus of that innovation.<br />
16
Education
Education<br />
In the <strong>Silicon</strong> <strong>Valley</strong> <strong>Leadership</strong> <strong>Group</strong> 2006 CEO Survey, 65% of valley CEOs cited improving K-12 education as<br />
a “top 5” way to improve the region’s business climate. This was second only to housing (at 67%) and nearly<br />
30 percentage points higher than in the previous year’s survey.<br />
There is one constant in <strong>Silicon</strong> <strong>Valley</strong>: Change<br />
Change resulting from innovation; innovation propelled by<br />
a dynamic labor force that is itself specialized and evolving<br />
rapidly. <strong>Silicon</strong> <strong>Valley</strong> is dependent on a labor force that is<br />
grounded in math, science, engineering and analytical and<br />
communication skills, but one that is adaptable.<br />
Competitive pressures continue to intensify, and <strong>Silicon</strong> <strong>Valley</strong><br />
faces increased domestic and international competition.<br />
Although <strong>Silicon</strong> <strong>Valley</strong> remains an important driver<br />
of California and the nation’s economy–with large concentrations<br />
of information and biotechnology companies, for<br />
example–our own recent history to be and remain competitive<br />
is not automatic.<br />
The pressures to recruit new talent are increasing, and we are<br />
not producing enough scientists and engineers. A widely cited<br />
statistic from the National Science Foundation tells us that<br />
South Korea, with 1/6 the population of the United States,<br />
awards nearly the same number of engineering degrees.<br />
Moreover, nearly half of all Master’s Degrees and Ph.D.s<br />
awarded in the US are to foreign nationals, whose incentives<br />
to stay, work and build companies in the United States are<br />
diminishing, as is our ability to grow our own talent to fill<br />
these voids.<br />
At the same time, California’s population and workforce are<br />
changing; in particular, the demographics in our classrooms<br />
are changing.<br />
California, with 12% of the nation’s overall population, has<br />
more than 40% of the country’s English language learner<br />
(ELL) students. Over the past 10 years, <strong>Silicon</strong> <strong>Valley</strong>’s student<br />
population has grown by more than 10,000 ELL students<br />
alone, even at a time when the net change for all of <strong>Silicon</strong><br />
<strong>Valley</strong> was 7,600 students.<br />
Additionally, more and more Latinos are becoming a part of<br />
California’s workforce. In fact, over the last 15 years, Latinos<br />
have gone from 1/4 of the state’s workforce to 1/3 of the workforce,<br />
and one third of the population of Latinos is projected<br />
to be under the age of 20 by the year 2020 (Source: Calif.<br />
Budget Project; Boom, Bust & Beyond in the San Francisco<br />
Percent Change<br />
4<br />
3<br />
2<br />
1<br />
0<br />
-1<br />
-2<br />
-3<br />
Tech Regions<br />
San Diego, CA . . . . . . . . . . . . . . . . . . . . . . . . .23<br />
<strong>Silicon</strong> <strong>Valley</strong>, CA . . . . . . . . . . . . . . . . . . . . . . .23<br />
Denver, CO . . . . . . . . . . . . . . . . . . . . . . . . . . . .16<br />
Austin, TX . . . . . . . . . . . . . . . . . . . . . . . . . . . .12<br />
Portland, OR . . . . . . . . . . . . . . . . . . . . . . . . . .10<br />
Washington, DC . . . . . . . . . . . . . . . . . . . . . . . . .9<br />
Seattle, WA . . . . . . . . . . . . . . . . . . . . . . . . . . . .8<br />
Raleigh-Durham, NC . . . . . . . . . . . . . . . . . . . . .7<br />
Boston, MA . . . . . . . . . . . . . . . . . . . . . . . . . . . .5<br />
New Jersey/Philadelphia . . . . . . . . . . . . . . . . . . .2<br />
New York, NY . . . . . . . . . . . . . . . . . . . . . . . . . .2<br />
Chicago, IL . . . . . . . . . . . . . . . . . . . . . . . . . . . . .1<br />
<strong>Silicon</strong> <strong>Valley</strong> Students Enrollment Growth: English<br />
Language Learners (ELL) and Total Enrollment<br />
1997<br />
1998<br />
1999<br />
2000<br />
ELL Enrollment<br />
2001<br />
2002<br />
ELL, % of<br />
Enrollment<br />
(2003)<br />
2003<br />
2004<br />
Total Enrollment<br />
2005<br />
18
Education<br />
Bay Area, 2005). However, the rate at which Latinos and other<br />
population subgroups in <strong>Silicon</strong> <strong>Valley</strong> and throughout<br />
California are enrolling in college preparatory classes, in<br />
colleges and universities, and filling high growth industry<br />
jobs is lagging.<br />
In light of our changing economy and demographics, how can<br />
all California students meet increasing expectations and be<br />
part of a vibrant innovation economy?<br />
Competition from all sides<br />
How California and <strong>Silicon</strong> <strong>Valley</strong> Match Up<br />
California’s K-12 schools continue to fall behind their counterparts<br />
nationwide on indicators like per pupil funding, student-teacher<br />
ratio, and counselors per student.<br />
Although the high school graduation rate in California is<br />
comparable to the other technology regions in the country at<br />
84.9% (using the federal NCES definition)—and as with<br />
other aspects of educational achievement in the state, <strong>Silicon</strong><br />
<strong>Valley</strong> is higher than the state average (90.1%)—the number<br />
falls within ethnic subpopulations. Moreover,<br />
California students as a whole continue to make gains in math<br />
and English, as demonstrated through the National<br />
Assessment of Educational Progress (NAEP). However, when<br />
looking at states with other high tech centers, California students<br />
have a lot of ground to make up in the “proficient” and<br />
“advanced” levels.<br />
Student & Workforce Demographics:<br />
How California and <strong>Silicon</strong><br />
<strong>Valley</strong> are Changing<br />
<strong>Silicon</strong> <strong>Valley</strong>’s student population is changing. In 2004,<br />
Latino students surpassed white students in the region as the<br />
largest student group. In less than a decade, the California<br />
Budget Project estimates that 54% of K-12 enrollment in<br />
California will be Latino students, a trend that will no doubt<br />
be felt in <strong>Silicon</strong> <strong>Valley</strong>.<br />
Student Enrollment & Percentage of English Language Learners<br />
430,000<br />
27<br />
Number of Students<br />
410,000<br />
390,000<br />
370,000<br />
350,000<br />
330,000<br />
310,000<br />
290,000<br />
270,000<br />
25<br />
23<br />
21<br />
19<br />
17<br />
Percentage of Students<br />
250,000<br />
1997 1998 1999 2000 2001 2002 2003 2004 2005 2006<br />
SV Student<br />
Population<br />
Percentage of<br />
ELL Students,<br />
California<br />
Percentage of<br />
ELL Students,<br />
<strong>Silicon</strong> <strong>Valley</strong><br />
15<br />
Sources: Table, National Center for Education Statistics, Deloitte Consulting LLP<br />
Graphs, CA Dept. of Education, SVLG<br />
19
Education<br />
2005 Public School Rating<br />
Public<br />
School<br />
Rating<br />
Academic<br />
Percentile<br />
Education<br />
Spending<br />
Percentile<br />
Overall<br />
Percentile<br />
Location<br />
Washington, DC . . . . . . . . . . .***** . . . . . . . . . .82 . . . . . . . . . 95 . . . . . . . . . .99 . . . . . . . . . .88<br />
Austin, TX . . . . . . . . . . . . . . . .***** . . . . . . . . . .80 . . . . . . . . . 71 . . . . . . . . . .94 . . . . . . . . . .86<br />
Raleigh-Durham, NC . . . . . . . .***** . . . . . . . . . .90 . . . . . . . . . 32 . . . . . . . . . .92 . . . . . . . . . .84<br />
Seattle, WA . . . . . . . . . . . . . . . .**** . . . . . . . . . .65 . . . . . . . . . 34 . . . . . . . . . .86 . . . . . . . . . .65<br />
New Jersey/Philadelphia . . . . . . .**** . . . . . . . . . .66 . . . . . . . . . 96 . . . . . . . . . .87 . . . . . . . . . .62<br />
Boston, MA . . . . . . . . . . . . . . . .**** . . . . . . . . . .54 . . . . . . . . . 93 . . . . . . . . . .93 . . . . . . . . . .54<br />
<strong>Silicon</strong> <strong>Valley</strong> (San Jose) . . . . . . . .*** . . . . . . . . . .56 . . . . . . . . . 60 . . . . . . . . . .95 . . . . . . . . . .65<br />
Portland, OR . . . . . . . . . . . . . . . .*** . . . . . . . . . .60 . . . . . . . . . 23 . . . . . . . . . .75 . . . . . . . . . .59<br />
San Diego, CA . . . . . . . . . . . . . . . .** . . . . . . . . . .35 . . . . . . . . . 49 . . . . . . . . . .66 . . . . . . . . . .39<br />
New York, NY . . . . . . . . . . . . . . . .** . . . . . . . . . .26 . . . . . . . . . 91 . . . . . . . . . .80 . . . . . . . . . .35<br />
Chicago, IL . . . . . . . . . . . . . . . . . . .** . . . . . . . . . .26 . . . . . . . . . 84 . . . . . . . . . .69 . . . . . . . . . .31<br />
Denver, CO . . . . . . . . . . . . . . . . . .** . . . . . . . . . .18 . . . . . . . . . 74 . . . . . . . . . .89 . . . . . . . . . .30<br />
Source: Expansion Management, Relocation Toolkit<br />
Note: New Jersey/Philadelphia is represented by an average of Trenton (NJ) and Philadelphia (PA)<br />
Adult &<br />
Income<br />
Percentile<br />
Student per Teacher Ratio<br />
2000 2001 2002 2003<br />
Location<br />
Boston, MA . . . . . . . . . . . . . . . .N/A . . . . . . . . .N/A . . . . . . . .13.3 . . . . . . . .13.9<br />
New Jersey/Philadelphia . . . . . .15.1 . . . . . . . . .14.6 . . . . . . . .14.5 . . . . . . . .14.3<br />
Raleigh-Durham, NC . . . . . . . .14.7 . . . . . . . . .15.1 . . . . . . . .14.4 . . . . . . . .14.7<br />
Austin,TX . . . . . . . . . . . . . . . . .14.5 . . . . . . . . .14.2 . . . . . . . .14.5 . . . . . . . .14.8<br />
Washington, DC . . . . . . . . . . . .15.8 . . . . . . . . .14.9 . . . . . . . .16.3 . . . . . . . .14.9<br />
Chicago, IL . . . . . . . . . . . . . . . .17.0 . . . . . . . . .17.1 . . . . . . . .17.0 . . . . . . . .17.6<br />
Denver, CO . . . . . . . . . . . . . . . .18.2 . . . . . . . . .17.8 . . . . . . . .17.4 . . . . . . . .17.8<br />
Seattle, WA . . . . . . . . . . . . . . . .15.8 . . . . . . . . .20.1 . . . . . . . .20.3 . . . . . . . .20.5<br />
Portland, OR . . . . . . . . . . . . . . .20.2 . . . . . . . . .20.6 . . . . . . . .21.0 . . . . . . . .20.8<br />
San Diego, CA . . . . . . . . . . . . . .20.9 . . . . . . . . .20.9 . . . . . . . .20.8 . . . . . . . .20.9<br />
San Jose, CA . . . . . . . . . . . . . . . . . .20.6 . . . . . . . . . . .20.3 . . . . . . . . .20.3 . . . . . . . . .21.0<br />
New York, NY . . . . . . . . . . . . . . . .15.9 . . . . . . . . . . .15.8 . . . . . . . . .21.9 . . . . . . . . .36.4<br />
Source: National Center for Education Statistics, US Dept. of Education.<br />
20
Education<br />
These changes in student demographics have ramifications at<br />
the end of the “pipeline.”<br />
For our Latino students, the college pipeline—and thus the<br />
workforce pipeline—is narrow. According to the Public Policy<br />
Institute of California, Latino students make up 33% of the<br />
state’s public high school graduates, but 14% of UC enrollees<br />
and 23% of CSU enrollees. Moreover, only 16% of Latino students<br />
are eligible for CSU and 7% are eligible for UC—half of<br />
their white counterparts. (Source: PPIC; Educational<br />
Resources and Outcomes by Race & Ethnicity, 2005)<br />
In <strong>Silicon</strong> <strong>Valley</strong>, the scope of the path and reliability of this<br />
“pipeline” becomes evident upon examination of the class<br />
enrollment data for ethnic groups in the region.<br />
In large part, the past decade shows increasing enrollment in<br />
college preparatory classes within each of the ethnic groups in<br />
<strong>Silicon</strong> <strong>Valley</strong> (see bar graphs). But, in the context of all of the<br />
9-12th grade students enrolled in those courses, as the courses<br />
progress, the share of Latino students enrolling declines dramatically.<br />
(Note: SVLG data analysis found this to be true in<br />
1st year chemistry and physics enrollment.)<br />
How California and <strong>Silicon</strong> <strong>Valley</strong><br />
Can Make Progress<br />
Student success in K-12 will come from a strong teacher<br />
and principal corps. The teaching profession is in constant<br />
change, and the demographics surrounding it are not promising:<br />
more teachers retiring than entering, mandates from<br />
Sacramento multiplying, and teacher salaries lagging behind<br />
the cost of living, to name a few.<br />
The state must support professional development to ensure<br />
that schools are implementing a sound, standards-based<br />
curriculum and instructional programs, and provide teachers<br />
and principals with the tools needed to instruct a diverse population<br />
in a changing world. If the state is serious about developing,<br />
recruiting and retaining teachers—particularly in<br />
math and science—then it should invest with “both feet.”<br />
The California Teach program, which is designed to recruit<br />
science and math graduates into the teaching profession,<br />
received most of its initial funding from the private sector and<br />
$1 million from the state.<br />
Investing in what matters. Achievement and advancement<br />
in math and science are the bedrock of <strong>Silicon</strong> <strong>Valley</strong>’s innovation<br />
economy. Our nation, state and region—particularly<br />
within high-need schools—are facing a critical shortage of<br />
math and science teachers. The way that the state allocates<br />
funding—in an overly complex manner and through a myriad<br />
of restrictive categorical programs—does little to allow our<br />
public K-12 and higher education systems to adapt to changing<br />
times. Moreover, market forces must enter into the equation<br />
for recruiting and retaining talent in critical fields.<br />
Hold districts to high standards and give them flexibility<br />
to meet those standards. It is common practice to give districts,<br />
in the name of local control, additional resources that<br />
are quickly followed by restrictions. The state has established<br />
a standards and accountability system. Districts should be<br />
allowed to retain flexibility in meeting those standards; districts<br />
that are successful retain flexibility and districts that are<br />
not as successful receive less. The current system does not<br />
allow innovation at the district or school level.<br />
Students need to be aware of the pathways ahead of them<br />
(workplace, college, financial aid, etc.). This is particularly<br />
important for students of immigrant families or from underrepresented<br />
populations. The fact that an entire high school<br />
might share a guidance counselor or two is unacceptable,<br />
although recent efforts by the Legislature and Governor to earmark<br />
funding for guidance counselors is a step in the right<br />
direction.<br />
Access to college needs to be available and predictable.<br />
Students and families should not have to wonder from year to<br />
year whether there will be a place for qualified applicants at<br />
state colleges and universities and what it might cost.<br />
Skills for entering the workplace and for entering college<br />
are converging. A high school diploma needs to convey that<br />
the graduate has mastered a specific set of skills; that, in large<br />
part, the student is prepared to enter college, university or<br />
the workforce; and that it is not the end of the individual’s<br />
learning. California needs to maintain high standards and<br />
expectations, and students will rise to the occasion.<br />
Make decisions based on accurate student and teacher<br />
data. As California rightfully raises academic standards, it<br />
needs a data system that will support accountability, particularly<br />
when it comes to high school graduation and proficien-<br />
21
Education<br />
cy. We cannot expect to know where students are going or<br />
have gone if we do not accurately track their progress.<br />
Encourage private-public partnerships. There is more that<br />
business and industry can do, particularly by way of internships<br />
and fellowships for students and teachers. SVLG regularly<br />
hears from our education partners about the importance of<br />
providing relevant and engaging opportunities that expose<br />
our educators and students to changes in technology, the<br />
workplace and career path options. This is particularly important<br />
for socio-economically disadvantaged populations.<br />
Support for K-12 and higher education infrastructure<br />
needs to be sustainable, equitable, and should be commensurate<br />
with the cost to educate students. We need to<br />
ensure reliable funding streams that do not unduly place the<br />
burden on one constituency. Voters in recent state and local<br />
elections have been cautious about substantial program<br />
changes (e.g., universal preschool) that tax one group or activity<br />
for a larger benefit.<br />
If steps are not taken to develop and harness the brainpower<br />
that powers our innovation economy, our region could face a<br />
“fuel shortage” that would have ripple effects throughout the<br />
economy and from which it would be difficult to recover.<br />
Change, it has been said, is a constant. It goes hand-in-hand<br />
with <strong>Silicon</strong> <strong>Valley</strong>, with advancement, with California.<br />
California and <strong>Silicon</strong> <strong>Valley</strong> have a lot of ground to cover, and<br />
the world, as it continues to “flatten,” will not wait.<br />
Best Practices - Lessons Learned<br />
The Teacher Advancement Program (TAP) was<br />
launched in 1999 by the Milken Family<br />
Foundation to attract, retain, develop, and motivate<br />
talented people in the teaching profession. The<br />
program contains four core elements: 1) multiple<br />
career paths for teachers within the classroom; 2)<br />
ongoing, applied professional growth; 3) instructionally<br />
focused accountability; and 4) performancebased<br />
compensation. The career paths component<br />
provides teacher leaders with advancement opportunities<br />
and compensation increased accordingly. The<br />
professional development component requires<br />
teachers to meet weekly in subject or grade-level<br />
“cluster groups” led by master or mentor teachers to<br />
address challenges in their particular classrooms.<br />
The TAP model requires that teachers are evaluated<br />
4 to 6 times a year by a school leadership team, and<br />
it provides TAP teachers with bonuses based on<br />
their classroom evaluations and the achievement<br />
growth of their students. TAP also supports incentive<br />
pay for “hard-to-staff” schools and subjects.<br />
In the preliminary results from the 2005 TAP study,<br />
the average TAP schools gained 10-21 percent more<br />
than control schools did each year on achievement<br />
tests.<br />
TAP is in various stages of implementation in more<br />
than 100 schools across the nation, including<br />
schools in Austin (TX), Tucson (AZ), and<br />
Washington, D.C.<br />
22
Environment
Environment<br />
<strong>Silicon</strong> <strong>Valley</strong> has always operated at the crossroads of change.<br />
From ranching to orchards, orchards to factories, factories to<br />
board rooms, board rooms to the next wave of technology and<br />
innovation that responds to local, national and global challenges<br />
and opportunities. <strong>Silicon</strong> <strong>Valley</strong> also exists in the<br />
crossroads of circumstances unique to this region as well as<br />
those common to any high tech region in the world.<br />
Fostering Innovation and Businesses that can<br />
Change the World<br />
“Clean Tech” is an emerging sector of service or technology<br />
businesses that economize the use of natural resources, employ<br />
less hazardous methods or materials, or offer solutions to problems<br />
such as water treatment, waste management or energy<br />
supply challenges.<br />
<strong>Silicon</strong> <strong>Valley</strong> has a proud legacy of being the birthplace of<br />
many businesses and ideas that have changed the world. It is<br />
possible that the next wave of innovation and opportunity will<br />
transform <strong>Silicon</strong> <strong>Valley</strong> into an incubator for “Clean Tech,”<br />
especially the clean energy aspect of clean tech.<br />
Venture Capital Investing<br />
Venture capital investment is one metric used to describe the<br />
development of new technology clusters.<br />
United States-based venture capital (VC) investments in energy<br />
technologies increased from $716 million in 2004 to $917<br />
million in 2005. As a percent of total VC investments, energy<br />
tech increased from 3.3 percent in 2004 to 4.2 percent in<br />
2005. Global wind and solar markets reached $11.8 billion<br />
and $11.2 billion in 2005—up 47% and 55%, respectively,<br />
from a year earlier. The market for biofuels reached $15.7 billion<br />
globally in 2005, up more than 15% from the previous<br />
year. According to Clean Edge research, biofuels (global manufacturing<br />
and wholesale pricing of ethanol and biodiesel) will<br />
grow from $15.7 billion in 2005 to $52.5 billion by 2015.<br />
Clean-energy sources, particularly wind power and biofuels,<br />
are now often price-competitive with their conventional rivals<br />
—and in some cases, they’re cheaper. This is the result of<br />
prices for oil and natural gas increasing and clean-energy costs<br />
falling due to market growth, economies of scale, and technology<br />
advances.<br />
150<br />
Unique U.S. Cleantech Companies Receiving Venture Capital<br />
Funding, by Region, 2001-2005 (Number of Companies)<br />
126<br />
119<br />
100<br />
75<br />
50<br />
40 40<br />
29<br />
18<br />
0<br />
West<br />
Coast<br />
Northeast<br />
Midwest<br />
South-<br />
East<br />
South-<br />
West<br />
Rockies/<br />
Plains<br />
North-<br />
West<br />
Source: Cleantech Venture Network<br />
24
Environment<br />
California Venture Capital in Clean tech<br />
California attracted $484 million in “Clean tech” venture capital<br />
in 2005. California also dominated in the number of deals<br />
for the two year period 2004 -2005, capturing 30% of the 367<br />
deals.<br />
California has repeatedly taken the lead in adopting environmentally-conscious,<br />
business friendly policy. The PIER<br />
(Public Interest Energy Research) program, the CalPERs and<br />
CalSTERs clean tech initiatives, California’s Renewable<br />
Portfolio Standard, and various<br />
State incentives for solar and wind energy have all made<br />
California an attractive place for clean tech businesses.<br />
While California leads, the Boston area is catching up quickly,<br />
and the percentage of increase in investment is rising faster<br />
in the Northeast, Midwest and Southwest.<br />
150<br />
126<br />
Unique U.S. Cleantech Companies by Region,<br />
2001-2005 (Number of Companies)<br />
119<br />
100<br />
California’s Share of CleanTech VC 2005 - by Sector<br />
75<br />
50<br />
40 40<br />
29<br />
18<br />
0<br />
West Coast Northeast Midwest<br />
Source: Cleantech Venture Network<br />
Southeast South Coast Rockies/<br />
Plains<br />
Northwest<br />
$800<br />
$700<br />
$600<br />
$500<br />
$400<br />
$300<br />
$200<br />
$100<br />
$0<br />
Source: Cleantech Venture Network<br />
$738.8<br />
CleanTech VC 2005 - by Sector<br />
VC Investments in Focus Area<br />
($1.6B invested in 2005)<br />
$361.5<br />
$120.9 $87.2 $62.9 $46.9 $27.2<br />
$161.3<br />
Source: Cleantech Venture Network<br />
E n e r g y<br />
M a t i s & N a n o<br />
W a t e r<br />
M a n u f a c t u r i n g<br />
E n a b l i n g T e c h<br />
T r a n s p o r t a t i o n<br />
E n v i r o n m e n t a l<br />
O t h e r<br />
There is also growing recognition by policy-makers at the<br />
national and state level that clean tech can be a valuable asset<br />
in creating jobs, improving environmental performance, and<br />
promoting national resource independence. California and<br />
<strong>Silicon</strong> <strong>Valley</strong> in particular have the potential to capitalize on<br />
market and investment trends. To ensure <strong>Silicon</strong> <strong>Valley</strong><br />
remains pre-eminent in the innovation arena, local and regional<br />
governments should continue to encourage the incubation<br />
of small start-ups, and support policies that encourage businesses<br />
to locate and remain in <strong>Silicon</strong> <strong>Valley</strong>.<br />
Global Investments<br />
In 2005, clean tech captured 8.5% of the $6.02 billion in venture<br />
capital that was invested in North America. There were<br />
67 clean tech deals in North America and another 36 deals in<br />
Europe during the first quarter of 2006. Among the deals: 19<br />
of the companies were from the UK, 3 from Denmark, 2 each<br />
from Germany and France, and one each from Sweden,<br />
Finland, Switzerland and Israel. While North America leads,<br />
and California is the leader in North America, there are strong<br />
challenges from other regions and abroad.<br />
25
Environment<br />
“Best Practices—Lessons Learned”<br />
Regions attracting clean tech venture capital investments<br />
have the following characteristics:<br />
• Local, regional and state-level proactive<br />
environmental policy<br />
• Existing technology ‘clusters’ that raise the<br />
collective profile of the industry as a group<br />
and enable businesses to compete with as well<br />
as support each other<br />
• Proximity to centers of advanced education and<br />
research such as universities and government<br />
research laboratories.<br />
• Access to capital<br />
• Desirability of location as characterized by: strong<br />
networks among ‘up-and-coming’ entrepreneurs,<br />
high quality of life or ‘hip-ness’<br />
• Plentiful managerial and entrepreneurial talent<br />
• Fiscal policies that support emerging clean tech<br />
businesses<br />
The emerging Clean Tech sector in <strong>Silicon</strong> <strong>Valley</strong> and<br />
California benefits by having all of these characteristics<br />
as a foundation for growth. Additional California<br />
policies encouraging clean tech include:<br />
• The 2004, CalPERS “Green Wave” Environmental<br />
Technology Investment Program<br />
• A 20% by 2017 Renewable Portfolio Standard<br />
• The PIER Program, awarding $62 million annually<br />
to energy research by partnering with RD&D<br />
organizations, individuals, businesses, utilities,<br />
and public or private research institutions.<br />
• Use of Public Goods Charges to fund energy<br />
efficiency and conservation programs.<br />
• State Green Building and Green Purchasing<br />
policies.<br />
70%<br />
60%<br />
50%<br />
40%<br />
30%<br />
20%<br />
10%<br />
69%<br />
Semiconductors<br />
California’s share of US VC Invesment,<br />
by Sector (2005)<br />
49%<br />
Med. Devices<br />
&<br />
Equipment<br />
Source: Cleantech Venture Network 2006<br />
47% 46%<br />
Software Biotechnology Telecom CLEANTECH<br />
<strong>Silicon</strong> <strong>Valley</strong>’s unique challenges: What could be<br />
on our horizon?<br />
Like any place, <strong>Silicon</strong> <strong>Valley</strong> has a mixture of blessings and<br />
challenges. While we count our blessings, we must be mindful<br />
of the challenges and strive to address these as proactively<br />
as possible.<br />
Water Reliability<br />
<strong>Silicon</strong> <strong>Valley</strong> is fortunate in having multiple sources of water.<br />
Depending on the year, local supplies make up about half of<br />
our water. In the southern part of <strong>Silicon</strong> <strong>Valley</strong>, Delta water<br />
makes up most of the other half. Water from the San Francisco<br />
Hetch Hetchy system is the largest source, often the exclusive<br />
source, in the northern/peninsula portion of <strong>Silicon</strong> <strong>Valley</strong>.<br />
Like an investor with a diverse portfolio of stocks, our multiple<br />
sources of water and the cooperative linkages that now<br />
exist between water systems, ensure that the region’s supply is<br />
secure. However, each source has some significant challenges.<br />
43%<br />
CA total = 47%<br />
36%<br />
26
Environment<br />
The Delta<br />
The Sacramento/San Joaquin River Delta provides much of<br />
<strong>Silicon</strong> <strong>Valley</strong>’s and two thirds of the state’s population with<br />
drinking and irrigation water. The Delta is also a rich ecosystem<br />
and provides the state with fisheries, agricultural and<br />
recreational resources. However, the Delta system is under<br />
stress and there are some serious threats to be addressed.<br />
Levees<br />
There are more than 1100 miles of levees in the Delta. Levees<br />
are a critical part of the Delta’s structure and ensure that residential<br />
and agricultural lands are protected from flooding, and<br />
that salt water from the San Francisco Bay is not drawn into<br />
the Delta where it can contaminate drinking and irrigation<br />
water. However, there are several stresses on delta levees all<br />
adding up at once. According to Dr. Jeffrey Mount, of UC<br />
Davis, the Delta ‘looses ground’ due to soil decomposition,<br />
subsidence and erosion at a rate of 23,000 cubic meters of<br />
additional space below sea level every day. Some parts of the<br />
Delta are approaching 20 feet below sea level. As this volume<br />
of below sea level space increases, more and more pressure is<br />
put on the levees. Because it is not possible to stop these<br />
changes, California will eventually face some difficult and<br />
costly choices about how to manage the delta and the levees<br />
that protect people, infrastructure, property and water supply<br />
resources.<br />
According to the Department of Water Resources, both the<br />
federal Central <strong>Valley</strong> Project and the State Water Project,<br />
built to deliver water to millions of Californians, are dependent<br />
on fragile Delta levees to protect water supply and water<br />
quality.<br />
State highways, railroad lines, water supply pipelines that<br />
serve much of the San Francisco Bay area, energy transmission<br />
lines, and petroleum pipelines now cross the Delta, and rely<br />
on the continued stability of Delta levees. All together, more<br />
than $47 billion in infrastructure is protected by central valley<br />
levees.<br />
In addition to the concerns regarding levees, the Delta is also<br />
facing fishery ecosystem deterioration and declining water<br />
quality. While the detailed analysis as to the causes of these<br />
challenges is still underway, some known pressures on the<br />
Delta include; increased urban and agricultural run-off,<br />
impacts of invasive species, fresh water diversions/lower flowthrough<br />
volumes, and changes in seasonal flow patterns as rain<br />
replaces snow in the Sierras and spring thaws come earlier and<br />
faster due to global warming.<br />
The Department of Water Resources has recently begun a<br />
study of the long term risks and possible mitigations or adaptation<br />
strategies for the Delta. With better information about<br />
the long term risks facing this vital resource, <strong>Silicon</strong> <strong>Valley</strong><br />
and the state will be able to better prepare for the future.<br />
The Hetch Hetchy System<br />
Almost 100 years ago, the City and County of San Francisco<br />
implemented an unprecedented water supply project that conveyed<br />
water over 200 miles from the Sierras to the City of San<br />
Francisco by gravity power alone. The project flooded a pristine<br />
valley in a national park, but also provided a secure supply<br />
of very high quality water and electricity to San Francisco<br />
and many other communities in the Bay Area.<br />
27
Environment<br />
The San Francisco Public Utilities Commission (SFPUC)<br />
launched a $4.3 billion Water System Improvement Program<br />
to repair, replace, and seismically upgrade the aging system.<br />
More than 75 projects are to be completed by the end of 2015.<br />
Some of these projects include:<br />
• New and rehabilitated pipelines from the Sierra Nevada to<br />
the Bay Area, adding redundancy for rerouting water in<br />
emergencies<br />
• A new or repaired Calaveras Dam in southern Alameda<br />
County, to meet seismic safety needs (a proposal to increase<br />
capacity has been shelved)<br />
• A new Irvington Tunnel, as a backup to carry water<br />
through the East Bay hills<br />
• Installing valves and strengthening pipelines where they<br />
cross the Hayward Fault<br />
• Upgrades and capacity increases at the Sunol <strong>Valley</strong> Water<br />
Treatment Plant<br />
• Improvements to regional system facilities within San<br />
Francisco—new or improved reservoirs, an upgrade at the<br />
Lake Merced pump station, and new transmission pipelines<br />
28
Environment<br />
Proposal to dismantle the dam and restore the<br />
Hetch Hetchy <strong>Valley</strong><br />
In the past few years, various environmental activist organizations<br />
in California have been pressing for studies and consideration<br />
of a proposal to dismantle the O’Shaunessey dam, drain<br />
the Hetch Hetchy reservoir and restore the valley to its preinundation<br />
condition. Recently the Department of Water<br />
Resources completed its evaluation of all previous studies related<br />
to this proposal and provided a gap analysis of necessary<br />
additional information and a cost estimate for such a project.<br />
While the DWR determined that the proposal was hypothetically<br />
feasible, there are many significant impediments,<br />
including; removal of the dam, replacing the water and energy<br />
with equally high quality and reliable supplies, water<br />
rights, protection of Native American sacred sites, and not<br />
least—a $10 billion dollar price tag.<br />
The proposal to restore the beauty of the valley that was sacrificed<br />
to provide San Francisco and the Bay Area with water<br />
will continue to have an emotional appeal, even though the<br />
cost is astronomical. It remains to be seen if this proposal will<br />
receive continued consideration, given the magnitude of the<br />
cost, and the many other pressing priorities for those<br />
resources.<br />
(Source: Jeffrey Mount, Ph.D, Professor; Director, Center for Watershed Sciences<br />
Roy J. Shlemon Chair in Applied Geosciences)<br />
29
Environment<br />
Municipal water rates per 1000 cubic feet (not including meter charges and taxes)<br />
San Jose, CA . . . . . . . . . . . . . . . . . . . . . . . . . . . . . . . .$1.87<br />
San Diego, CA . . . . . . . . . . . . . . . . . . . . . . . . . . . . . . .$1.60<br />
Phoenix, AZ . . . . . . . . . . . . . . . . . . . . . . . . . . . . . . . .$1.86<br />
Washington DC . . . . . . . . . . . . . . . . . . . . . . . . . . . . .$1.93<br />
North Carolina . . . . . . . . . . . . . . . . . . . . . . . . . . . . . .$1.09 (rates decrease as use increases)<br />
Boston, MA . . . . . . . . . . . . . . . . . . . . . . . . . . . . . . . . .$ 4.32 (rates increase as use increases)<br />
San Francisco City and County . . . . . . . . . . . . . . . . . .$1.97<br />
San Francisco dependent water customers . . . . . . . . . .~$2.45 (varies somewhat by municipality)<br />
Austin, TX . . . . . . . . . . . . . . . . . . . . . . . . . . . . . . . . .$2.46<br />
Seattle, WA . . . . . . . . . . . . . . . . . . . . . . . . . . . . . . . . .$2.88 (rates vary by season)<br />
Portland, OR . . . . . . . . . . . . . . . . . . . . . . . . . . . . . . . .$1.77<br />
Sources: Current municipal or water supply agency websites<br />
30
Health Care
Health Care<br />
Throughout our country, there is widespread agreement that<br />
the health care system is too expensive and inefficient, yet<br />
there is little agreement on what reforms and solutions we<br />
need. Despite this lack of consensus, changes are underway,<br />
including here in our region, which could lead to permanent<br />
structural improvements in cost and quality.<br />
Any discussion of the health care system in <strong>Silicon</strong> <strong>Valley</strong> and,<br />
indeed, the United States, requires careful definition. First, is<br />
health care a quality-of-life or a cost of doing business issue?<br />
Is there a greater social good or a long-term cost incentive in<br />
providing universal access to care? While the system provides<br />
for our well-being, a deeply personal human need, it is provided<br />
as a quantified benefit of employment, or even a government-sponsored<br />
program. In addition, any significant changes<br />
in the regulation of the system pose a potential threat to its<br />
cluster of supporting industries.<br />
How, therefore, do we approach reform and improvements in<br />
the system? What best practices and emerging trends hold the<br />
most promise? This section will offer some different perspectives<br />
and seek to identify common ground.<br />
Regional business leaders are becoming more interested about<br />
the system, due largely to increased healthcare costs. Their<br />
concerns are being expressed through efforts such as the<br />
<strong>Silicon</strong> <strong>Valley</strong> Health IT Pay for Performance Program, which<br />
provides financial incentives for local providers to adopt electronic<br />
medical records and best practices in automation. In<br />
2005, former Intel CEO Andy Grove published an article in<br />
the Journal of the American Medical Association drawing parallels<br />
between the microchip and medical industries, in which<br />
he suggested process improvements and lessons about efficiency<br />
which the medical system might learn from. 3<br />
In general, employers continue to see their employees’ health as<br />
an imperative, but are struggling to reconcile price increases<br />
with the many other expenses that <strong>Silicon</strong> <strong>Valley</strong> companies face.<br />
By the Numbers–the Cluster<br />
Average wage in the bioscience cluster in 2004: $65,775.<br />
National average wage, private sector: $39,000. 4<br />
By the Numbers –the Costs<br />
According to the Centers for Medicare & Medicaid Services,<br />
health care expenditures in the US were over $1,877 billion<br />
in 2004; this represented about 16% of GDP. Per capita<br />
expenditures were $6,280 per person in the same year.<br />
The Employer Perspective<br />
In Santa Clara County, the percentage of residents with insurance<br />
by their own employer or someone else’s (e.g. spouse, parent)<br />
is 76.8. 1 Most employers in California offer, and pay for<br />
at least some portion of, their employees’ health care/insurance:<br />
recent data indicate this is true for about 66% of<br />
employers, representing nearly 90% of workers in the state,<br />
with an estimated 63% of workers taking advantage of this<br />
benefit. 2 However, this percentage has been slowly decreasing,<br />
due both to some employers dropping coverage and fewer new<br />
small businesses offering insurance.<br />
Costs, as measured by annual premium increases, are rising at a<br />
rapid rate. Many recent studies peg the rate of increase in health<br />
care costs in the US ranging from 8-12% per year over the past<br />
5 years, compared with an economy growing at 4% or less.<br />
The Business Cluster Perspective<br />
Hospitals, clinics, medical practices, insurers, bio-tech and<br />
pharmaceutical companies, and medical device companies are<br />
among the major business interests in the health care field.<br />
<strong>Silicon</strong> <strong>Valley</strong>’s unique ecosystem of venture capital, education<br />
institutions and the highly educated workforce they spawn creates<br />
a dynamic where changes in the policy environment for life<br />
sciences and medical fields are felt acutely. For example, the<br />
passage of the ballot initiative for state-funded stem cell<br />
research, and subsequent establishment of its managing institute<br />
in San Francisco, has been met with an enthusiasm far<br />
greater than the dollars it represents. Companies have been<br />
formed and made expansion decisions largely predicated on the<br />
institute and the commitment it represents to the industry.<br />
<strong>Silicon</strong> <strong>Valley</strong> is home to concentrated clusters in the medical<br />
devices as well as the research, testing and medical laboratories<br />
field, which are both large and rapidly growing in our<br />
region compared to other areas. However, Southern California,<br />
New York/New Jersey, and other regions are major competitors;<br />
and California struggles to maintain its position as other<br />
states aggressively pursue tax and economic development<br />
strategies to lure companies. 5<br />
32
Health Care<br />
By the Numbers–Consumers<br />
According to the Centers for Medicare & Medicaid Services,<br />
households expended 32% of the dollars for health care in<br />
the US in 2003. Private-sector employers represented 26%,<br />
and the government paid 39%.<br />
While a plurality of health care expenses continue to be borne<br />
by government, the trend in spending is toward greater consumer<br />
costs and away from employer costs. There are several<br />
components to this equation: increased employee participation<br />
in their premiums, larger co-pays, and a new “consumerism”<br />
represented by trends such as high-deductible<br />
plans with health savings accounts.<br />
Ideally this trend would also reflect a growing number of individuals<br />
having insurance coverage; unfortunately, it is not.<br />
Rates of uninsured adults continue to rise in the US.<br />
However, our coverage rate in Santa Clara County is 88.3%<br />
overall (by all sources) 6 , and there are some very positive developments<br />
in <strong>Silicon</strong> <strong>Valley</strong> that may reverse the tide. Santa<br />
Clara County is home to one of the earliest and most aggressive<br />
local efforts to get all children insured. It has had tremendous<br />
success enrolling eligible kids into existing state and federally-funded<br />
programs, as well as directly insuring others.<br />
Several other counties in the state have followed suit, and our<br />
state government has looked at the possibility of expanding<br />
the program statewide.<br />
100<br />
98<br />
96<br />
94<br />
92<br />
90<br />
88<br />
86<br />
84<br />
0<br />
The Consumer<br />
Insured Children, 0-18 Years<br />
San Diego<br />
Santa Clara<br />
A comparison region to <strong>Silicon</strong> <strong>Valley</strong>, Boston, is at the center<br />
of the statewide program initiated in Massachusetts to extend<br />
health insurance to all residents.<br />
Best Practices—Lessons Learned<br />
Massachusetts Health Care Reform Plan<br />
The Massachusetts plan requires the participation of both<br />
individuals and employers. It mandates everyone in the<br />
state to purchase health insurance by July 1, <strong>2007</strong>, and<br />
would impose financial penalties of up to 50 percent of the<br />
cost of a health insurance plan on those who do not via<br />
income tax filings. It also includes a requirement that<br />
employers with more than 10 employees provide health<br />
insurance coverage or pay a “Fair Share” contribution of up<br />
to $295 annually per employee. The Governor vetoed this<br />
provision of the plan; however, the legislature has the votes<br />
to override the veto.<br />
The plan creates the Commonwealth Health Insurance<br />
Connector to “connect” individuals to insurance by offering<br />
affordable, quality insurance products. Small businesses<br />
and individuals can purchase insurance through the<br />
Connector. The Connector will also offer specially<br />
designed, lower-cost products for 19-26 year-olds. It is<br />
expected that up to 215,000 residents will purchase coverage<br />
through the Connector.<br />
Employers with more than 10 workers will be required to<br />
offer a Section 125 “cafeteria plan” that permits workers to<br />
purchase health care with pre-tax dollars. Using these pretax<br />
dollars, workers not offered insurance will be able to<br />
purchase insurance products through the Connector.<br />
Massachusetts Health Care Reform Plan, Publication<br />
#7494, Kaiser Family Foundation<br />
While it is too early to determine if the combination of<br />
employer and personal responsibility for costs will change<br />
the competitive landscape, it will be interesting to follow<br />
in the future. At the same time, 2 local jurisdictions, the<br />
City and County of San Francisco and San Mateo County,<br />
are looking to adopt universal health care for adults, but<br />
under different models.<br />
33
Health Care<br />
Encouraging Trends<br />
The interest of the medical community in adopting<br />
evidence—based medicine is increasing, which bodes well for<br />
achieving better outcomes. This body of practice emphasizes<br />
clinically validated best practices and protocols, an area that<br />
has been somewhat neglected in the past. These practices are<br />
as simple as regularizing inventory control procedures for<br />
drugs, or more complicated, such as adopting four effective<br />
practices to prevent ventilator-acquired pneumonia (VAP). 9<br />
While not every aspect of evidence-based medicine will be<br />
adopted by all practitioners (or institutions), there is great<br />
promise for increased effectiveness and decreased avoidable<br />
errors, which have very dear human and fiscal costs.<br />
While it appears that Americans on the whole are becoming<br />
less healthy, the resurgence of wellness programs discussed in<br />
last year’s <strong>Projections</strong> continues. As data continues to point<br />
towards greater proportions of obesity and other risk factors<br />
for complex chronic illnesses (diabetes, heart disease, etc.),<br />
prevention has never been more important. California’s demographics<br />
are a challenge in terms of obesity, which is becoming<br />
more prevalent among Latinos, a group which is traditionally<br />
hard to reach with lifestyle change programs.<br />
Emphasis on exercise and nutrition through the K-12 education<br />
system is one effective means of reaching vulnerable populations.<br />
Current budget constraints make these programs difficult<br />
to begin and sustain, but Santa Clara County is trying<br />
to reach all 5th graders with a uniform program.<br />
Some very large corporations and government employers in<br />
<strong>Silicon</strong> <strong>Valley</strong> are self-insured, which entails either negotiating<br />
with providers and/or directly paying employee expenses.<br />
This provides some latitude in dealing with providers, as well<br />
as more direct returns on wellness programs.<br />
How Uninsured Are Covered Under the<br />
Massachusetts Health Care Reform Plan<br />
Remain Uninsured<br />
35,000 residents<br />
Private Insurance<br />
215,000 residents<br />
Medicaid Expansion<br />
92,500 residents<br />
Subsidized Coverage<br />
207,500 residents<br />
By the Numbers–Best Practices<br />
Adoption of VAP-Avoidance techniques at Virginia<br />
Mason Medical Center reduced the number of cases from<br />
34 in 2002 to 1 in 2005, with an estimated cost reduction<br />
from $500,000 to $15,000 for the hospital. 10<br />
Total Uninsured – 550,000<br />
34
Health Care<br />
Jurisdiction San Francisco 7 San Mateo County 8<br />
Brief Description<br />
Creation of a Health Access Program<br />
that offers comprehensive health-care<br />
services to uninsured San Franciscans<br />
and their employers at a reasonable<br />
cost, with subsidies for small and<br />
medium-sized businesses and low<br />
and moderate-income individuals.<br />
Would emphasize preventive care<br />
through regular checkups, which<br />
would limit the amount of people<br />
who need the emergency room.<br />
However, this would not be the same<br />
as health insurance because it will<br />
not extend health care coverage outside<br />
of the city limits.<br />
The county already provides universal<br />
children’s health coverage<br />
through its Children’s Health<br />
Initiative program (Healthy Kids),<br />
and the same could be done for<br />
adults earning less that 400% of the<br />
federal poverty level.<br />
The current Health Plan of San<br />
Mateo and WELL (Wellness<br />
Education Linkage Low Cost) program<br />
work independently to provide<br />
health coverage for people with very<br />
low incomes, but fails to help homeless<br />
and those making slightly more<br />
than the low salaries that qualify for<br />
the programs. However, there are<br />
talks of the Health Plan taking over<br />
the county’s WELL program, which<br />
believe it will save money that can<br />
be used to create new adult programs.<br />
Payors<br />
Estimated to cost $200 million<br />
annually, and is planned to be paid<br />
through city funds, and also through<br />
a combination of business contributions<br />
and member premiums.<br />
The cost of providing such a plan<br />
could be lessened by using a combination<br />
of taxpayer dollars from its<br />
health care districts, and a contribution<br />
from private hospitals and business<br />
owners to put together its plan.<br />
Benefits<br />
Low-cost medical services for thousands<br />
of uninsured, including non-<br />
US citizens.<br />
The Health Access Program would<br />
give individuals access to a primarycare<br />
doctor, nurse or medical assistant<br />
at one of the city’s public or<br />
nonprofit clinic. Enrollees can receive<br />
acute care and specialty services<br />
through a network, including San<br />
Francisco General Hospital and the<br />
city’s nonprofit hospitals. It would<br />
cover services such as doctor visits<br />
and surgeries, as well as prescription<br />
drugs.<br />
Low-cost medical services for thousands<br />
of uninsured, including non-<br />
US citizens.<br />
35
Health Care<br />
References<br />
1<br />
Santa Clara County Public Health Department, Santa Clara<br />
County Behavioral Risk Factor Survey 2004, Oct. 2004<br />
2<br />
California HealthCare Foundation, Snapshot: Employer-Based<br />
Insurance: Coverage and Cost, 2006<br />
3<br />
Andrew S. Grove, PhD, Efficiency in the Health Care Industries:<br />
A View From the Outside, Commentary, Journal of the American<br />
Medical Association, Volume 204, No. 4, 2005<br />
4<br />
Growing the Nation's Bioscience Sector: State Bioscience Initiatives<br />
2006, Battelle Technology Partnership Practice and SSTI, April<br />
2006.<br />
5<br />
IBID, Battelle.<br />
6<br />
IBID, Santa Clara County Public Health Department<br />
7<br />
Allday, Erin, and Cecilia M. Vega. "Health Proposal May Pay<br />
Off Big." San Francisco Chronicle. 2 June 2006.<br />
Rosselli, Glen. "S.F. Plan a Path to Universal Health Care." San<br />
Francisco Chronicle. 12 July 2006.<br />
8<br />
San Mateo universal health care faces challenges,<br />
InsideBayArea.com, Laura Ernde, 7/14/2006<br />
Hundreds call for new deal in health care, The Daily Journal, San<br />
Mateo County, Dana Yates<br />
County explores universal health care, The Half Moon Bay Review,<br />
Marc Longpre<br />
9<br />
Virginia Mason Medical Center, Harvard Business Review,<br />
January 11, 2006 revision, pp 10-11.<br />
10<br />
Virginia Mason Medical Center, Harvard Business Review,<br />
January 11, 2006 revision - p11.<br />
36
Energy
Energy<br />
The 2000-2001 California Energy Crisis made almost daily<br />
worldwide news and thrust energy policy irrevocably to the<br />
forefront of the public's attention. Five years later, we now see<br />
that period as a watershed in attitude and policy for the state,<br />
as well as for the U.S.<br />
What is different today? What trends have shaped our present<br />
policy from that crucible? What technological breakthrough<br />
will revolutionize our efficiency and cost?<br />
These are some of the major shifts in thinking in the public<br />
arena in the past year:<br />
• Record-breaking weather is underscoring a growing belief<br />
that man-made warming is leading to a global disaster<br />
• Record cost of gasoline is fueling the desire to wean<br />
California and the U.S. from sources of fuel produced<br />
by unstable foreign governments<br />
• The cost of natural gas tripling after Hurricane Katrina<br />
• The belief that renewable sources of power, especially<br />
solar photovoltaic, wind power and biomass to replace<br />
petroleum-based fuel can compete now<br />
GDP ($1,000 / Capita)<br />
Energy and Prosperity<br />
45<br />
40<br />
United States<br />
35<br />
30<br />
Germany<br />
France Australia<br />
25<br />
20<br />
United Kingdom<br />
Sweden<br />
South Korea<br />
15<br />
Czech Republic<br />
10 Brazil<br />
Africa<br />
IranSouth<br />
5 China<br />
Indonesia<br />
0<br />
0 50 100 150 200 250 300 350 400<br />
Energy Use (Million Btu / Capita)<br />
California Energy Commission<br />
The U.S. uses more<br />
energy and is more<br />
productive than<br />
other countries<br />
Source: CIA, World Factbook 6<br />
Heat Waves and Record Electric Demand<br />
How would our new policies and system upgrades perform<br />
under pressure? California would find out much sooner than<br />
expected.<br />
In late July, a high-pressure system locked over the American<br />
Southwest. Ten days of record heat, a 1 in 50 occurrence,<br />
exceeded peak demand five years before the power systems<br />
operator expected it with more than 50 Gigawatts needed on<br />
July 24. (See Figure 2 Demand curve) The news after it was all<br />
over is that nothing happened. Not a single power outage due<br />
to lack of resources (although there were distributed outages<br />
resulting from transformer equipment failure). With Flex<br />
Your Power and Voluntary Load Reduction Programs in place<br />
we had a large voluntary public response in conservation with<br />
approximately 1500 Megawatts saved (enough to power most<br />
of <strong>Silicon</strong> <strong>Valley</strong>). In all but one day, operating reserves<br />
exceeded 7 percent.<br />
The Central Dilemma<br />
So, we sailed through it all, even better than heat waves in<br />
other parts of the country. Not one power plant went down.<br />
Not one power line was lost. Not one blackout occurred.<br />
This appears to verify that California has new polices wired for<br />
success, principally:<br />
1. Energy efficiency is now first priority at the utilities and<br />
with the business community.<br />
2. The spinning bubble meter is dead! Five million smart<br />
meters are being installed by PG&E. Companies like<br />
Energy Connect have moved into the California market to<br />
help customers save 25% and more with electricity timeof-use<br />
strategies as they have in the Philadelphia /New<br />
Jersey area and Chicago.<br />
3. The priority of renewables is state law and Governor<br />
Schwarzenegger spearheaded solar spending of $3 billion<br />
on 3000 megawatts of solar power in the next ten years,<br />
enough to power nearly two <strong>Silicon</strong> <strong>Valley</strong>s.<br />
4. Wind power has become a juggernaut, nearly as cheap as<br />
natural gas power.<br />
5. We have solved our “wires” challenges across the state and<br />
near San Francisco allowing us to begin closing old, inefficient<br />
plants like Hunter’s Point.<br />
6. Some of the most successful and innovative solar power<br />
companies have their headquarters here in <strong>Silicon</strong> <strong>Valley</strong><br />
(ReGRID, Akeena Solar, Miasole, and Sun Power).<br />
7. We even have a new solar manufacturing plant committed<br />
to the <strong>Valley</strong>, setting us up to become a center of excellence<br />
in this arena.<br />
Is there still any reason to be concerned about our future?<br />
Maybe.<br />
38
Energy<br />
Price Volatility<br />
Comparing Gas Volitility<br />
to the Dow Jones<br />
• The natural gas price rally and<br />
subsequent price break in the last<br />
year would be equivalent of the<br />
Dow Jones going from 10,000 to<br />
25,000 and then back to 10,000.<br />
Over-Reliance on Natural Gas?<br />
One hurricane, then a second one exposed our weakness. Just<br />
like 6 years ago, the first rumblings of revolutionary change<br />
began in the natural gas market.<br />
Three headlines further clarified the emerging risk:<br />
• India declares a moratorium on new natural gas plants<br />
after 2012.<br />
• New natural gas pipeline to connect the gas-hungry<br />
eastern market with sources in the west.<br />
• Russia cuts off natural gas to customers in Europe.<br />
When hurricane Katrina mowed over the Gulf of Mexico,<br />
wrecking 15% of the nation’s capacity to deliver natural gas,<br />
prices soared 200% to an all time high of $15.62 (per thousand<br />
cubic feet).<br />
Now customers are paying attention. Risk management plans<br />
become required strategy. We were saved by a very mild winter,<br />
but experts predict $10-15 gas may become normal.<br />
The problem exposed by these events: “Half of our baseload is<br />
supplied by natural gas.”<br />
We are vulnerable and there is currently no workable substitute.<br />
New policies to control CO2, which will be signed by<br />
the Governor and the CPUC this year will render abundant<br />
and cheap conventional coal power not available. In addition,<br />
nothing has less legislative support than new dams for clean<br />
hydropower, and building a new nuclear plant is still officially<br />
illegal in the state.<br />
Can Wind and Solar Step In?<br />
Why can’t we just switch to renewable power like solar and<br />
wind? Why not indeed?<br />
Unfortunately, the physics of power production include limitations<br />
that are seldom discussed. Wind generated power’s<br />
secret is that the closer we get to the peak, the more it disappears.<br />
For July 24, 2006, our all-time record day, wind sources<br />
lost 80% of its capacity by the time we reached the peak in<br />
late afternoon, not even providing 2% of what we needed.<br />
This is typical. California use peaks from 3 to 6 pm, but wind<br />
typically peaks at 2 in the morning. Wind power must be<br />
backed up by baseload such as natural gas, nuclear and<br />
hydro-power. This fundamental weakness will remain until<br />
cost-effective energy storage technology catches up.<br />
What About Solar?<br />
Although less intermittent, solar power similarly suffers from<br />
a lack of coincidence with peak use, and is 2 to 5 times more<br />
costly per kilowatt generated. The good news is that breakthroughs<br />
in thin-film technology may change this.<br />
Further, neither solar nor wind can function to uphold the<br />
voltage of the grid to keep it stable from damaging surges and<br />
sags. Only baseload plants provide these “ancillary services” to<br />
smooth the bumps and dips created by these resources. This<br />
adds even more hidden costs.<br />
What, then, does our future hold? That depends.<br />
39
Energy<br />
Future Cost of Power in a Carbon<br />
Constrained World<br />
What will be the cost premium for our policy choice to tax<br />
carbon-based sources of fuel? The Electric Power Research<br />
Institute has researched this and has presented their findings<br />
in a diagram. It displays the heavy toll on coal-fired power<br />
sources. Depending on the carbon tax selected, the cost of coal<br />
could double. Natural gas costs could increase by nearly as<br />
much.<br />
Nuclear power’s low cost is low and stable over the entire<br />
period of concern.<br />
What policy decisions do these suggest? First, there is a significant<br />
cost to California customers from our CO2 policy<br />
leadership. Because we have shut off the cheapest and cleanest<br />
baseload resources, namely hydro and nuclear, we will have a<br />
default natural gas only policy.<br />
Like Europe and China, we may need to change to compete in<br />
the long term.<br />
IGCC = Integrated Gasification Combined Cycle<br />
NGCC = Natural Gas Combined Cycle<br />
PC = Pulverized Coal<br />
Capture = Carbon Dioxide sequestration<br />
Levelized Cost of Electricity, $/MWh<br />
100<br />
90<br />
80<br />
70<br />
60<br />
50<br />
40<br />
30<br />
0 10 20 30 40 50<br />
Cost of CO 2<br />
, $/metric ton<br />
Policy and Technology Needs and Breakthroughs<br />
First some good news. There are some bona-fide technological<br />
revolutions coming that will bring breakthrough efficiency<br />
and customer control of the cost challenges. We will highlight<br />
just two, LEDs and vanadium batteries.<br />
Light Emitting Diodes(LED’s)<br />
In ten years your home may have lights that may not need to<br />
be changed in our lifetime (unless your toddler breaks it). It is<br />
the same glow from your cell phone and traffic lights.<br />
In an incandescent lamp, the heating causes the filament to<br />
glow. With an LED it’s the semiconductor material itself that<br />
emits light. In addition, the intensity of the light can be<br />
changed, along with the color, unlike traditional lights that<br />
after installed are always the same.<br />
LEDs have a 50 to100 times longer lifetime than incandescent<br />
lamps and save 90 percent in energy costs. LED home lighting<br />
will be commercially available in the next three to four years.<br />
Lighting is presently responsible for roughly 20 percent of<br />
electricity consumption. Researchers believe that the adoption<br />
of LEDs could reduce the U.S. electrical demand by 10 percent.<br />
New Storage Technologies<br />
A sophisticated <strong>Silicon</strong> <strong>Valley</strong> energy manager recently said,<br />
“If I had access to vanadium battery technology three years<br />
ago, I would have installed them instead of my cogeneration<br />
plant.<br />
The concept is simple. Put the facility on Time-of-use pricing.<br />
Charge the batteries during the night when power is very<br />
cheap (often less than 2 cents/kWh). Expend the batteries during<br />
the daytime when prices exceed 10 cents. What is the<br />
breakthrough? An expanded source of electrolyte solution to<br />
keep the battery working all day. (Insert schematic). This<br />
holds the potential to make wind a more meaningful source.<br />
For customers, it can cut costs many fold and eliminate timeintensive<br />
operations and maintenance as well as natural gas<br />
procurement.<br />
A comparison of promising new storage technologies is presented<br />
below highlighting their advantages and disadvantages.<br />
NGCC @ $6 Wind @ 29% CF PC w/o capture IGCC w/o capture Biomass Nuclear<br />
©2005 Electric Power Research Institute, Inc. All rights reserved.<br />
40
Energy<br />
Tough Decisions in the Next Few Years<br />
California will do well for electric capacity in the coming few<br />
years. But new carbon taxes on fossil fuel plants and the high<br />
cost of dependence on renewables threaten to drive California<br />
costs up even further, making it even harder to compete with<br />
other high tech regions. (See Figure below)<br />
Electricity Cost Comparisons Between U.S. Regions<br />
This year, California’s residential, commercial, and industrial<br />
electricity costs are already the third highest among the<br />
10 regions compared. Most troubling is that California’s residential<br />
and industrial rates have jumped over 10% compared<br />
to last year. New statewide policies in procurement may exacerbate<br />
this trend. However, new customer risk management<br />
strategies and emerging efficiency and demand response<br />
choices will also mitigate this effect.<br />
PG&E Diablo Canyon<br />
Vanadium Redox Battery<br />
Multi Function VRB–3.000kW, 1.5sec. for UPS and 1.500kW, 1h for load leveling<br />
Photo courtesy of Sumitomo Electric Industries, Ltd. (SEI)–Copyright2001<br />
41
Energy<br />
Nuclear Power’s Resurgence Beyond California<br />
Average Retail Price of Electricity to Ultimate Customers by<br />
End-Use State Year-to-Date through February 2006 and 2005<br />
Residential Residential Commercial Commercial Industrial Industrial<br />
Location 2006 2005 2006 2005 2006 2005<br />
California<br />
Colorado<br />
District of Columbia<br />
Illinois<br />
Massachusetts<br />
North Carolina<br />
New Jersey<br />
New York<br />
Oregon<br />
Washington<br />
U.S. Total<br />
12.98<br />
9.10<br />
8.55<br />
7.77<br />
17.88<br />
8.82<br />
11.31<br />
16.45<br />
7.43<br />
6.69<br />
9.67<br />
11.75<br />
8.68<br />
7.81<br />
7.51<br />
12.97<br />
8.30<br />
10.53<br />
14.27<br />
7.20<br />
6.44<br />
8.60<br />
11.32<br />
7.63<br />
9.28<br />
7.40<br />
16.69<br />
7.13<br />
10.18<br />
12.83<br />
6.90<br />
6.53<br />
8.95<br />
10.94<br />
7.13<br />
7.90<br />
7.43<br />
11.92<br />
6.80<br />
9.25<br />
11.58<br />
6.79<br />
6.28<br />
8.09<br />
8.39<br />
5.98<br />
2.53<br />
4.40<br />
11.18<br />
5.10<br />
8.64<br />
8.32<br />
4.35<br />
4.00<br />
5.76<br />
7.92<br />
5.32<br />
2.66<br />
4.43<br />
8.71<br />
4.78<br />
7.61<br />
6.31<br />
4.17<br />
4.05<br />
5.07<br />
Best Practices - Lessons Learned<br />
The Pennsylvania/New Jersey/Maryland grid<br />
operator has created a deep and effective market<br />
for demand response, perhaps the best in the<br />
country. The reasons? First, fewer customers are<br />
made immune from the real cost of power<br />
because of time-of-use rates. Second, aggregators<br />
have direct access to demand response incentive<br />
money.<br />
42
Housing
Housing<br />
<strong>Projections</strong><br />
Conventional indicators and statistics still show that housing<br />
affordability and availability in <strong>Silicon</strong> <strong>Valley</strong> remains a challenge.<br />
Median home prices are high at $746,800 and we have<br />
managed to be successful in retaining our status as one of the<br />
least affordable places to live, according to the National<br />
Association of Homebuilders Housing Opportunity Index.<br />
The Housing Opportunity Index shows that only 14.9% of<br />
homes are affordable to families and individuals earning the<br />
median income. This puts <strong>Silicon</strong> <strong>Valley</strong> in second place<br />
behind New York at 6% with Boston in third at 24%.<br />
The most affordable high tech region is Raleigh-Carey, North<br />
Carolina at 65.8%.<br />
2006 Q1, Housing Opportunity Index (%)<br />
San Jose, CA . . . . . . . . . . . . . . . . . . . . . . . . . . . . . .14.90%<br />
Austin, TX . . . . . . . . . . . . . . . . . . . . . . . . . . . . . . . .58.30%<br />
Boston, MA . . . . . . . . . . . . . . . . . . . . . . . . . . . . . . .24.80%<br />
Chicago, IL . . . . . . . . . . . . . . . . . . . . . . . . . . . . . . .51.30%<br />
Denver, CO . . . . . . . . . . . . . . . . . . . . . . . . . . . . . . .62.40%<br />
New Jersey/Philadelphia* . . . . . . . . . . . . . . . . . . . . .56.40%<br />
New York, NY . . . . . . . . . . . . . . . . . . . . . . . . . . . . . .6.10%<br />
Portland, OR . . . . . . . . . . . . . . . . . . . . . . . . . . . . . .42.50%<br />
Raleigh-Cary, NC . . . . . . . . . . . . . . . . . . . . . . . . . . .65.80%<br />
San Diego, CA . . . . . . . . . . . . . . . . . . . . . . . . . . . . . .5.20%<br />
Seattle, WA . . . . . . . . . . . . . . . . . . . . . . . . . . . . . . .32.60%<br />
Washington, DC . . . . . . . . . . . . . . . . . . . . . . . . . . .23.60%<br />
Source: National Association of Home Builders, www.nahb.org<br />
Residential property appreciation rates over a short period<br />
of time show a more pleasant picture. Our region sits in the<br />
middle of the pack with housing prices appreciating 25.9%<br />
between 2003 and 2006. The lowest rate of appreciation was<br />
at 6.7% in Austin, Texas and the highest was in Washington,<br />
DC at 52%.<br />
Focusing on <strong>Silicon</strong> <strong>Valley</strong>, recent data collected by the<br />
Association of Bay Area Governments (ABAG) offers some<br />
insight into why prices continue to escalate. In their recently<br />
released report called “A Place to Call Home” ABAG measures<br />
how well cities are doing in achieving the housing goals<br />
set for the 1999-<strong>2007</strong> housing element cycle. For the ninecounty<br />
Bay Area, ABAG found that 80% of the homes<br />
needed were permitted. For Santa Clara County and San Mateo<br />
County, the figure is 75% and 58% respectively. Digging a<br />
little deeper into these numbers shows that cities excel in permitting<br />
homes for the above moderate range. Only 19% of the<br />
2005 4th Quarter, Average Monthly Rental Rate<br />
<strong>Silicon</strong> <strong>Valley</strong>, CA (San Jose) . . . . . . . . . . . . . . . . . . .$1,330<br />
Austin, TX . . . . . . . . . . . . . . . . . . . . . . . . . . . . . . . . . .$733<br />
Boston, MA . . . . . . . . . . . . . . . . . . . . . . . . . . . . . . . .$1,216<br />
Chicago, IL . . . . . . . . . . . . . . . . . . . . . . . . . . . . . . . .$1,003<br />
Denver, CO . . . . . . . . . . . . . . . . . . . . . . . . . . . . . . . . .$761<br />
New York, NY . . . . . . . . . . . . . . . . . . . . . . . . . . . . . .$2,400<br />
Portland, OR . . . . . . . . . . . . . . . . . . . . . . . . . . . . . . . .$698<br />
Raleigh-Durham, NC . . . . . . . . . . . . . . . . . . . . . . . . . .$728<br />
San Diego, CA . . . . . . . . . . . . . . . . . . . . . . . . . . . . .$1,213<br />
Seattle, WA . . . . . . . . . . . . . . . . . . . . . . . . . . . . . . . . .$859<br />
New Jersey/Philadelphia . . . . . . . . . . . . . . . . . . . . . .$1,046<br />
Washington, DC . . . . . . . . . . . . . . . . . . . . . . . . . . . .$1,160<br />
Source: M/PF YieldStar for all cities but New York;<br />
NYC data from Reis Client Services<br />
MSN Real Estate article,<br />
http://realestate.msn.com/Rentals/Article.aspx?cp-documentid=262175<br />
homes needed in San Mateo County for very low-income<br />
families was met. Santa Clara County, a county who’s numbers<br />
are significantly bolstered by the leadership of San Jose,<br />
permitted 55% of the very low income homes needed. The<br />
regional average was 34%. These numbers show that <strong>Silicon</strong><br />
<strong>Valley</strong> is falling short in meeting the overall need for homes.<br />
They also show that we are doing particularly poorly in<br />
permitting homes for those most in need.<br />
Residential Property Annual Appreciation Rates<br />
Region/Metro Area 2003- 2004- 2005- 2003-<br />
2004 2005 2006 2006<br />
<strong>Silicon</strong> <strong>Valley</strong>, CA* . . . . . . .17.80% . . . .6.60% . . . .1.40% . . .25.90%<br />
Austin, TX . . . . . . . . . . . . .-1.30% . . . .5.90% . . . .8.50% . . . .6.70%<br />
Boston, MA . . . . . . . . . . . . .8.70% . . . .6.00% . . .-1.50% . . . .8.90%<br />
Chicago, IL . . . . . . . . . . . . .9.00% . . .10.00% . . .11.00% . . .19.70%<br />
Denver, CO . . . . . . . . . . . . .0.40% . . . .3.30% . . . .3.50% . . . .2.50%<br />
New Jersey/Philadelphia . . .10.00% . . .13.60% . . .16.00% . . .26.80%<br />
New York, NY* . . . . . . . . .12.30% . . .15.40% . . .11.20% . . .33.50%<br />
Portland, OR . . . . . . . . . . . .9.30% . . .18.60% . . .21.80% . . .41.70%<br />
Raleigh-Cary, NC . . . . . . . . .4.90% . . .14.70% . . . .3.60% . . .23.20%<br />
San Diego, CA . . . . . . . . . .29.80% . . . .9.60% . . . .4.00% . . .42.90%<br />
Seattle, WA . . . . . . . . . . . .19.00% . . .11.30% . . .16.40% . . .41.60%<br />
Washington, DC . . . . . . . .22.30% . . .25.30% . . .11.00% . . .52.00%<br />
Source: National Association of Realtors, Deloitte Consulting LLP<br />
44
Housing<br />
The Biggest Barriers to Success…<br />
There are many barriers to building more homes but there are<br />
a few that are most significant, namely, how local governments<br />
are financed.<br />
In every decision that we as individuals make, cost is usually<br />
a factor. The same goes for cities. When considering a land use<br />
permit, an important question the city must ask itself is what<br />
kind of financial impact the future development’s needs will<br />
have upon the city. Demands on city services, schools and<br />
infrastructure, all of which must be maintained at some cost,<br />
are associated with housing construction and to a lesser extent,<br />
office parks or big box retail. As a result, fiscal considerations<br />
have become a major barrier to building homes. These considerations<br />
were made more acute five years ago when the State<br />
government decided to balance its budget, in part, by taking<br />
local government money.<br />
Percent of Regional Housing Needs Allocation<br />
(RHNA) Permitted<br />
County Very Low Low Moderately Total<br />
Income Income Low Income<br />
Alameda . . . . . . . . . .24% . . . . . . .38%. . . . . . . . . 20% . . . . . . .65%<br />
San Mateo . . . . . . . . .19% . . . . . . .45%. . . . . . . . . 16% . . . . . . .58%<br />
Santa Clara . . . . . . . .55% . . . . . . .98%. . . . . . . . . 17% . . . . . . .75%<br />
Regional Total . . . . . .34% . . . . . . .70%. . . . . . . . . 29% . . . . . . .80%<br />
(9-County region)<br />
Source: Association of Bay Area Governments<br />
Proposition 1A was passed in 2004 to protect local governments<br />
against future State “raids” and to provide local governments<br />
with much-needed financial certainty from year to year.<br />
Housing advocates also hoped this certainty would lead to more<br />
favorable outcomes when considering housing permits.<br />
However, the allegation that housing doesn’t pay for itself still<br />
persists. Residents wary of a decline in city services and quality<br />
of life continue to express concern over new home construction,<br />
especially if those homes don't mirror the ones they live in.<br />
This is a problem that is difficult to solve. Cities are<br />
entrenched in the way local governments are financed and any<br />
talk of change makes them very uncomfortable. For example,<br />
cities such as Gilroy have worked hard to grow their revenue<br />
base through outlet stores. Any changes to how local governments<br />
are financed would need to respect those decisions.<br />
It is unrealistic to expect substantial change to how local<br />
governments are financed. However, there are ways that we<br />
can provide a work-around solution. Very simply, cities and<br />
counties should be rewarded for good land use planning and<br />
the resulting housing production.<br />
Programs such as the Metropolitan Transportation<br />
Commission’s Transportation for Livable Communities are an<br />
excellent example of a way to reward cities. The program<br />
awards grant funds to cities that meet certain housing production<br />
requirements at specific densities near transit. So far,<br />
23 housing developments have been awarded $7 million to<br />
create nearly 2,700 new housing opportunities throughout the<br />
Bay Area. MTC expects to provide up to $30 million to qualifying<br />
projects in the upcoming round of grants. This success<br />
should be expanded locally, regionally and statewide.<br />
Another huge challenge in meeting the need for more homes<br />
is community opposition. Rarely does a community open up<br />
its arms to welcome a developer. Instead, developers are seen<br />
as people who wish to bring unwanted change to a neighborhood,<br />
change residents fear will decrease the quality of<br />
schools, increase traffic congestion, and add demands for existing<br />
city services such as parks and libraries.<br />
The end result of systematic community opposition can be<br />
found in reduced densities, heights and the overall number of<br />
homes being built. Council by council, project by project, our<br />
ability to meet the demand for homes with the limited land<br />
available is whittled away through a reduction in the number<br />
of homes ultimately approved for construction.<br />
A good illustration of this is the Hyatt Rickeys site in Palo<br />
Alto. The applicant originally sought 304 homes. The<br />
surrounding community did not like the proposal for a number<br />
of reasons and at the end of the day, a significantly scaled<br />
back version was approved by the council for 181 homes. In<br />
essence, the opportunity to house 123 additional families on<br />
that site was lost.<br />
This story is played out all across the State every week as cities<br />
approve developments that squander housing opportunities.<br />
Couple this with recent research out of UC Berkeley on infill<br />
capacity statewide and the problem is magnified. The study<br />
projects that 25% of the need for more homes can be accommodated<br />
through infill, meaning 75% will be sprawl, leading<br />
to the consumption of valuable open space, farmland and<br />
requiring heavy taxpayer investments in new infrastructure to<br />
serve sprawling communities.<br />
To make matters worse, there has been an increase locally of<br />
citizen backed measures to control or stop growth. Last year,<br />
three initiatives in Cupertino that would have made it infeasible<br />
to build condominiums and publicly funded affordable<br />
homes qualified for the ballot. All three were defeated but the<br />
this year some Cupertino residents qualified two more initiatives<br />
to rescind the approval of two condominium proposals<br />
near Vallco shopping center. In 2003, Palo Alto citizens tried<br />
45
Housing<br />
unsuccessfully to referend a city council-approved proposal<br />
and in Redwood City, citizens overturned city council<br />
approval of a cutting edge development for high rise residential<br />
towers on the Bay. Sunnyvale citizens and San Carlos<br />
residents have also tried to qualify measures but were narrowly<br />
unsuccessful in meeting the letter of the law needed to place<br />
them on the ballot.<br />
Not all is gloom and doom. In downtown San Jose, leadership<br />
has been taken by the council to kickstart highrise home production.<br />
The end result is that 7 highrises are currently under<br />
construction or are actively seeking a development permit<br />
from planning totalling 1,747 new downtown residences. Five<br />
more highrise projects are in the early stage for planning proving<br />
that innovative policies can really help move the market<br />
and help us reach our housing goals. This also shows that the<br />
efforts San Jose has made in working with community members<br />
have paid off.<br />
The bottom line is that sincere community concerns must be<br />
addressed and done so in a way that builds trust between<br />
developers, neighborhoods and local government. Time and<br />
resources must be spent in ensuring the neighborhoods are<br />
brought into the planning process and money is made available<br />
to address the legitimate neighborhood issues.<br />
Looking Forward….<br />
Last year, this report described the need for upfront planning<br />
but the monetary resources did not materialize. This year, we<br />
have a very real opportunity to put our money where our<br />
mouth is. Proposition 1C, the affordable housing bond has<br />
more than $1 billion set aside for unspecified transit-oriented<br />
development programs and better planning. This money will<br />
require additional legislation to determine how it is spent and<br />
should be seen as an opportunity to create a statewide incentive<br />
program for cities to build more homes.<br />
The last major challenge to building more affordable homes<br />
is the availability of funding. Proposition 46 resulted in an<br />
influx of money to build affordable homes but that money has<br />
been spent. Fortunately, Proposition 1C on the ballot in<br />
November would provide $2.85 billion for affordable housing.<br />
Although not all the money goes directly to affordable<br />
homes, it is hoped that the passage of this bond will help<br />
create the bridge needed until housing advocates, statewide,<br />
are able to bring about a permanent source of funding for<br />
affordable housing.<br />
Much rests on the passage of Proposition 1C. It promises to<br />
address several of the challenges to meeting the need for more<br />
homes, homes that ensure the well being of families and individuals<br />
who make our economy strong.<br />
Best Practices - Lessons Learned<br />
Arlington County, Virginia-between Fairfax County<br />
and the District of Columbia-is nationally recognized<br />
for effectively concentrating dense, mixed-use infill<br />
development around five Metro stations known as<br />
Rosslyn-Ballston Corridor. As of 2004, the roughly<br />
two-square-mile corridor included more than 21<br />
million square feet of office, retail, and commercial<br />
space; more than 3,000 hotel rooms; and nearly 25,000<br />
homes. The plan for each station focuses growth within<br />
a walkable radius of the stations and preserves established<br />
neighborhoods and natural areas. Arlington's<br />
“urban villages” emphasize pedestrian access and safety,<br />
and include “pocket” parks, bike lanes, wide sidewalks<br />
with restaurant seating, street trees and street-level<br />
retail. At typical suburban densities, this development<br />
would consume more than 14 square miles. Incentive<br />
zoning attracts private-sector transit-oriented development.<br />
The corridor is so popular that preserving affordable<br />
housing was a challenge. In 2001, the county<br />
adopted a 25% density bonus to encourage the construction<br />
of more affordable homes. Metro ridership in<br />
the corridor doubled between 1991 and 2001; nearly 50<br />
percent of corridor residents commute by transit.<br />
The median income information for 2006<br />
Family Size 1 2 3 4<br />
Extremely Low Income 22,300 25,500 28,650 31,850<br />
Very Low Income 37,150 42,450 47,750 53,050<br />
Low Income 59,400 67,900 76,400 85,900<br />
Median Income 73,900 84,400 95,000 105,500<br />
(9-County region)<br />
Source: Association of Bay Area Governments<br />
46
Tax Policy
Tax Policy<br />
A state’s ability to attract business, retain commerce, and continue<br />
innovation and economic growth depends on the soundness,<br />
stability and quality of a locality’s tax policy. Frequently,<br />
California’s tax system seems disorganized, because it is. Our<br />
state’s tax policy is a patchwork of political compromises<br />
largely borne out of the negative legacies and unintended consequences<br />
of previous policies which threaten our ability to<br />
create more Research & Development, more production, and<br />
added jobs.<br />
In California, Prop. 13 has provided a degree of certainty to<br />
property owners as to the levels of their property taxes. Yet,<br />
Prop. 98 established a minimum funding guarantee to local<br />
schools, which are distributed from the Prop. 13 pool. Despite<br />
certain protections to taxpayers afforded under both propositions,<br />
with every rule, there seems to be an exception. In<br />
recent years, the exception to such protections has been clear.<br />
Whenever a state budget shortfall occurs, infrastructure funds<br />
are raided by the state. If the state exercises its authority to<br />
take funding back from schools, cities and counties to cover<br />
deficits, taxpayers only suffer, sending the state more deeply<br />
into infrastructure and fiscal jeopardy. Rather than creating a<br />
flexible tax system that provides a steady stream of reliable<br />
funding for state and local government services, the state<br />
seems to patiently await a successful private-sector boom and<br />
the resulting tax receipts.<br />
Unfortunately, the state legislature has responded to this series<br />
of events by rejecting most policy proposals that aim to<br />
encourage hi-tech and bio-tech job stimulus with the rationale<br />
that “any economic stimulus proposal is too costly due to<br />
the state’s budget shortfall.”<br />
California’s Unintended Consequences:<br />
• Long-term investments are not made by the state in areas<br />
such as enhancing R&D incentives, eliminating the double<br />
taxation on equipment purchases, and the playing field<br />
isn’t level with how tax formulas calculate businesses tax<br />
liability.<br />
• Layers upon layers of parochial tax policy have resulted,<br />
leaving the business taxpayer with an unavoidable decision<br />
with where to locate their operations—growth is more<br />
frequently occurring in other states and countries.<br />
• State, County, and City governments rely on the ballot<br />
process for revenue generating measures (e.g. property tax<br />
levies, parcel taxes, benefit assessments, and sales tax measures)<br />
to fund infrastructure projects.<br />
• Voters distrust government at all levels and their ability to<br />
manage taxpayer provided revenue unless they are able to<br />
oversee and have accountability for their investment.<br />
• Legislators doubt that business taxpayers will actually<br />
grow their facilities and jobs in California if incentives are<br />
approved, and some also believe businesses will expand in<br />
any event.<br />
California Compared<br />
California and <strong>Silicon</strong> <strong>Valley</strong> especially are fortunate to have<br />
highly skilled workers, beautiful surroundings, superior higher<br />
education institutions, and close proximity to supply<br />
chains. However, continuing convoluted tax policies will produce<br />
more headlines from other states and countries boasting<br />
of the opening of new facilities and added jobs. For example:<br />
• Arizona’s calculation of state income taxes for an Intel fabrication<br />
plant which includes 1,000 new jobs. Arizona’s<br />
recent adoption of an 80 percent sales factor formula;<br />
• AMD receiving $1 billion in incentives to open a chip factory<br />
in New York;<br />
• And, Michigan’s deal-specific tax incentive of $38 million<br />
over 20 years to Google.<br />
Due to the realities of global competition, employers are faced<br />
with the tough decision of operating in costly California or<br />
a state or country where tax policies provide lower costs of<br />
operation.<br />
Similar to other sections in this report, several key tax policy<br />
indicators can be comparatively measured with respect to<br />
California’s high-tech rivals in corporate property, sales and<br />
use, and income taxes. In this report, California’s property and<br />
sales tax rates and policies are compared with our competitors<br />
including the trends and realities of doing business in<br />
California through a tax policy lens. California’s taxes rank<br />
among the highest in three of four categories (sales tax, corporate<br />
income tax, and personal income tax).<br />
With respect to property taxes, California continues to have<br />
rates ranking among the highest. The property tax rates in<br />
California fluctuate from county to county and even at times<br />
from city to city and school district to school district, depending<br />
on parcel tax measures and special district levies.<br />
Generally, <strong>Silicon</strong> <strong>Valley</strong>’s property tax rate is higher than the<br />
state average of 1.08%, with 1.25% for Santa Clara County,<br />
1.20% for San Mateo County, and 1.31% for Alameda County.<br />
48
Tax Policy<br />
Compare this with San Diego’s high-tech area where the propit’s<br />
worth noting that while overall property tax rates in<br />
erty tax rate is only 1.11%—closer to the state average. Also,<br />
California seem modest, California has much higher property<br />
values than most other competitive areas. In fact, a 2003<br />
report from the US Census Bureau showed California as the<br />
state with the second highest property values in the nation,<br />
behind only Hawaii, a place where land is genuinely scarce.<br />
Tax Rates<br />
Sales Income Property<br />
California . . . . . . . . . . .6.25% . . . . . . . .8.84% . . . . . . . . .1.12%<br />
Tax Cost . . . . . . . . .$6,250,000 . . . .$8,840,000 . . . . .$1,120,000<br />
First Year Total . . . . . . . . . . . . . . . . . . . . . . . . . . . . . . .$16,210,000<br />
Massachusetts . . . . . . . .5.00% . . . . . . . .9.50% . . . . . . . . .1.33%<br />
Tax Cost . . . . . . . . .$5,000,000 . . . .$9,500,000 . . . . .$1,330,000<br />
First Year Total . . . . . . . . . . . . . . . . . . . . . . . . . . . . . . .$15,830,000<br />
Illinois . . . . . . . . . . . . . .6.25% . . . . . . . .7.30% . . . . . . . . .1.51%<br />
Tax Cost . . . . . . . . .$6,250,000 . . . .$7,300,000 . . . . .$1,510,000<br />
First Year Total . . . . . . . . . . . . . . . . . . . . . . . . . . . . . . .$15,060,000<br />
New Jersey . . . . . . . . .6.00% . . . . . . . .9.00% . . . . . . . . .0.00%<br />
Tax Cost . . . . . . . . .$6,000,000 . . . .$9,000,000 . . . . . . . . . . . . .-<br />
First Year Total . . . . . . . . . . . . . . . . . . . . . . . . . . . . . . .$15,000,000<br />
Virginia . . . . . . . . . . . .7.00% . . . . . . . .6.00% . . . . . . . . .1.11%<br />
Tax Cost . . . . . . . . .$7,000,000 . . . .$6,000,000 . . . . .$1,110,000<br />
First Year Total . . . . . . . . . . . . . . . . . . . . . . . . . . . . . . .$14,110,000<br />
Texas . . . . . . . . . . . . . .6.25% . . . . . . . .4.50% . . . . . . . . .2.62%<br />
Tax Cost . . . . . . . . .$6,250,000 . . . .$4,500,000 . . . . .$2,620,000<br />
First Year Total . . . . . . . . . . . . . . . . . . . . . . . . . . . . . . .$13,370,000<br />
New York . . . . . . . . . . .4.25% . . . . . . . .7.50% . . . . . . . . .1.53%<br />
Tax Cost . . . . . . . . .$4,250,000 . . . .$7,500,000 . . . . .$1,530,000<br />
First Year Total . . . . . . . . . . . . . . . . . . . . . . . . . . . . . . .$13,280,000<br />
North Carolina . . . . . . .4.50% . . . . . . . .6.90% . . . . . . . . .1.10%<br />
Tax Cost . . . . . . . . .$4,500,000 . . . .$6,900,000 . . . . .$1,100,000<br />
First Year Total . . . . . . . . . . . . . . . . . . . . . . . . . . . . . . .$12,500,000<br />
Colorado . . . . . . . . . . .2.90% . . . . . . . .4.63% . . . . . . . . .0.82%<br />
Tax Cost . . . . . . . . .$2,900,000 . . . .$4,630,000 . . . . . . .$820,000<br />
First Year Total . . . . . . . . . . . . . . . . . . . . . . . . . . . . . . . . .8,350,000<br />
Oregon . . . . . . . . . . . . .0.00% . . . . . . . .6.60% . . . . . . . . .1.48%<br />
Tax Cost . . . . . . . . . . . . . . . . .- . . . .$6,600,000 . . . . .$1,480,000<br />
First Year Total . . . . . . . . . . . . . . . . . . . . . . . . . . . . . . . .$8,080,000<br />
Washington . . . . . . . . .6.50% . . . . . . . .0.00% . . . . . . . . .1.29%<br />
Tax Cost . . . . . . . . .$6,500,000 . . . . . . . . . . . . .- . . . . .$1,290,000<br />
First Year Total . . . . . . . . . . . . . . . . . . . . . . . . . . . . . . . .$7,790,000<br />
ASSUMPTION: A company investing $100M in equipment used in<br />
manufacturing or R&D, with $100M of net income and $100M of<br />
property in the state it operates in.<br />
Best Practices - Lessons Learned<br />
News story after story show compelling examples of<br />
why companies choose to grow jobs and expand<br />
operations in states other than California. What do<br />
they have that we haven’t? In Arizona, companies are<br />
being drawn to the state by tax breaks creating 1,000<br />
direct jobs and thousands of indirect supporting<br />
industry<br />
Hold<br />
jobs.<br />
for Draft<br />
Arizona's<br />
<strong>Projections</strong><br />
recent adoption<br />
<strong>2007</strong><br />
of an 80<br />
percent sales factor formula, which stops short of<br />
considering only a company's sales tax calculations, has<br />
created a more positive environment for investment in<br />
the state. Most states give equal weight to three<br />
factors — the share of a company's total nationwide<br />
investments: payroll, property, and sales that occur in<br />
that particular state—<br />
when deciding tax burden. But<br />
under the sales factor formula, they would consider a<br />
higher fraction of the company's sales within the state.<br />
In the Arizona example, “about 70% of a chip plant’s<br />
cost is the equipment that goes into it, not the labor . .<br />
.a tax break can help mitigate that cost . . .[in this case]<br />
a huge boost from a new Arizona law that allows<br />
companies to cut income taxes if they spend at least $1<br />
billion in capital investments” (USA Today, 2005).<br />
Regarding sales and use taxes, it must be noted that CA’s lack<br />
of an exemption for productive business assets, which is prevalent<br />
in virtually every other state, makes California’s sales tax<br />
burden comparatively higher.<br />
A state or region’s tax rates may seem byzantine, but tax rates<br />
can provide companies’ insight into the costs of doing business<br />
in, and the potential competitive advantages of relocating<br />
to, certain regions. Especially when considering “greenfield”<br />
or new developments, the tax rates and especially the tax<br />
incentives that local economies provide can make or break site<br />
location decisions.<br />
To remain competitive, California, and municipalities in<br />
<strong>Silicon</strong> <strong>Valley</strong>, must embrace pro-growth tax policies and<br />
attempt to avoid the unintended consequences of the past.<br />
This chart illustrates where California stacks up relative to our<br />
competition throughout the country in terms of tax policies to<br />
promote new business and spur expansion.<br />
From an international perspective, corporate rates vary greatly,<br />
but the U.S. ties France for the fourth highest corporate tax<br />
rate out of the nations compared below. Although the countries<br />
of France, Germany, India are equal to or higher than the<br />
U.S., these countries have been successful in wooing U.S.<br />
manufacturing operations due to offsetting tax incentives and<br />
business friendly environments in those countries.<br />
49
Tax Policy<br />
Suggested Solutions/Conclusion<br />
How can we strengthen our economic competitiveness, retain,<br />
and grow facilities and jobs? California should continue to be<br />
fiscally responsible, but also lower where possible overall tax<br />
burdens and proactively address employers’ retention, expansion,<br />
and growth needs (without unduly jeopardizing local<br />
goods and services). Also, the following steps should receive<br />
immediate attention:<br />
• Eliminate double taxation by implementing a full sales tax<br />
exemption for manufacturing equipment purchases;<br />
Country<br />
Corporate Tax Rate<br />
India. . . . . . . . . . . . . . . . . . . . . . . . . . . . . . . . 42%<br />
Japan . . . . . . . . . . . . . . . . . . . . . . . . . . . . . . . 41%<br />
Germany . . . . . . . . . . . . . . . . . . . . . . . . . . . . 40%<br />
France . . . . . . . . . . . . . . . . . . . . . . . . . . . . . . 35%<br />
United States . . . . . . . . . . . . . . . . . . . . . . . . . 35%<br />
China . . . . . . . . . . . . . . . . . . . . . . . . . . . . . . . 33%<br />
United Kingdom. . . . . . . . . . . . . . . . . . . . . . . 30%<br />
Sweden . . . . . . . . . . . . . . . . . . . . . . . . . . . . . 28%<br />
Czech Republic. . . . . . . . . . . . . . . . . . . . . . . . 24%<br />
Russia. . . . . . . . . . . . . . . . . . . . . . . . . . . . . . . 24%<br />
Singapore. . . . . . . . . . . . . . . . . . . . . . . . . . . . 20%<br />
Switzerland . . . . . . . . . . . . . . . . . . . . . . . . . . 16%<br />
Ireland . . . . . . . . . . . . . . . . . . . . . . . . . . . . . . 13%<br />
Puerto Rico. . . . . . . . . . . . . . . . . . . . . . . . . . . . 7%<br />
publicly funded program in health or human service—<br />
such factors should take into account the experience of<br />
companies utilizing the tax provision and also the secondary<br />
and tertiary businesses supporting such companies,<br />
such as a supplier, construction firms, transportation company,<br />
etc.).<br />
• Avoid disproportionate tax policies which unfairly place<br />
burdens on employers and act as a disincentive that hinder<br />
growth (for example, split roll property taxation is a separate<br />
assessment value for business versus residential property<br />
owners);<br />
• Create simplicity and predictability in the tax system<br />
• Enable and encourage online filing of assessments and<br />
assessment appeals<br />
• Update depreciation/valuation tables for business property<br />
• Allow ex parte communication with the Board of<br />
Equalization and the Franchise Tax Board and at all agency<br />
levels of the state<br />
Tax Rate by State<br />
Source: Deloitte Consulting LLP<br />
• Provide a more level playing field with other states by<br />
adopting a more heavily weighted if not solely a sales<br />
apportionment formula;<br />
• Support state R&D tax policy enhancements (and also<br />
encourage enhancement and making the federal R&D permanent);<br />
• Employ “dynamic” rather than “static” economic modeling<br />
when evaluating the anticipated revenue consequences of<br />
proposed tax policy programs to more realistically gauge<br />
the fiscal impacts and benefits to California’s economy and<br />
competitiveness. This means not just looking at the forgone<br />
tax revenues relating to the incentive for budgetary<br />
purposes, but also looking at the return on investment<br />
through new jobs created or retained (e.g., personal income<br />
taxes, sales tax from increased consumption, employment<br />
of targeted populations currently relying on some form of<br />
Source: Deloitte Consulting LLP<br />
50
Tax Policy<br />
Location Business Tax Policy Incentives 2006<br />
State Sales<br />
Tax<br />
Single Sales or Hyperweighted<br />
Sales<br />
apportionment<br />
State Sales Tax<br />
Exemption<br />
Research<br />
Credit<br />
Investment<br />
Credit<br />
Source: CCH, Multistate Charts, 680-200 and U.S. Master Sales and Use Tax Guide, 116 (For more detailed information, see: http://www.cch.com/default.asp); Single Sales Apportionment (SSF)/hyper-weighted Sales apportionment compiled by<br />
FTA from various sources, 2006; Note: The formulas listed are for general manufacturing businesses. Some industries have special formula different than those reported.<br />
51
Acknowledgements<br />
Sponsors<br />
Title Sponsors<br />
Wells Fargo<br />
Robert Half International, Inc.<br />
Deloitte Consulting<br />
Host Sponsors<br />
Santa Clara University<br />
Co-Sponsors<br />
AT&T<br />
Applied Materials<br />
Empire Broadcasing<br />
NBC 11<br />
San Jose/<strong>Silicon</strong> <strong>Valley</strong> Business Journal<br />
Stanford Hospital & Clinics<br />
Synopsys<br />
Contributors<br />
Mark Klender, Deloitte Consulting<br />
Matt Szuhaj, Deloitte Consulting<br />
Tina Lee, Deloitte Consulting<br />
Carl Guardino, President & CEO, SVLG<br />
Kristina Scott, Acting Director, Communications<br />
Nicholas Ortiz, Associate Director, Communications<br />
Melinda Jenkins, Coordinator, Communications<br />
Kara LaPierre, Director, Economic Vitality<br />
Thomas Pham, Coordinator, Economic Vitality<br />
Dennis Cima, Director, Education & Workforce Preparedness<br />
Eric Berglund, Coordinator, Education & Workforce Preparedness<br />
Alina Din, Coordinator, Education & Workforce Preparedness<br />
Andrea Bruce, Student Researcher/Volunteer, Education & Workforce Preparedness<br />
Justin Bradley, Director, Energy Programs<br />
Margaret Bruce, Director, Environmental Programs<br />
Frank Teng, Associate Director, Energy & Environmental Programs<br />
Marina Wiant, Coordinator, Energy Programs<br />
David Baker, Coordinator, Environmental Programs<br />
Shiloh Ballard, Director, Housing & Community Development<br />
Bena Chang, Associate, Housing & Transportation Policy<br />
Alex Chen, Coordinator, Housing<br />
Kirk Everett, Director, Tax Policy<br />
Laura Stuchinsky, Director, Transportation & Land Use<br />
Evan Grey, Coordinator, Transportation<br />
Design By<br />
Kaleidoscope Design<br />
Barbara Lee,<br />
35 Ralph,s Way<br />
Hollister, CA 95023<br />
831.634.1234<br />
Printing By<br />
ImageX<br />
6150 Stoneridge Mall Rd., Ste. 200<br />
Pleasanton, CA 94588<br />
925.251.5600<br />
Selected Data and<br />
Images Courtesy of:<br />
Clean Tech Venture Network<br />
The California Energy Commission<br />
EPRI<br />
The Metropolitan Transportation<br />
Commission (MTC)<br />
Dr. Jeff Mount, UC Berkeley<br />
Pete Rincon, Philips Semiconductor
224 Airport Parkway, Suite 620<br />
San Jose, CA 95110<br />
(408) 501-7864<br />
www.svlg.net