Demand Response in Data Centers
Demand Response in Data Centers
Demand Response in Data Centers

You also want an ePaper? Increase the reach of your titles
YUMPU automatically turns print PDFs into web optimized ePapers that Google loves.
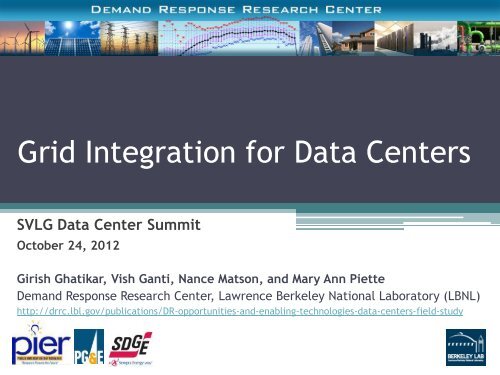
Grid Integration for <strong>Data</strong> <strong>Centers</strong>SVLG <strong>Data</strong> Center SummitOctober 24, 2012Girish Ghatikar, Vish Ganti, Nance Matson, and Mary Ann Piette<strong>Demand</strong> <strong>Response</strong> Research Center, Lawrence Berkeley National Laboratory (LBNL)http://drrc.lbl.gov/publications/DR-opportunities-and-enabl<strong>in</strong>g-technologies-data-centers-field-study
1Outl<strong>in</strong>e1. Problem Statement, Goals and Objectives2. Participat<strong>in</strong>g <strong>Data</strong> <strong>Centers</strong>3. Field Tests and Results4. Key Conclusions and Future Developments
2Problem Statement• Accord<strong>in</strong>g to a U.S. Environmental Protection Agency (EPA)forecast for 2011, 20% of U.S. data center energy use is <strong>in</strong>the Pacific region alone. In the Pacific Gas and ElectricCompany utility territory, data centers are estimated toconsume 500 megawatts of annual peak electricity.• Recent 2011 data show that the <strong>in</strong>crease <strong>in</strong> energy use isslightly lower than the EPA forecast.• The two key driv<strong>in</strong>g factors this study were:1. <strong>in</strong>creas<strong>in</strong>g data center energy use and cost, and2. impact of data center energy use dur<strong>in</strong>g peak periods and high prices
3Project Goals and ObjectivesImprove understand<strong>in</strong>g of demand response opportunities<strong>in</strong> data centers us<strong>in</strong>g field tests.Study is <strong>in</strong>tended to accelerate the applicability andadoption of <strong>Demand</strong> <strong>Response</strong> <strong>in</strong> data centers andrelate the f<strong>in</strong>d<strong>in</strong>gs to similar data centers.DRis <strong>Demand</strong> <strong>Response</strong>not Disaster Recovery
4<strong>Data</strong> <strong>Centers</strong> and <strong>Demand</strong> <strong>Response</strong> Strategies<strong>Demand</strong> <strong>Response</strong> Strategy*1 Server and CRAC units’ shutdown.2 Load Shift<strong>in</strong>g or Queu<strong>in</strong>g IT jobs – Server idl<strong>in</strong>g.3 Temperature set po<strong>in</strong>t adjustment.4 Shutdown and idl<strong>in</strong>g of IT storage clusters.5 Cool<strong>in</strong>g relative to IT equipment load reduction.6 Load migration between heterogeneous systems.7 Load migration between homogeneous systems.LBNLB-50NetAppSDSC, UCB,LBNL B-50IT = IT equipment; CRAC = Computer Room Air Conditioners*Note: Detailed sequence of operations for each of the strategies is described <strong>in</strong> the report.
5<strong>Demand</strong> Sav<strong>in</strong>gs at <strong>Data</strong> Center Level (kW & %)IT &SITELEGEND(a) LBNL 50B(b) NetApp(c) SDSC and UCB(d) SDSC and LBNL 50B
6Field Test Results | Correlation of CPU utilization and PowerUC Berkeley (Mako) – SDSC (Thresher) Load Migration StrategyDR Event: April 25, 2012 (12.30 pm to 5.10 pm)Migration
7Key Conclusions and Future Developments1. Similar data centers can provide DR with no impact to operations orservice-level agreements, set by the data center operators.2. A larger DR opportunity is with<strong>in</strong> the IT equipment, with larger sav<strong>in</strong>gswhen comb<strong>in</strong>ed with DR automation and <strong>in</strong>tegration with the cool<strong>in</strong>g.3. Load migration strategies are unique of data centers and can provideFast-DR (e.g., ancillary services, <strong>in</strong>termittency with renewables).Future Developments:Study represents a small data-set. Future developments must:1. Consider Semi- or Full- automation us<strong>in</strong>g enabl<strong>in</strong>g technologies toexecute and adm<strong>in</strong>ister resource-<strong>in</strong>tensive DR strategies.2. Evaluate end-uses and its feasibility and economics for DR programssuch as dynamic pric<strong>in</strong>g, ancillary services, renewable <strong>in</strong>tegration, etc.
8AcknowledgementsLBNL would like to thank the follow<strong>in</strong>g for support<strong>in</strong>g the study:1. The subcontractors, Megawatt Consult<strong>in</strong>g and SCG.2. LBNL and UC Berkeley data center team.3. <strong>Data</strong> <strong>Centers</strong>: NetApp, Inc., LBNL, UC Berkeley, and SDSC4. Enabl<strong>in</strong>g Technology providers: Power Assure, and SynapSense.Contact:Girish GhatikarGGhatikar@lbl.govhttp://drrc.lbl.gov/projects/dc
Back-Up Slides9
10Methodology & <strong>Data</strong> Center CharacterizationSite andTechnologySelectionFrameworkAssessment,Outreachand SiteRecruitmentDevelopCustomField TestPlansConductField Tests*Results andAnalysis**Note: Test plans and DR strategies were revised based on the results and f<strong>in</strong>d<strong>in</strong>gs from field.Characterization is used todevelop right set of DRstrategies for field tests,and applications to similardata centers.1. 2. 3. 4. <strong>Data</strong> Enabl<strong>in</strong>g End Load use Center Profile loads Technologies Analysis FunctionsSDSC= San Diego Supercomputer Center; UCB= University of California, Berkeley
11Summary of the <strong>Data</strong> Center SitesFloor area (and %relative to wholebuild<strong>in</strong>g)LBNL Bldg. 50 NetApp SDSC UC Berkeley5000 ft 2 (100%) 1100 ft 2 (37%) 19000 ft 2 (54%) 10000 ft 2 (22%)Function Storage & HPC Storage SystemsStorage Systems &HPCStorage Systems &HPCUtility territory WAPA Power PG&E SDG&E PG&E<strong>Demand</strong> 550 kW 816 kW 2.3 MW 1 MWIT equipmentaverage loadEnabl<strong>in</strong>gtechnologies(IT and site)350 kW 145 kW 1.6 MW 550 kWSynapSensePower Assure,Automated LogicControlPower Assure,Opto22, JohnsonControlsPulse Energy,Emerson ControlsSDSC= San Diego Supercomputer Center; UC= University of California; HPC= High Performance Comput<strong>in</strong>g;WAPA= Western Area Power Adm<strong>in</strong>istration; PG&E= Pacific Gas and Electric Company; SDG&E= San DiegoGas and Electric
12Summary of DR test results<strong>Data</strong>CenterNetAppLBNLB-50SDSC,UCB,andLBNLB-50DR StrategyEventDateActive EventPeriod<strong>Response</strong> Period (m<strong>in</strong>)5% shed 10% shedRecoveryPeriod(m<strong>in</strong>)Test 1 (Shift/Queue IT jobs – Storage) 19-Dec-11 2.30pm to 5pm 10 22 25Test 2 (Temperature set po<strong>in</strong>tadjustment)21-Dec-11 12.00pm to 1.00pm 5 15 15Test3 (Shift/Queue IT jobs – Storage w/manual temperature adjustment)13-Jan-12 2.00pm to 4.00pm 7 15 17Test 4 (Shift/Queue IT jobs – Storage) 11-Jan-12 1.00pm to 3.00pm 7 15 30Test 1 (Server and CRAC units shutdown) 28-Oct-11 8:00am to 5:00 pm 0 60 90Test 2 (Shift/Queue IT jobs – ServerMidnight to 6:001-Nov-11idl<strong>in</strong>g)amnot reached not reached n/aTest 3 (Temperature set po<strong>in</strong>t) 16-Nov-11 12:35 to Midnight not reached not reached n/aTest 4 (<strong>Data</strong> Center Shutdown)2-Dec-11 to 3:40 pm3-Dec-11 12:00 pm5 15 180Test 1 (Load migration - Homogenous –Idl<strong>in</strong>g)Test 2 (Load migration - Homogenous –Shutdown)Test 3 (Load migration - Heterogeneous– Decay)25-Apr-12 12.30pm to 2.45pm 2 6 225-Apr-12 2.46pm to 5.10pm 3 7 103-Jul-12to5-Jul-1210.45 am to11 am147 175 15
13<strong>Demand</strong> Sav<strong>in</strong>gs Analysis (An Example)NetApp Test-1: IT load shift<strong>in</strong>g with automatic response of site <strong>in</strong>frastructureDR Event: December 19, 2011 (2.30 pm to 5 pm)*Select IT equipment = 12%whole build<strong>in</strong>g loadNote: Standalone data center loads are not weather sensitive and the results must be similar <strong>in</strong> Summer.
14Field Test Results | example of load shed analysisNetApp Test 3 Analysis ( Queue IT jobs and manually adjust temperature set-po<strong>in</strong>ts<strong>Demand</strong>Sav<strong>in</strong>gs(kW and %)ITCool<strong>in</strong>gUnitsUPSTotal24(14.7%)23(14%)5( 3.1%)52.4(32%)Note: % at data centerlevelThe 23 kW demand sav<strong>in</strong>gs from cool<strong>in</strong>g equipment are dom<strong>in</strong>ated by chiller plant sav<strong>in</strong>gsDR Event: Jan 11, 2012 ( 2 pm to 4 pm)