Coastal vulnerability, resilience and adaptation to ... - OceanDocs
Coastal vulnerability, resilience and adaptation to ... - OceanDocs
Coastal vulnerability, resilience and adaptation to ... - OceanDocs

Create successful ePaper yourself
Turn your PDF publications into a flip-book with our unique Google optimized e-Paper software.
»<br />
»<br />
»<br />
»<br />
»<br />
»<br />
»<br />
»<br />
»<br />
»<br />
»<br />
»<br />
»<br />
»<br />
»<br />
»<br />
»<br />
»<br />
»<br />
»<br />
»<br />
Rank Agglomeration Country Population size (million) Expected<br />
growth (%)<br />
1975 2000 2015 2000–2015<br />
1 Tokyo<br />
Japan<br />
19.771 26.444 26.444 0.00<br />
2 Bombay<br />
India<br />
6.856 18.066 26.138 44.68<br />
3 Lagos<br />
Nigeria<br />
3.300 13.427 23.173 72.59<br />
4 Dhaka<br />
Bangladesh<br />
2.172 12.317 21.119 71.46<br />
5 São Paolo<br />
Brazil<br />
10.047 17.755 20.397 14.88<br />
6 Karachi<br />
Pakistan<br />
3.983 11.794 19.211 62.89<br />
7 Mexico City Mexico<br />
11.236 18.131 19.180 5.79<br />
8 New York<br />
United States of America 15.880 16.640 17.432 4.76<br />
9 Jakarta<br />
Indonesia<br />
4.814 11.018 17.256 56.62<br />
10 Calcutta<br />
India<br />
7.888 12.918 17.252 33.55<br />
11 Delhi<br />
India<br />
4.426 11.695 16.808 43.72<br />
12 Metro Manila Philippines<br />
5.000 10.870 14.825 36.38<br />
13 Shanghai<br />
China<br />
11.443 12.887 14.575 13.10<br />
14 Los Angeles United States of America 8.926 13.140 14.080 7.15<br />
15 Buenos Aires Argentina<br />
9.144 12.560 14.076 12.07<br />
16 Cairo<br />
Egypt<br />
6.079 10.552 13.751 30.32<br />
17 Istanbul<br />
Turkey<br />
3.601 9.451 12.492 32.18<br />
18 Beijing<br />
China<br />
8.545 10.839 12.299 13.47<br />
19 Rio de Janeiro Brazil<br />
7.854 10.582 11.905 12.50<br />
20 Osaka<br />
Japan<br />
9.844 11.013 11.013 0.00<br />
21 Tianjin<br />
China<br />
6.160 9.156 10.713 17.01<br />
22 Hyderabad India<br />
2.086 6.842 10.457 52.84<br />
23 Bangkok<br />
Thail<strong>and</strong><br />
3.842 7.281 10.143 39.31<br />
24 Lahore<br />
Pakistan<br />
2.399 6.040 9.961 64.92<br />
25 Seoul<br />
Republic of Korea<br />
6.808 9.888 9.923 0.35<br />
26 Paris<br />
France<br />
8.885 9.624 9.677 0.55<br />
27 Lima<br />
Peru<br />
3.651 7.443 9.388 26.13<br />
28 Kinshasa<br />
Dem. Rep. of the Congo 1.735 5.064 9.366 84.95<br />
29 Moscow<br />
Russian Federation<br />
7.623 9.321 9.353 0.34<br />
30 Madras<br />
India<br />
3.609 6.648 9.145 37.56<br />
31 Chongqing China<br />
2.439 5.312 8.949 68.47<br />
32 Teheran<br />
Islamic Republic of Iran 4.274 7.225 8.709 20.54<br />
33 Bogotá<br />
Colombia<br />
3.036 6.288 8.006 27.32<br />
Total (coastal agglomerations) 150.6 254.1 324.1 27.53<br />
Total (all agglomerations) 217.4 368.2 467.2 26.88<br />
Rank in<br />
1975<br />
1<br />
15<br />
33<br />
43<br />
5<br />
16<br />
4<br />
2<br />
22<br />
12<br />
23<br />
21<br />
3<br />
8<br />
7<br />
20<br />
32<br />
10<br />
13<br />
6<br />
19<br />
45<br />
28<br />
41<br />
16<br />
9<br />
30<br />
n/a<br />
14<br />
31<br />
40<br />
25<br />
35<br />
Rank in<br />
2000<br />
1<br />
3<br />
6<br />
11<br />
4<br />
12<br />
2<br />
5<br />
14<br />
8<br />
13<br />
16<br />
9<br />
7<br />
10<br />
19<br />
22<br />
17<br />
18<br />
15<br />
24<br />
31<br />
27<br />
35<br />
20<br />
21<br />
25<br />
40<br />
23<br />
32<br />
38<br />
28<br />
34<br />
n/a: not available.<br />
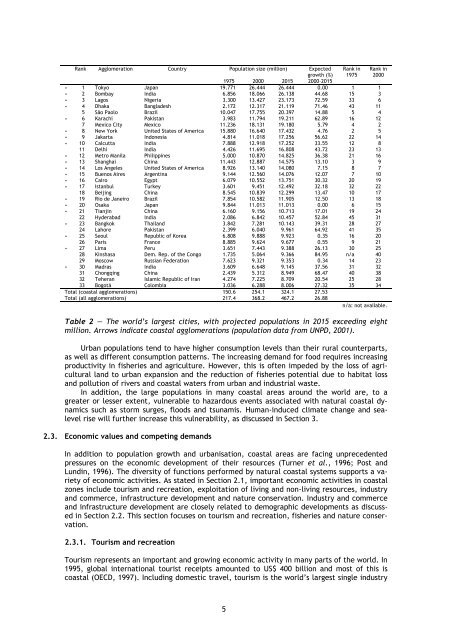
Table 2 — The world’s largest cities, with projected populations in 2015 exceeding eight<br />
million. Arrows indicate coastal agglomerations (population data from UNPD, 2001).<br />
Urban populations tend <strong>to</strong> have higher consumption levels than their rural counterparts,<br />
as well as different consumption patterns. The increasing dem<strong>and</strong> for food requires increasing<br />
productivity in fisheries <strong>and</strong> agriculture. However, this is often impeded by the loss of agricultural<br />
l<strong>and</strong> <strong>to</strong> urban expansion <strong>and</strong> the reduction of fisheries potential due <strong>to</strong> habitat loss<br />
<strong>and</strong> pollution of rivers <strong>and</strong> coastal waters from urban <strong>and</strong> industrial waste.<br />
In addition, the large populations in many coastal areas around the world are, <strong>to</strong> a<br />
greater or lesser extent, vulnerable <strong>to</strong> hazardous events associated with natural coastal dynamics<br />
such as s<strong>to</strong>rm surges, floods <strong>and</strong> tsunamis. Human-induced climate change <strong>and</strong> sealevel<br />
rise will further increase this <strong>vulnerability</strong>, as discussed in Section 3.<br />
2.3. Economic values <strong>and</strong> competing dem<strong>and</strong>s<br />
In addition <strong>to</strong> population growth <strong>and</strong> urbanisation, coastal areas are facing unprecedented<br />
pressures on the economic development of their resources (Turner et al., 1996; Post <strong>and</strong><br />
Lundin, 1996). The diversity of functions performed by natural coastal systems supports a variety<br />
of economic activities. As stated in Section 2.1, important economic activities in coastal<br />
zones include <strong>to</strong>urism <strong>and</strong> recreation, exploitation of living <strong>and</strong> non-living resources, industry<br />
<strong>and</strong> commerce, infrastructure development <strong>and</strong> nature conservation. Industry <strong>and</strong> commerce<br />
<strong>and</strong> infrastructure development are closely related <strong>to</strong> demographic developments as discussed<br />
in Section 2.2. This section focuses on <strong>to</strong>urism <strong>and</strong> recreation, fisheries <strong>and</strong> nature conservation.<br />
2.3.1. Tourism <strong>and</strong> recreation<br />
Tourism represents an important <strong>and</strong> growing economic activity in many parts of the world. In<br />
1995, global international <strong>to</strong>urist receipts amounted <strong>to</strong> US$ 400 billion <strong>and</strong> most of this is<br />
coastal (OECD, 1997). Including domestic travel, <strong>to</strong>urism is the world’s largest single industry<br />
5