Presentation of WAPDA - Planning Commission
Presentation of WAPDA - Planning Commission
Presentation of WAPDA - Planning Commission

You also want an ePaper? Increase the reach of your titles
YUMPU automatically turns print PDFs into web optimized ePapers that Google loves.
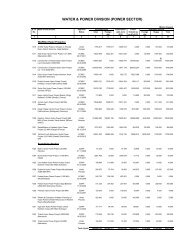
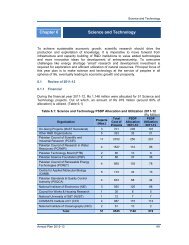
<strong>WAPDA</strong> Hydroelectric<br />
Power Sale Billing and Settlement Plan for FY 2010-11<br />
Unit Jul-10 Aug-10 Sep-10 Oct-10 Nov-10 Dec-10 Jan-11 Feb-11 Mar-11 Apr-11 May-11 Jun-11 Total<br />
Contracted Capacity MW 6,444 6,444 6,444 6,444 6,444 6,444 6,444 6,444 6,444 6,444 6,444 6,444 6,444<br />
Estimated Sale <strong>of</strong> Power Gwh 3,894 4,064 4,100 2,100 2,471 1,045 514 1,532 1,419 1,553 2,847 3,011 28,550<br />
Fixed Charges Rs./kW/M 265.96 265.96 265.96 414.02 414.02 414.02 414.02 414.02 414.02 414.02 414.02 414.02<br />
Variable Charges Rs/kWh 0.3087 0.3087 0.3087 0.0590 0.0590 0.0590 0.0590 0.0590 0.0590 0.0590 0.0590 0.0590<br />
Revenue invoices<br />
Fixed Charges Mln. Rs. 1,714 1,714 1,714 2,668 2,668 2,668 2,668 2,668 2,668 2,668 2,668 2,668 29,153<br />
Variable Charges Mln. Rs. 1202 1,202 1254 1,254 1266 1,266 124 146 62 30 90 84 92 168 178 4695 4,695<br />
Total Billing Mln. Rs. 2,916 2,968 2,979 2,792 2,814 2,730 2,698 2,758 2,752 2,760 2,836 2,846 33,848<br />
Payments required<br />
Employees Salaries & Benefit Mln. Rs. 248 248 248 248 248 266 266 266 266 266 266 266 3,102<br />
Administration Costs Mln. Rs. 80 80 80 80 80 80 80 80 80 80 80 80 960<br />
Plant Maintenance Cost Mln. Rs. 100 100 100 925 838 89 110 110 110 120 120 122 2,844<br />
Net Hydel Pr<strong>of</strong>it to KPK Mln. Rs. 500 500 500 500 500 500 500 500 500 500 500 500 6,000<br />
Water Usage Charges to AJK Mln. Rs. 71 72 64 62 53 39 4 73 42 70 88 82 720<br />
Sukuk Rental 480 - - 516 - - 488 - - 514 - - 1,998<br />
Supplier's Credit payment Mln. Rs. - 794 - - - - 781 - - - - - 1,575<br />
total Mln. Rs. 1,479 1,794 992 2,331 1,719 974 2,229 1,029 998 1,550 1,054 1,050 17,199<br />
Debt servicing <strong>of</strong> GoP loans Mln. Rs. - - - - - 5,915 - - - - - 5,915 11,830<br />
Surplus for Power dev projects Mln. Rs. 1,437 1,174 1,987 461 1,095 (4,159) 469 1,729 1,754 1,210 1,782 (4,119) 4,819<br />
KAPCO dividends / misc income Mln. Rs. 45 1106 1,106 25 804 50 2030 2,030<br />
Surplus for Power dev projects Total 1,437 1,174 2,032 461 2,200 (4,159) 494 1,729 2,558 1,210 1,782 (4,069) 6,849<br />
6 October 2010 18