

The economic contribution of small to medium-sized grocery ...
The economic contribution of small to medium-sized grocery ...
The economic contribution of small to medium-sized grocery ...

You also want an ePaper? Increase the reach of your titles
YUMPU automatically turns print PDFs into web optimized ePapers that Google loves.
National overview <strong>of</strong> the retail and <strong>grocery</strong> industries<br />
However, the nature <strong>of</strong> the dominance <strong>of</strong> the <strong>to</strong>p two major retailers in Australia is<br />
stronger. <strong>The</strong>re are suggestions that Coles and Woolworths do not <strong>of</strong>ten compete in a<br />
single shopping area and effectively provide a similar <strong>of</strong>fering <strong>to</strong> consumers (ie<br />
promote themselves as providers <strong>of</strong> fresh <strong>grocery</strong> products with low prices on a<br />
selection <strong>of</strong> core goods). This indicates that potentially there should be greater<br />
concern and interest in Australia in the future implications <strong>of</strong> such high market<br />
concentration on competition and consumer welfare in the supermarket and <strong>grocery</strong><br />
market.<br />
2.2.2 Spending patterns<br />
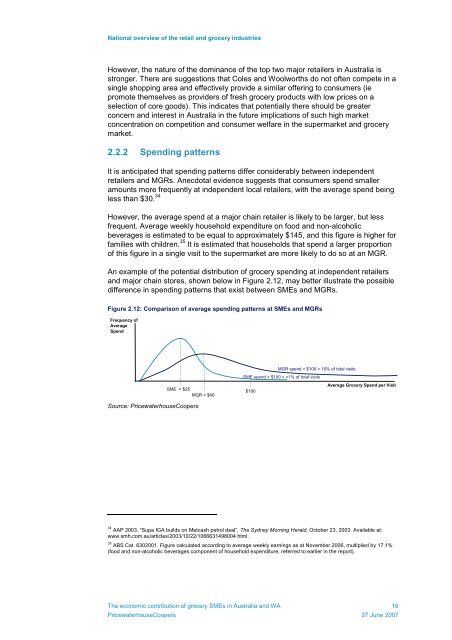
It is anticipated that spending patterns differ considerably between independent<br />
retailers and MGRs. Anecdotal evidence suggests that consumers spend <strong>small</strong>er<br />
amounts more frequently at independent local retailers, with the average spend being<br />
less than $30. 34<br />
However, the average spend at a major chain retailer is likely <strong>to</strong> be larger, but less<br />
frequent. Average weekly household expenditure on food and non-alcoholic<br />
beverages is estimated <strong>to</strong> be equal <strong>to</strong> approximately $145, and this figure is higher for<br />
families with children. 35 It is estimated that households that spend a larger proportion<br />
<strong>of</strong> this figure in a single visit <strong>to</strong> the supermarket are more likely <strong>to</strong> do so at an MGR.<br />
An example <strong>of</strong> the potential distribution <strong>of</strong> <strong>grocery</strong> spending at independent retailers<br />
and major chain s<strong>to</strong>res, shown below in Figure 2.12, may better illustrate the possible<br />
difference in spending patterns that exist between SMEs and MGRs.<br />
Figure 2.12: Comparison <strong>of</strong> average spending patterns at SMEs and MGRs<br />
Frequency <strong>of</strong><br />
Average<br />
Spend<br />
SME = $25<br />
MGR = $40<br />
MGR spend > $100 = 10% <strong>of</strong> <strong>to</strong>tal visits<br />
SME spend > $100 =


