HEFA-1999 Part 1/2nd proof - Human Fertilisation & Embryology ...
HEFA-1999 Part 1/2nd proof - Human Fertilisation & Embryology ...
HEFA-1999 Part 1/2nd proof - Human Fertilisation & Embryology ...

Create successful ePaper yourself
Turn your PDF publications into a flip-book with our unique Google optimized e-Paper software.
CHAPTER 4 COLLECTING AND PROVIDING DATA<br />
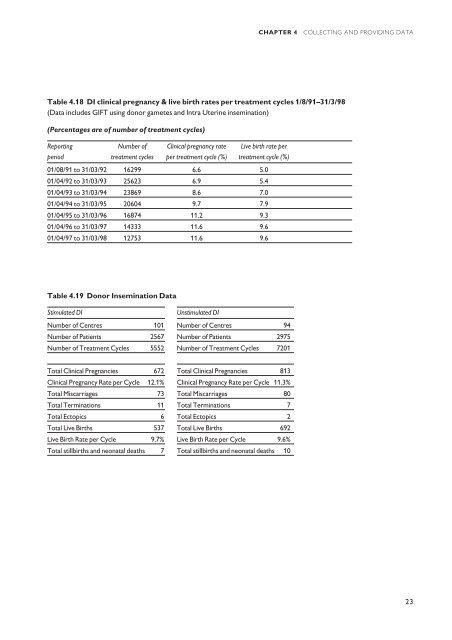
Table 4.18 DI clinical pregnancy & live birth rates per treatment cycles 1/8/91–31/3/98<br />
(Data includes GIFT using donor gametes and Intra Uterine insemination)<br />
(Percentages are of number of treatment cycles)<br />
Reporting Number of Clinical pregnancy rate Live birth rate per<br />
period treatment cycles per treatment cycle (%) treatment cycle (%)<br />
01/08/91 to 31/03/92 16299 6.6 5.0<br />
01/04/92 to 31/03/93 25623 6.9 5.4<br />
01/04/93 to 31/03/94 23869 8.6 7.0<br />
01/04/94 to 31/03/95 20604 9.7 7.9<br />
01/04/95 to 31/03/96 16874 11.2 9.3<br />
01/04/96 to 31/03/97 14333 11.6 9.6<br />
01/04/97 to 31/03/98 12753 11.6 9.6<br />
Table 4.19 Donor Insemination Data<br />
Stimulated DI<br />
Unstimulated DI<br />
Number of Centres 101 Number of Centres 94<br />
Number of Patients 2567 Number of Patients 2975<br />
Number of Treatment Cycles 5552 Number of Treatment Cycles 7201<br />
Total Clinical Pregnancies 672 Total Clinical Pregnancies 813<br />
Clinical Pregnancy Rate per Cycle 12.1% Clinical Pregnancy Rate per Cycle 11.3%<br />
Total Miscarriages 73 Total Miscarriages 80<br />
Total Terminations 11 Total Terminations 7<br />
Total Ectopics 6 Total Ectopics 2<br />
Total Live Births 537 Total Live Births 692<br />
Live Birth Rate per Cycle 9.7% Live Birth Rate per Cycle 9.6%<br />
Total stillbirths and neonatal deaths 7 Total stillbirths and neonatal deaths 10<br />
23