Internal versus External growth: impact on operational and ... - CEREG
Internal versus External growth: impact on operational and ... - CEREG
Internal versus External growth: impact on operational and ... - CEREG

Create successful ePaper yourself
Turn your PDF publications into a flip-book with our unique Google optimized e-Paper software.
company is able to generate more cash flows from the merger or the internal investment. This<br />
lag, between the moment when the total assets are increased <strong>and</strong> when the cash flows follow<br />
that increase of total assets, partly explains the negative coefficients of the regressi<strong>on</strong>.<br />
Moreover, Panel D of figure 4 gives another explanati<strong>on</strong> to this phenomen<strong>on</strong>. It seems that<br />
companies which grew up internally the most have the lowest cumulated cash-flows returns.<br />
However, when the cumulated internal <str<strong>on</strong>g>growth</str<strong>on</strong>g> rate decreases up to a certain point,<br />
performance again behaves more naturally <strong>and</strong> increases as the cumulated internal <str<strong>on</strong>g>growth</str<strong>on</strong>g> rate<br />
increases.<br />
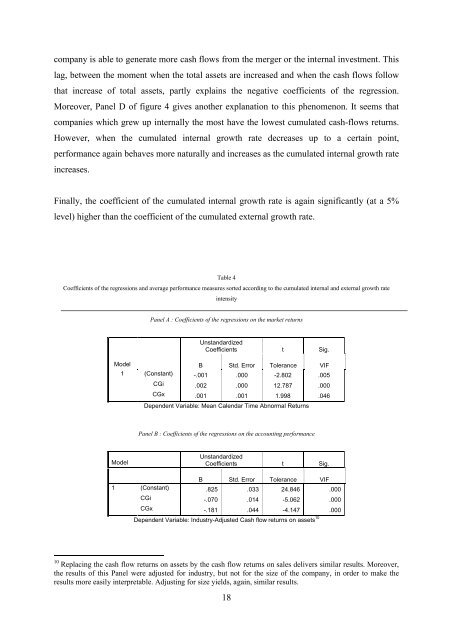
Finally, the coefficient of the cumulated internal <str<strong>on</strong>g>growth</str<strong>on</strong>g> rate is again significantly (at a 5%<br />
level) higher than the coefficient of the cumulated external <str<strong>on</strong>g>growth</str<strong>on</strong>g> rate.<br />
Table 4<br />
Coefficients of the regressi<strong>on</strong>s <strong>and</strong> average performance measures sorted according to the cumulated internal <strong>and</strong> external <str<strong>on</strong>g>growth</str<strong>on</strong>g> rate<br />
intensity<br />
Panel A : Coefficients of the regressi<strong>on</strong>s <strong>on</strong> the market returns<br />
Unst<strong>and</strong>ardized<br />
Coefficients t Sig.<br />
Model B Std. Error Tolerance VIF<br />
1<br />
(C<strong>on</strong>stant) -.001 .000 -2.802 .005<br />
CGi .002 .000 12.787 .000<br />
CGx .001 .001 1.998 .046<br />
Dependent Variable: Mean Calendar Time Abnormal Returns<br />
Panel B : Coefficients of the regressi<strong>on</strong>s <strong>on</strong> the accounting performance<br />
Model<br />
Unst<strong>and</strong>ardized<br />
Coefficients t Sig.<br />
B Std. Error Tolerance VIF<br />
1 (C<strong>on</strong>stant) .825 .033 24.846 .000<br />
CGi -.070 .014 -5.062 .000<br />
CGx -.181 .044 -4.147 .000<br />
Dependent Variable: Industry-Adjusted Cash flow returns <strong>on</strong> assets 10<br />
10 Replacing the cash flow returns <strong>on</strong> assets by the cash flow returns <strong>on</strong> sales delivers similar results. Moreover,<br />
the results of this Panel were adjusted for industry, but not for the size of the company, in order to make the<br />
results more easily interpretable. Adjusting for size yields, again, similar results.<br />
18


![& 6 ] ^ F ]^ - CEREG - Université Paris-Dauphine](https://img.yumpu.com/33326502/1/184x260/-6-f-cereg-universitac-paris-dauphine.jpg?quality=85)