Internal versus External growth: impact on operational and ... - CEREG
Internal versus External growth: impact on operational and ... - CEREG
Internal versus External growth: impact on operational and ... - CEREG

You also want an ePaper? Increase the reach of your titles
YUMPU automatically turns print PDFs into web optimized ePapers that Google loves.
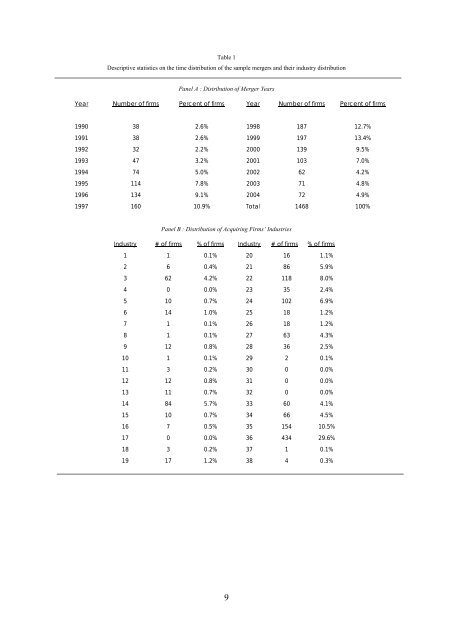
Table 1<br />
Descriptive statistics <strong>on</strong> the time distributi<strong>on</strong> of the sample mergers <strong>and</strong> their industry distributi<strong>on</strong><br />
Panel A : Distributi<strong>on</strong> of Merger Years<br />
Year Number of firms Percent of firms Year Number of firms Percent of firms<br />
1990 38 2.6% 1998 187 12.7%<br />
1991 38 2.6% 1999 197 13.4%<br />
1992 32 2.2% 2000 139 9.5%<br />
1993 47 3.2% 2001 103 7.0%<br />
1994 74 5.0% 2002 62 4.2%<br />
1995 114 7.8% 2003 71 4.8%<br />
1996 134 9.1% 2004 72 4.9%<br />
1997 160 10.9% Total 1468 100%<br />
Panel B : Distributi<strong>on</strong> of Acquiring Firms’ Industries<br />
Industry # of firms % of firms Industry # of firms % of firms<br />
1 1 0.1% 20 16 1.1%<br />
2 6 0.4% 21 86 5.9%<br />
3 62 4.2% 22 118 8.0%<br />
4 0 0.0% 23 35 2.4%<br />
5 10 0.7% 24 102 6.9%<br />
6 14 1.0% 25 18 1.2%<br />
7 1 0.1% 26 18 1.2%<br />
8 1 0.1% 27 63 4.3%<br />
9 12 0.8% 28 36 2.5%<br />
10 1 0.1% 29 2 0.1%<br />
11 3 0.2% 30 0 0.0%<br />
12 12 0.8% 31 0 0.0%<br />
13 11 0.7% 32 0 0.0%<br />
14 84 5.7% 33 60 4.1%<br />
15 10 0.7% 34 66 4.5%<br />
16 7 0.5% 35 154 10.5%<br />
17 0 0.0% 36 434 29.6%<br />
18 3 0.2% 37 1 0.1%<br />
19 17 1.2% 38 4 0.3%<br />
9


![& 6 ] ^ F ]^ - CEREG - Université Paris-Dauphine](https://img.yumpu.com/33326502/1/184x260/-6-f-cereg-universitac-paris-dauphine.jpg?quality=85)