Deep-tow magnetic anomaly study of the Pacific Jurassic Quiet Zone ...
Deep-tow magnetic anomaly study of the Pacific Jurassic Quiet Zone ...
Deep-tow magnetic anomaly study of the Pacific Jurassic Quiet Zone ...

You also want an ePaper? Increase the reach of your titles
YUMPU automatically turns print PDFs into web optimized ePapers that Google loves.
B07110<br />
TOMINAGA ET AL.: JURASSIC QUIET ZONE MAGNETIC ANOMALIES<br />
B07110<br />
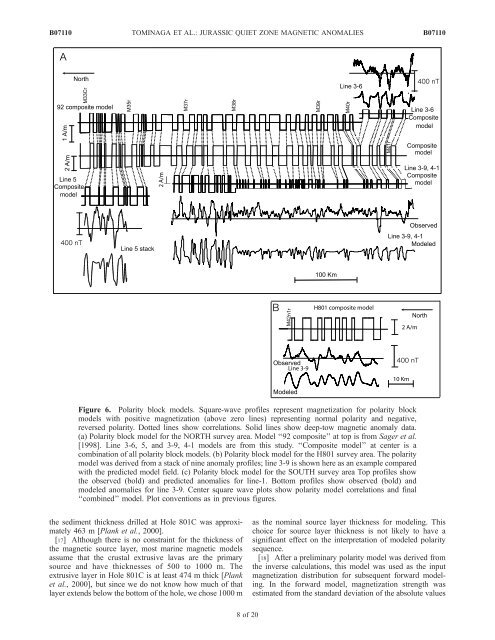
Figure 6. Polarity block models. Square-wave pr<strong>of</strong>iles represent magnetization for polarity block<br />
models with positive magnetization (above zero lines) representing normal polarity and negative,<br />
reversed polarity. Dotted lines show correlations. Solid lines show deep-<strong>tow</strong> <strong>magnetic</strong> <strong>anomaly</strong> data.<br />
(a) Polarity block model for <strong>the</strong> NORTH survey area. Model ‘‘92 composite’’ at top is from Sager et al.<br />
[1998]. Line 3-6, 5, and 3-9, 4-1 models are from this <strong>study</strong>. ‘‘Composite model’’ at center is a<br />
combination <strong>of</strong> all polarity block models. (b) Polarity block model for <strong>the</strong> H801 survey area. The polarity<br />
model was derived from a stack <strong>of</strong> nine <strong>anomaly</strong> pr<strong>of</strong>iles; line 3-9 is shown here as an example compared<br />
with <strong>the</strong> predicted model field. (c) Polarity block model for <strong>the</strong> SOUTH survey area Top pr<strong>of</strong>iles show<br />
<strong>the</strong> observed (bold) and predicted anomalies for line-1. Bottom pr<strong>of</strong>iles show observed (bold) and<br />
modeled anomalies for line 3-9. Center square wave plots show polarity model correlations and final<br />
‘‘combined’’ model. Plot conventions as in previous figures.<br />
<strong>the</strong> sediment thickness drilled at Hole 801C was approximately<br />
463 m [Plank et al., 2000].<br />
[17] Although <strong>the</strong>re is no constraint for <strong>the</strong> thickness <strong>of</strong><br />
<strong>the</strong> <strong>magnetic</strong> source layer, most marine <strong>magnetic</strong> models<br />
assume that <strong>the</strong> crustal extrusive lavas are <strong>the</strong> primary<br />
source and have thicknesses <strong>of</strong> 500 to 1000 m. The<br />
extrusive layer in Hole 801C is at least 474 m thick [Plank<br />
et al., 2000], but since we do not know how much <strong>of</strong> that<br />
layer extends below <strong>the</strong> bottom <strong>of</strong> <strong>the</strong> hole, we chose 1000 m<br />
as <strong>the</strong> nominal source layer thickness for modeling. This<br />
choice for source layer thickness is not likely to have a<br />
significant effect on <strong>the</strong> interpretation <strong>of</strong> modeled polarity<br />
sequence.<br />
[18] After a preliminary polarity model was derived from<br />
<strong>the</strong> inverse calculations, this model was used as <strong>the</strong> input<br />
magnetization distribution for subsequent forward modeling.<br />
In <strong>the</strong> forward model, magnetization strength was<br />
estimated from <strong>the</strong> standard deviation <strong>of</strong> <strong>the</strong> absolute values<br />
8<strong>of</strong>20