P2Exam - Sci-Bono Discovery Centre
P2Exam - Sci-Bono Discovery Centre
P2Exam - Sci-Bono Discovery Centre

Create successful ePaper yourself
Turn your PDF publications into a flip-book with our unique Google optimized e-Paper software.
Life <strong>Sci</strong>ences/P2 14 DBE/November 2010<br />
NSC<br />
SECTION C<br />
QUESTION 4<br />
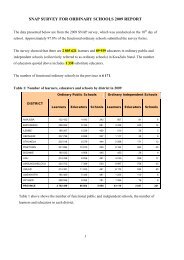
4.1 Study the table below that represents the amount of carbon dioxide emissions<br />
from different countries in 2002.<br />
Countries Total annual CO 2<br />
emission in 2002<br />
(million tons CO 2 /yr)<br />
Proportion of<br />
world total (%)<br />
USA 5 673 22<br />
China 3 733 15<br />
Russian Federation 1 477 6<br />
India 1 106 5<br />
South Africa 364 2<br />
Other countries X 50<br />
Total 24 706 100<br />
[Adapted from: World Resources Institute, 2006]<br />
4.1.1 Calculate the total annual CO 2 emission in other countries (X) from<br />
the table above. Show ALL workings. (3)<br />
4.1.2 The Kyoto Protocol was drafted by the United Nations (UN) in 1997<br />
to provide a global action plan to reduce carbon dioxide emissions<br />
by the year 2012. The United States of America (USA) is not<br />
implementing the Kyoto Protocol.<br />
(a)<br />
(b)<br />
Explain the impact that this decision by the USA has on the<br />
rest of the world.<br />
If you were working for the UN, explain TWO arguments that<br />
you would use to persuade the USA to implement the Kyoto<br />
Protocol.<br />
(2)<br />
(4)<br />
4.1.3<br />
4.1.4<br />
South Africa has the highest annual emission of CO 2 in Africa.<br />
Give THREE reasons for this.<br />
Draw a pie chart to show the proportion of CO 2 emissions from the<br />
different countries, as shown in the table above. Show ALL<br />
calculations.<br />
(3)<br />
(13)<br />
(25)<br />
4.2 Explain SIX strategies to reduce the amount of air pollution entering the<br />
atmosphere from human activity.<br />
Synthesis:<br />
(12)<br />
(3)<br />
(15)<br />
NOTE:<br />
NO marks will be awarded for answers in the form of flow<br />
charts or diagrams.<br />
TOTAL SECTION C:<br />
GRAND TOTAL:<br />
40<br />
150<br />
Copyright reserved