Supply Chain Report - Logistics Association of Australia
Supply Chain Report - Logistics Association of Australia
Supply Chain Report - Logistics Association of Australia

You also want an ePaper? Increase the reach of your titles
YUMPU automatically turns print PDFs into web optimized ePapers that Google loves.
<strong>Supply</strong> <strong>Chain</strong> <strong>Report</strong><br />
<strong>Logistics</strong> <strong>Association</strong> <strong>of</strong> <strong>Australia</strong> Ltd<br />
www.laa.asn.au<br />
1986-2011
S u p p l y C h a i n R e p o r t 2 0 1 0<br />
Contents<br />
Our Program Partners - <strong>Logistics</strong> Bureau Page 4-6<br />
Section A: Economic Update Pages 7-14<br />
Economic Overview Page 7-9<br />
World’s GDP Growth<br />
<strong>Australia</strong>’s GDP Growth<br />
<strong>Australia</strong>’s GDP Growth by Sector<br />
Contribution <strong>of</strong> Transportation and Storage Sectors<br />
to <strong>Australia</strong>’s GDP<br />
Change <strong>of</strong> Gross Product by Sector<br />
Breakdown <strong>of</strong> Gross Product in Transport and Storage<br />
Industry<br />
Change <strong>of</strong> Gross Product in Transport and Storage<br />
Sub-Sectors<br />
Labour Force Page 9-10<br />
<strong>Australia</strong>’s Labour Force<br />
<strong>Australia</strong>’s Labour Force by Industry<br />
Inflation Page 10<br />
Inflation<br />
Contribution to Annual Inflation by Product Group<br />
Freight Volume Page 11-13<br />
<strong>Australia</strong>’s Freight Volume<br />
<strong>Australia</strong>’s International Trade Account (Excluding Services)<br />
International Sea Freight: Volume and Value<br />
Container Throughput at <strong>Australia</strong>n Ports<br />
Domestic Freight Task<br />
Transport and Warehousing Cost Page 13-14<br />
Transport and Warehousing Cost<br />
Labour Cost<br />
Fuel Cost<br />
Industrial Rental Cost<br />
Section B: Market Update Pages 15-21<br />
Update on Climate Change Page 15<br />
An Update on Climate Change<br />
Greenhouse Gas Emissions Reduction Target<br />
Industry Initiatives Highlights Page 16<br />
Significant Mergers and Acquisitions Page 16<br />
All Sectors<br />
Transport and <strong>Logistics</strong> Sectors<br />
Significant Infrastructure Programs Page 17-20<br />
<strong>Australia</strong>’s Future Infrastructure<br />
Significant Infrastructure Upgrade: Rail<br />
Significant Infrastructure Upgrade: Road<br />
Significant Infrastructure Upgrade: Ports and ICT<br />
Warehouse Availability and Trends Page 20-21<br />
Demand<br />
<strong>Supply</strong><br />
Section C: Market Participants Page 22<br />
Major Players in Integrated <strong>Logistics</strong><br />
Section D: <strong>Australia</strong>n Industry Performance Page 23<br />
International <strong>Logistics</strong> Performance Index<br />
Total Business Inventory<br />
Inventory to Sales Ratio<br />
Section E: Employment and Training Page 24-25<br />
Employment Level<br />
Change <strong>of</strong> Job Vacancies<br />
Employment by Gender<br />
Employment by Age<br />
Education and Training in <strong>Logistics</strong><br />
Section F: Regulatory Environment Page 26<br />
Regulatory Reform - The Development<br />
References Page 27<br />
www.laa.asn.au 2
S u p p l y C h a i n R e p o r t 2 0 1 0<br />
Welcome<br />
Welcome to the third edition <strong>of</strong> our <strong>Supply</strong> <strong>Chain</strong> <strong>Report</strong>: 2010, which aims to provide a definitive report on the<br />
state <strong>of</strong> the logistics and supply chain industry in <strong>Australia</strong>.<br />
The report is issued on an annual basis and is complimentary to all financial LAA members and Friends <strong>of</strong> the LAA,<br />
and I am sure it will provide an invaluable resource for all industry pr<strong>of</strong>essionals.<br />
Undertaking to deliver this research report reflects our commitment to promoting logistics and supply chain<br />
management practices, analysis and benchmarking for the benefit <strong>of</strong> the industry.<br />
We would like to thank and congratulate our program partners <strong>Logistics</strong> Bureau. Under our agreement, <strong>Logistics</strong> Bureau provides<br />
research content and analysis on its research findings once a year. This economic and market update defines market participants,<br />
reviews <strong>Australia</strong>n industry performance and includes findings on the employment environment, as well as training and the regulatory<br />
environment.<br />
Mike Owen<br />
National President<br />
For more information about the <strong>Supply</strong> <strong>Chain</strong> <strong>Report</strong> contact the LAA:<br />
Tel: 1300 651 911<br />
Email: admin@laa.asn.au<br />
© “<strong>Supply</strong> <strong>Chain</strong> <strong>Report</strong> 2010” and supply chain report are copyrighted to the <strong>Logistics</strong> <strong>Association</strong> <strong>of</strong> <strong>Australia</strong> Ltd<br />
Published February 2010.<br />
1986-2011<br />
www.laa.asn.au 3
S u p p l y C h a i n R e p o r t 2 0 1 0<br />
Foreword<br />
<strong>Logistics</strong> Bureau once again welcomes the opportunity <strong>of</strong> partnering with the LAA on this <strong>Supply</strong> <strong>Chain</strong> <strong>Report</strong> initiative for the benefit<br />
<strong>of</strong> LAA members and the broader business community.<br />
Undertaking to deliver this research report also reflects our commitment to promoting improved logistics and supply chain management<br />
practices and providing appropriate benchmarking for the benefit <strong>of</strong> our industry.<br />
In compiling this report, we would like to acknowledge the significant contributions made by a number <strong>of</strong> organisations that are fully<br />
referenced at the end <strong>of</strong> the report. We would also like to personally thank and acknowledge the efforts <strong>of</strong> Dr Patcharee Boonyathan<br />
<strong>of</strong> <strong>Logistics</strong> Bureau Asia for leading and completing this research.<br />
We received very positive feedback and ideas from LAA members following our previous reports and we look forward to further ideas<br />
that can be incorporated in the future.<br />
We would just ask you to remember that when reading the report, the information included comes from a wide range <strong>of</strong> sources and<br />
may not always fully align.<br />
We have not attempted to interpret the data but rather present it to you to draw your own conclusions.<br />
Happy reading.<br />
Last thoughts<br />
While we have not attempted to interpret the data in this report but rather present it for you to draw your own conclusions, we have<br />
been asked to share some thoughts and views based on this report and my broader exposure to our industry.<br />
I recently conducted a closed survey <strong>of</strong> a number <strong>of</strong> senior managers in some <strong>of</strong> our leading businesses here in <strong>Australia</strong>. I wanted to<br />
get ‘inside their heads’ and understand some <strong>of</strong> the key <strong>Supply</strong> <strong>Chain</strong> and <strong>Logistics</strong> issues they are facing. The results were interesting<br />
and not altogether surprising, and seem to fit well with some <strong>of</strong> the key aspects <strong>of</strong> this report.<br />
The top two things that keep these managers awake at night are understandably maintaining customer service while, at the same time,<br />
trying to reduce costs. Most businesses face the situation <strong>of</strong> trying to do more with less, and this is reflected in the report in areas such<br />
as reducing inventory levels.<br />
www.laa.asn.au 4
S u p p l y C h a i n R e p o r t 2 0 1 0<br />
Our Program Partners -<br />
<strong>Logistics</strong> Bureau Continued<br />
When it comes to the daily frustrations <strong>of</strong> these senior managers, finding quality staff rates very highly. This reflects the trend that we<br />
have seen in our <strong>Supply</strong> <strong>Chain</strong> reports <strong>of</strong> an ageing workforce in our industry, one that is male dominated and in which industry-specific<br />
tertiary education can still be improved and made more readily available.<br />
As I continue to enjoy helping a broad range <strong>of</strong> organisations across our region improve their performance, the challenges that they<br />
face are different and yet <strong>of</strong>ten seem similar.<br />
• IBP or Integrated Business Planning, perhaps more commonly known as Sales and Operations Planning, is still a significant<br />
opportunity for most organisations as they try to improve cross-functional communication and customer service, while at the same<br />
time reducing costs.<br />
• Technology is playing an ever-increasing role in not only the reduction <strong>of</strong> operating costs but in the provision essential cost and service<br />
information, in real time where possible. Accessing accurate and timely information with which to make informed <strong>Supply</strong> <strong>Chain</strong><br />
decisions is still not that easy for many businesses. Easily accessible cost and service performance metrics are an essential tool<br />
in the current environment.<br />
• An environment <strong>of</strong> constant change is being experienced by many in our industry that requires more agile and flexible <strong>Supply</strong><br />
<strong>Chain</strong> solutions and service <strong>of</strong>ferings, particularly for those businesses struggling to remain competitive against low cost imports<br />
or internet-based sales. But it is also the changing regulatory and legislative landscape that provides a challenge, particularly when<br />
a lack <strong>of</strong> harmonisation exists in some areas between States and the Commonwealth.<br />
• Whilst I have touched on the need for improved staff training and education experienced by many organisations, a broader<br />
awareness <strong>of</strong> <strong>Supply</strong> <strong>Chain</strong> management seems to be lacking across non <strong>Supply</strong> <strong>Chain</strong> functional areas. Perhaps this is also a<br />
symptom <strong>of</strong> having to do more with less, but the consequences <strong>of</strong>ten manifest in poor decision-making at a senior level,<br />
leading to higher-than-necessary costs, customer service impacts and waste.<br />
I hope you enjoy reading this year’s <strong>Supply</strong> <strong>Chain</strong> <strong>Report</strong> and find it <strong>of</strong> value.<br />
Rob O’Byrne<br />
Group Managing Director<br />
<strong>Logistics</strong> Bureau<br />
www.laa.asn.au 5
S u p p l y C h a i n R e p o r t 2 0 1 0<br />
About <strong>Logistics</strong> Bureau<br />
<strong>Logistics</strong> Bureau is a management consulting company established in 1997 that<br />
is focused soley on <strong>Logistics</strong> and the <strong>Supply</strong> <strong>Chain</strong>. <strong>Logistics</strong> Bureau has <strong>of</strong>fices in<br />
Sydney, Melbourne, Singapore and Bangkok.<br />
For businesses looking for increased competitive advantage, <strong>Logistics</strong> Bureau<br />
provides direction and support in driving improved pr<strong>of</strong>itability, improved customer<br />
service and increased <strong>Supply</strong> <strong>Chain</strong> flexibility.<br />
LOGISTICS BUREAU SERVICES<br />
<strong>Logistics</strong> Bureau provides a wide range <strong>of</strong> services as depicted here, from assisting in<br />
developing <strong>Supply</strong> <strong>Chain</strong> strategies, right down to implementation. Our experience<br />
covers a wide range <strong>of</strong> companies and industries.<br />
We are very proud <strong>of</strong> the fact that our business is 100% demand-driven, with over 67%<br />
being repeat business. This is a clear testament <strong>of</strong> the value delivered to our customers.<br />
LOGISTICS BUREAU RESOURCES<br />
With over 30 specialist consultants available, <strong>Logistics</strong> Bureau is large enough to handle<br />
any <strong>Supply</strong> <strong>Chain</strong> and <strong>Logistics</strong> problem, but small enough to provide exceptional<br />
service.<br />
LOGISTICS BUREAU RESOURCES<br />
The <strong>Logistics</strong> Bureau Group has now completed well over 1,000 customer projects<br />
across 18 countries in our region, with most major industry groups being represented<br />
in the customer base.<br />
LOGISTICS BUREAU GROUP<br />
The <strong>Logistics</strong> Bureau Group continues to expand in terms <strong>of</strong> services and geographic<br />
reach, with new <strong>of</strong>fices planned in Vietnam.<br />
The Group now comprises <strong>Logistics</strong> Bureau, <strong>Logistics</strong> Bureau Asia and Benchmarking<br />
Success.<br />
Keep an eye on Benchmarking Success as it brings a range <strong>of</strong> new services to the<br />
market in 2010/2011 as well as expanding its overseas services.<br />
SUPPLY CHAIN STRATEGY<br />
Business rationalisation (M&A)<br />
Channel strategy<br />
Regional planning<br />
<strong>Supply</strong> chain synchronisation<br />
Strategy alignment<br />
Due diligence<br />
Sustainability<br />
SUPPLY CHAIN TACTICS<br />
Business integration<br />
Outsource/insource/<strong>of</strong>fshore/onshore<br />
Asset deployment<br />
Technology evaluation<br />
Infrastructure development<br />
Retail/supplier alignment<br />
Customer service and CPFR<br />
Transport contract negotiation<br />
SUPPLY CHAIN OPERATIONS<br />
Sourcing/Procrurement<br />
Sales & operations planning<br />
Facility design<br />
DC process improvement<br />
Fleet utilisation<br />
Integration/contract implementation<br />
Technology implementation<br />
Training<br />
SUPPLY CHAIN OPTIMISATION<br />
Cost to serve<br />
Time to serve<br />
Distribution network design<br />
Functional audits<br />
Customer contribution analysis<br />
<strong>Supply</strong> <strong>Chain</strong> audit<br />
Benchmarking<br />
SUPPLY CHAIN EXECUTION<br />
Project management<br />
RESEARCH<br />
Market research services<br />
www.laa.asn.au 6
S u p p l y C h a i n R e p o r t 2 0 1 0<br />
Section A: Economic Update<br />
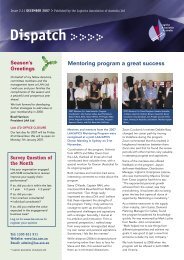
World’s GDP Growth<br />
• GDP figures estimated by the IMF show the first upward<br />
growth in most parts <strong>of</strong> the world in 2010, reversing the<br />
downward trend shown in 2008 and 2009.<br />
• World economy growth was estimated at 4.8% in 2010, up<br />
from a bottom <strong>of</strong> -0.6% in 2009.<br />
• The annual growth is expected to continue at a similar pace in<br />
2011 and 2012.<br />
*Asean 5 comprises Indonesia, Thailand, Phillipines, Malaysia and Vietnam.<br />
Source: International Monetary Fund [14]<br />
Percent<br />
15.0<br />
13.0<br />
11.0<br />
9.0<br />
7.0<br />
5.0<br />
3.0<br />
1.0<br />
-1.0<br />
-3.0<br />
-5.0<br />
China<br />
India<br />
Asean-5*<br />
<strong>Australia</strong><br />
Euro area<br />
US<br />
World<br />
World and Selected Countries’ GDP Growth<br />
China<br />
India<br />
Asean-5*<br />
World<br />
<strong>Australia</strong><br />
Euro area<br />
US<br />
Calendar Year<br />
2007 2008 2009 2010e 2011e 2012e<br />
14.2 9.6 9.1 10.5 9.6 9.5<br />
9.9 6.4 5.7 9.7 8.4 8.0<br />
6.3 4.7 1.7 6.6 5.4 5.6<br />
4.8 2.2 1.2 3.0 3.5 3.5<br />
1.9 0.0 -2.6 2.6 2.3 3.0<br />
2.9 0.5 -4.1 1.7 1.5 1.8<br />
5.3 2.8 -0.6 4.8 4.2 4.5<br />
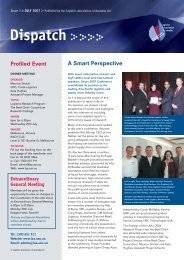
<strong>Australia</strong>’s GDP Growth<br />
• <strong>Australia</strong> experienced a quarter-on-quarter growth <strong>of</strong> between<br />
0.3-1.2% during the financial year 2009-2010, according to the<br />
national accounts data.<br />
• In terms <strong>of</strong> annual percentage change (change between June<br />
Quarter 2009 and June Quarter 2010), the <strong>Australia</strong>n economy<br />
advanced 3.3%.<br />
Percentage <strong>of</strong> <strong>Australia</strong>’s Gross Domestic Product (GDP) Growth<br />
Quarter-on-Quarter from Quarter 4, 2007 to Quarter 2, 2009.<br />
1.5%<br />
1.0%<br />
0.5%<br />
Percentage <strong>of</strong> <strong>Australia</strong>’s GDP Growth (Quarter-on-Quarter)<br />
0.0%<br />
-0.5%<br />
Jun 08 Sep 08 Dec 08 Mar 09 Jun 09 Sep 09 Dec 09 Mar 10 Jun 10<br />
-1.0%<br />
Jun 08<br />
Sep 08<br />
Dec 08<br />
Mar 09<br />
Jun 09<br />
Sep 09<br />
Dec 09<br />
Mar 10<br />
Jun 10<br />
Growth<br />
0.2%<br />
0.4%<br />
-0.7%<br />
0.7%<br />
0.5%<br />
0.3%<br />
1.0%<br />
0.7%<br />
1.2%<br />
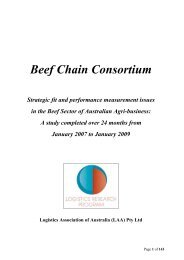
Percentage <strong>of</strong> <strong>Australia</strong>’s Gross Domestic Product (GDP) Growth<br />
from Financial Year 2004-05 to 2009-10<br />
6.0%<br />
Percentage <strong>of</strong> <strong>Australia</strong>’s GDP Growth (2005-2010)<br />
5.0%<br />
4.0%<br />
3.0%<br />
2.0%<br />
1.0%<br />
0.0%<br />
2004/2005<br />
2005/2006<br />
2006/2007<br />
2007/2008<br />
2008/2009<br />
2009/2010<br />
GDP<br />
3.0%<br />
2.6%<br />
5.5%<br />
2.3%<br />
0.9%<br />
3.3%<br />
Source: ABS [1,2]<br />
www.laa.asn.au 7
S u p p l y C h a i n R e p o r t 2 0 1 0<br />
<strong>Australia</strong>’s GDP Growth by Sector<br />
• The major industries which contributed to <strong>Australia</strong>’s economy were the<br />
Finance (10.80%) and Manufacturing Industries (9.21%).<br />
• Transport and Storage is a significant industry, contributing 5.39% to the<br />
country’s GDP in 2009-2010.<br />
• It is widely recognised that the actual contribution <strong>of</strong> the transport and<br />
storage industry is far greater than that recorded here.<br />
• The industry is estimated to generate approximately a 14.5% share <strong>of</strong> the<br />
country’s GDP if in-house operations are counted.<br />
• Because <strong>of</strong> data unavailability, the report will mostly focus on the direct<br />
activities <strong>of</strong> the industry.<br />
GDP Contribution by Various Industry Sectors<br />
(Jul 09 to Jun 10)<br />
Industry Sector<br />
% Contribution<br />
Finance<br />
Manufacturing<br />
Construction<br />
Mining<br />
Health<br />
Transport and Storage<br />
Public Admin<br />
Wholesale<br />
Retail<br />
Education<br />
Real Estate<br />
Agriculture<br />
Electricity, Gas, Water <strong>Supply</strong><br />
Accom Cafe Restaurant<br />
Others & Statistical Discrepancies<br />
Total<br />
9.95%<br />
8.49%<br />
6.98%<br />
6.85%<br />
5.82%<br />
4.97%<br />
4.97%<br />
4.54%<br />
4.50%<br />
4.06%<br />
3.05%<br />
2.54%<br />
2.40%<br />
2.12%<br />
28.75%<br />
100%<br />
Source: ABS [1]<br />
Contribution <strong>of</strong> Transportation and Storage Sector to <strong>Australia</strong>’s GDP<br />
• Over the years, the percentage contribution <strong>of</strong><br />
Transportation and Storage Industry to the country’s GDP<br />
remains steady at approximately 5 per cent.<br />
• The industry generated more than $60 billion to the<br />
<strong>Australia</strong>n economy in 2009-10.<br />
Period<br />
2000/2001<br />
2001/2002<br />
2002/2003<br />
2003/2004<br />
2004/2005<br />
2005/2006<br />
2006/2007<br />
2007/2008<br />
2008/2009<br />
2009/2010<br />
Contribution <strong>of</strong> Transport and Storage Sector to<br />
<strong>Australia</strong>’s GDP (10 Years to 2009-10)<br />
Transport and<br />
Storage Gross<br />
Value Added ($b)<br />
43.7<br />
45.1<br />
47.8<br />
49.4<br />
52.3<br />
53.9<br />
57.0<br />
60.1<br />
59.5<br />
60.8<br />
GDP ($b)<br />
928.5<br />
964.1<br />
994.6<br />
1035.8<br />
1065.2<br />
1097.9<br />
1139.3<br />
1181.8<br />
1195.7<br />
1223.5<br />
% Contribution <strong>of</strong><br />
Transport and<br />
Storage to GDP<br />
4.71%<br />
4.68%<br />
4.81%<br />
4.77%<br />
4.91%<br />
4.91%<br />
5.00%<br />
5.08%<br />
4.98%<br />
4.97%<br />
Source: ABS [1]<br />
Change <strong>of</strong> Gross Product by Sector<br />
• The figure shows the percentage change <strong>of</strong> gross<br />
product by different industry sectors between June<br />
Quarter 2009 and June Quarter 2010.<br />
• As mentioned previously, the <strong>Australia</strong>n economy<br />
advanced 3.3% during the period.<br />
• Health, Manufacturing, Transportation and<br />
Storage, Construction, Real Estate, Mining and<br />
Finance industries grew above the average<br />
while Wholesale, Retail, Accommodation, Café,<br />
Restaurant, Utility <strong>Supply</strong> and Other Industries<br />
advanced below the average growth level.<br />
15.0%<br />
10.0%<br />
5.0%<br />
0.0%<br />
-5.0%<br />
Change <strong>of</strong> Gross Value Added (GVA) Product between<br />
June Quarter 2009 and June Quarter 2010 by Sector<br />
Percentage Change <strong>of</strong> Gross Products between Qtr2 2010 and Qtr 2 2009 by Sector<br />
Construction, 9.4%<br />
Manufacturing, 5.6% Mining, 5.2%<br />
Health, 4.1% Real Estate, 3.8%<br />
Transport and<br />
Storage, 3.7%<br />
Finance, 3.9%<br />
Education, 2.0%<br />
Other, 2.9% Agriculture, 3.0% Wholesale, 2.5%<br />
Electricity, Gas, Water<br />
<strong>Supply</strong>, 1.6% Retail, 1.0%<br />
Public Admin, -1.6%<br />
Accom, Cafe,<br />
Restaurant, -3.4%<br />
All Industry Growth<br />
2009-10, 3.3%<br />
-10.0%<br />
Source: ABS [1,2]<br />
www.laa.asn.au 8
S u p p l y C h a i n R e p o r t 2 0 1 0<br />
Breakdown <strong>of</strong> Gross Product in Transport and Storage Industry<br />
• Service and Storage remains the largest contributor to the<br />
overall industry, having a 46.5% share <strong>of</strong> the industry gross<br />
product.<br />
Gross Product Generated by Industry Sub-Sector<br />
Gross Product Generated by Different Sectors in Transport<br />
• Road Transport is the second largest contributor, generating<br />
30.4% <strong>of</strong> the total industry gross product.<br />
• Contribution <strong>of</strong> Rail and Pipeline sector and Air Transport<br />
Sector to gross product in 2009-2010 were at 13.2% and<br />
9.9% respectively.<br />
100.0%<br />
90.0%<br />
80.0%<br />
70.0%<br />
60.0%<br />
50.0%<br />
40.0%<br />
30.0%<br />
Service and<br />
Storage, 46.4%<br />
Rail, Pipeline and<br />
other, 13.5%<br />
Air, 10.2%<br />
Service and<br />
Storage, 46.5%<br />
Rail, Pipeline and<br />
other, 13.2%<br />
Air, 9.9%<br />
20.0%<br />
10.0%<br />
Road, 29.9%<br />
Road, 30.4%<br />
0.0%<br />
Jul 08-Jun 09 Jul 09-Jun 10<br />
Source: ABS [1]<br />
Change <strong>of</strong> Gross Product in Transport and Storage Sub-Sectors<br />
• Transportation industry grew 3.7% in 2009-10 after a severe<br />
contraction in 2008-9 <strong>of</strong> -7.5%.<br />
• By focusing closely on the industry sub-sectors, we see that Road,<br />
Air, and Rail, Pipeline and Other sectors have expanded at a higher<br />
rate than the industry average.<br />
• Storage and Services sub-sector, which is the largest sub-sector<br />
within the Transportation industry, grew 2% in 2009-10.<br />
6.0%<br />
4.0%<br />
2.0%<br />
0.0%<br />
Change <strong>of</strong> Gross Product between Year 2009-10<br />
and Year 2008-09 within Transportation Industry<br />
Percent Change <strong>of</strong> Gross Product by Different<br />
Transportation Industry Sub-Sectors<br />
Air, 4.4%<br />
Rail, Pipeline, and<br />
Road, 5.3%<br />
Other, 5.0%<br />
Storage and<br />
Services, 2.0%<br />
-2.0%<br />
-4.0%<br />
-6.0%<br />
Air -5.1%<br />
Rail, Pipeline, and<br />
Other, -1.9%<br />
Storage and<br />
Services, -3.2%<br />
-8.0%<br />
Road, -7.5%<br />
Source: ABS [1,2]<br />
<strong>Australia</strong>’s Labour Force<br />
• The improving economy resulted in an improvement <strong>of</strong><br />
employment figures. Between June 2009 and June 2010,<br />
total employment rose more than 353,000, reducing the<br />
rate <strong>of</strong> unemployment from 5.8 to 5.1%.<br />
• Most jobs were gained in both full-time and part-time<br />
employment, adding to the work force 201,600 F/T<br />
employed persons and 151,700 P/T employed persons.<br />
• These improved figures suggested the outlook was<br />
somehow better than expected. At some point during the<br />
tough period, the Organisation for Economic Cooperation<br />
and Development (OECD) and the federal government<br />
anticipated that <strong>Australia</strong>n unemployment rates would<br />
peak between 7.7-8.5% in 2010.<br />
Labour Force, <strong>Australia</strong>, June 2010<br />
Labour Force <strong>Australia</strong> June 2010 (Seasonally Adjusted)<br />
Employment Change from June 09<br />
June 10 June 09 Person Percent<br />
F/T Employed Persons (’000)<br />
P/T Employed Persons (’000)<br />
Total Employed Persons (’000)<br />
Unemployed Persons (’000)<br />
Unemployment Rate (%)<br />
7,794.7<br />
3,306.0<br />
11,100.7<br />
598.4<br />
5.1%<br />
7,593.1<br />
3,154.3<br />
10,747.4<br />
662.3<br />
5.8%<br />
201.6<br />
151.7<br />
353.3<br />
-63.9<br />
-<br />
2.7%<br />
4.8%<br />
3.3%<br />
-9.6%<br />
0.7 pts<br />
Source: ABS [19]<br />
GDP ($m)<br />
www.laa.asn.au 9
S u p p l y C h a i n R e p o r t 2 0 1 0<br />
<strong>Australia</strong>’s Labour Force by Industry<br />
• While employment in almost every industry sector<br />
increased, the employment in Manufacturing and<br />
Transport and Storage industries weakened slightly.<br />
• The number <strong>of</strong> persons employed in Transport and<br />
Storage dropped from 579,000 to 571,000, a 1.4%<br />
decrease from the previous quarter.<br />
• This figure reflects only the direct employment within<br />
the industry.<br />
Note: Detailed Labour Force <strong>Australia</strong> is released<br />
Quarterly by ABS.<br />
Area<br />
Healthcare<br />
Retail<br />
Construction<br />
Manufacturing<br />
Education<br />
Pr<strong>of</strong>essional, Scientific<br />
Accom, Cafe, Restaurant<br />
Public Administrative<br />
Transport and Storage<br />
Wholesale<br />
Agriculture<br />
Others<br />
A Comparison <strong>of</strong> Employment by Industry between<br />
August Quarter 2010 and August Quarter 2009<br />
Share <strong>of</strong> Employment by Industry<br />
August 2010<br />
(‘000) Person Percent<br />
1,273<br />
11.3%<br />
1,218<br />
10.8%<br />
1,014<br />
9.0%<br />
999<br />
8.9%<br />
871<br />
7.8%<br />
856<br />
7.6%<br />
733<br />
6.5%<br />
701<br />
6.2%<br />
571<br />
5.1%<br />
419<br />
3.7%<br />
377<br />
3.4%<br />
2,199<br />
19.6%<br />
August 2009<br />
(‘000) Person Percent<br />
1,229<br />
11.3%<br />
1,183<br />
10.9%<br />
996<br />
9.2%<br />
1,028<br />
9.4%<br />
815<br />
7.5%<br />
789<br />
7.3%<br />
711<br />
6.5%<br />
646<br />
5.9%<br />
579<br />
5.3%<br />
413<br />
3.8%<br />
366<br />
3.4%<br />
2,129<br />
19.6%<br />
Total<br />
11,231<br />
100.0%<br />
10,886<br />
100.0%<br />
Source: ABS [19]<br />
Inflation<br />
• The annual rate <strong>of</strong> inflation rose slightly to 3.1% in June 2010.<br />
A similar level was recorded for the Transportation Price Index<br />
at 3.2% in the same period. ABS [6,7]<br />
• It is clear that the transportation price index is heavily driven<br />
by the fuel price and it influences the price index <strong>of</strong> almost all<br />
product groups.<br />
10.00%<br />
8.00%<br />
6.00%<br />
Percentage Change <strong>of</strong> Consumer Price Index<br />
June Quarter 2010 vs. June Quarter 2009<br />
Percentage Change <strong>of</strong> Consumer Price Index from June Quarter 2009<br />
to June Quarter 2010 for All Groups and Transport Group<br />
4.00%<br />
2.00%<br />
0.00%<br />
GDP ($m)<br />
-2.00%<br />
-4.00%<br />
-6.00%<br />
All Groups<br />
Transport<br />
-8.00%<br />
All Groups<br />
Transport<br />
Mar<br />
08<br />
4.2%<br />
6.8%<br />
Source: ABS [6,7]<br />
Jun<br />
08<br />
4.5%<br />
6.9%<br />
Sep<br />
08<br />
5.0%<br />
8.7%<br />
Dec<br />
08<br />
3.7%<br />
-1.2%<br />
Mar<br />
09<br />
2.5%<br />
-4.6%<br />
Jun<br />
09<br />
1.5%<br />
-5.9%<br />
Sep<br />
09<br />
1.3%<br />
-5.1%<br />
Dec<br />
09<br />
2.1%<br />
1.2%<br />
Mar<br />
10<br />
2.9%<br />
4.1%<br />
Jun<br />
10<br />
3.1%<br />
3.2%<br />
Contribution to Annual Inflation by Product Group<br />
• The price rise in Alcohol and Tobacco, Housing, Education and Health product/<br />
Service groups has contributed to the change in annual inflation in 2009-10.<br />
• More specifically, last year we witnessed a higher price <strong>of</strong> tobacco, hospital and<br />
medical services, and automotive fuel.<br />
• For this period, a price fall was recorded in Domestic Travel Accommodation,<br />
Computing Equipment, and Fruit and Vegetables. ABS[6]<br />
Contribution to Annual Inflation by Product Group<br />
All Groups<br />
Financial and Insurance services<br />
3.1%<br />
3.9%<br />
Education<br />
5.7%<br />
Recreation -0.6%<br />
Communication -0.2%<br />
Transportation<br />
Health<br />
3.2%<br />
5.0%<br />
Household contects and services<br />
0.2%<br />
Housing<br />
5.8%<br />
Clothing and footwear<br />
-3.8%<br />
Alcohol and tobacco<br />
8.7%<br />
Food<br />
1.4%<br />
Source: ABS [6,7]<br />
www.laa.asn.au 10
Jul 07<br />
Sep 07<br />
Nov 07<br />
Jan 08<br />
Mar 08<br />
May 08<br />
Jul 08<br />
Sep 08<br />
Nov 08<br />
Jan 09<br />
Mar 09<br />
May 09<br />
Jul 09<br />
Sep 09<br />
Nov 09<br />
Jan 10<br />
Mar 10<br />
May 10<br />
S u p p l y C h a i n R e p o r t 2 0 1 0<br />
<strong>Australia</strong>’s Freight Volume<br />
• At the time the report was written, freight volume data availability was limited, especially for international air freight<br />
and domestic freight.<br />
• In the area <strong>of</strong> international freight, we observe:<br />
- The international trade accounts<br />
- Available data on international sea freight; and<br />
- Container throughput at <strong>Australia</strong>n major ports.<br />
• In the area <strong>of</strong> domestic freight, we look at:<br />
- BITRE’s road freight task estimation; and<br />
- BITRE’s interstate freight task estimation.<br />
<strong>Australia</strong>’s International Trade Account (Excluding Services)<br />
• In 2009-10, goods value <strong>of</strong> both export and import trades<br />
fell almost 10% from the previous 12 months.<br />
• When considering monthly trade accounts, trade value<br />
started falling around the third quarter <strong>of</strong> 2008 and began to<br />
recover in the second quarter <strong>of</strong> 2010.<br />
• We expect that international sea freight and air freight<br />
volume would follow the trend and appears in the international<br />
trade account.<br />
<strong>Australia</strong>’s International Trade Account<br />
(Goods Only) 10 Years to 2009/2010<br />
International Trade Account Balance on Goods<br />
(Service Excluded)<br />
2009-2010<br />
Year<br />
$Billion<br />
30.0<br />
25.0<br />
20.0<br />
15.0<br />
10.0<br />
5.0<br />
0.0<br />
-5.0<br />
-10.0<br />
-15.0<br />
-20.0<br />
-25.0<br />
Monthly International Trade Account (Goods Only) 2007-2010<br />
Goods Credit<br />
Goods Debit<br />
2008-2009<br />
2007-2008*<br />
2006-2007<br />
2005-2006<br />
2004-2005<br />
2003-2004<br />
2002-2003<br />
Debit (Export)<br />
2001-2002<br />
Credit (Export)<br />
2000-2001<br />
-300 -200 -100 0 100 200 300<br />
$Billion<br />
Source: ABS [10]<br />
www.laa.asn.au 11
S u p p l y C h a i n R e p o r t 2 0 1 0<br />
International Sea Freight: Volume and Value<br />
• Total sea freight volume went up from 789.6 million<br />
tonnes in 2007-08 to 834.8 million tonnes in 2008-09.<br />
• There was a slight decline in import volume, down<br />
from 83.8 million tonnes to 81.6 million tonnes.<br />
• The export volume however rose 7% from the<br />
previous year to 753.2 million tonnes, generating a<br />
huge surplus in term <strong>of</strong> goods export value ($202.3<br />
billion).<br />
• The increase in export is driven mostly by bulk freight<br />
products such as coal, coke and briquettes.<br />
• International sea freight volume shown here<br />
appears to conform with the trend presented in the<br />
international account.<br />
MT<br />
900.0<br />
800.0<br />
700.0<br />
600.0<br />
500.0<br />
400.0<br />
300.0<br />
200.0<br />
100.0<br />
0.00<br />
$Billion<br />
400.0<br />
350.0<br />
300.0<br />
250.0<br />
200.0<br />
150.0<br />
100.0<br />
50.0<br />
0.0<br />
2007-08<br />
Import<br />
International Sea Freight Volume and Value<br />
(2007-2008, 2008-2009)<br />
International Sea Freight Volume (Million Tonnes)<br />
705.8 789.6 753.2 834.8<br />
83.8 81.6<br />
2007-08<br />
Import<br />
2007-08<br />
Export<br />
2007-08<br />
Export<br />
2007-08<br />
Total<br />
2007-08<br />
Total<br />
2008-09<br />
Import<br />
International Sea Freight Value ($Billion)<br />
2008-09<br />
Import<br />
2008-09<br />
Export<br />
2008-09<br />
Export<br />
2008-09<br />
Total<br />
152.5 303.3 202.3 368.3<br />
150.8 166.0<br />
2008-09<br />
Total<br />
Source: BITRE [13]<br />
Container Throughput at <strong>Australia</strong>n Ports<br />
• At the ports, the container throughput dropped in<br />
2008-09 then increased in 2009-10.<br />
• Port Botany in Sydney container throughput was up<br />
8.1% to more than 1.9 million containers.<br />
• At the Port <strong>of</strong> Melbourne, the volume was up 3.6%.<br />
The port is handling more than 2.2 million containers<br />
per year.<br />
• The container throughput at these 4 major ports<br />
represented approximately 90% <strong>of</strong> total containerised<br />
sea freight at all <strong>Australia</strong>n ports.<br />
TEUs<br />
2,500,000<br />
2,000,000<br />
1,500,000<br />
1,000,000<br />
500,000<br />
Port Throughput at <strong>Australia</strong>n Four Major Ports<br />
2007-10 (Total TEUs)<br />
Container Throughput at <strong>Australia</strong>n 4 Major Ports (TEUs)<br />
2007-08<br />
2008-09<br />
2009-10<br />
0<br />
Port <strong>of</strong><br />
Melbourne<br />
Port Botany<br />
Port <strong>of</strong><br />
Brisbane<br />
Port <strong>of</strong><br />
Fremantle<br />
Percent Change <strong>of</strong> Total Container Throughput from the Previous Year<br />
Port <strong>of</strong><br />
Melbourne<br />
Port Botany<br />
Port <strong>of</strong><br />
Brisbane<br />
Port <strong>of</strong><br />
Fremantle<br />
2008-09<br />
-4.4%<br />
0.2%<br />
-5.4%<br />
-1.9%<br />
2009-10<br />
3.6%<br />
8.1%<br />
2.9%<br />
-2.2%<br />
Source: Maritime Union <strong>of</strong> <strong>Australia</strong> [29]<br />
www.laa.asn.au 12
2000-01<br />
2001-02<br />
2002-03<br />
2003-04<br />
2004-05<br />
2005-06<br />
2006-07<br />
2007-08<br />
2008-09<br />
2009-10<br />
2010-11<br />
2011-12<br />
2012-13<br />
2013-14<br />
2014-15<br />
2015-16<br />
2016-17<br />
2017-18<br />
2018-19<br />
2019-20<br />
2000-01<br />
2001-02<br />
2002-03<br />
2003-04<br />
2004-05<br />
2005-06<br />
2006-07<br />
2007-08<br />
2008-09<br />
2009-10<br />
2010-11<br />
2011-12<br />
2012-13<br />
2013-14<br />
2014-15<br />
2015-16<br />
2016-17<br />
2017-18<br />
2018-19<br />
2019-20<br />
S u p p l y C h a i n R e p o r t 2 0 1 0<br />
Domestic Freight Task<br />
• Road freight task growth is expected to remain<br />
flat at about 190 billion tonne kilometres between<br />
2008 to 2010 according to BITRE’s estimation,<br />
which factored in an impact from the economic<br />
downturn.<br />
• Over the long term to 2020, road freight task is<br />
estimated to grow about 3.7% year-on-year. Road<br />
freight task in 2020 is expected to be 40% higher<br />
than the current level. BITRE [9]<br />
• BITRE estimated that interstate freight task in<br />
<strong>Australia</strong> is at 108.9 billion tonne kilometres in<br />
2010, up slightly from the earlier year.<br />
Billion Tonnes Km<br />
280.0<br />
260.0<br />
240.0<br />
220.0<br />
200.0<br />
180.0<br />
160.0<br />
140.0<br />
120.0<br />
100.0<br />
Domestic Freight Task<br />
Road Freight Task (Actual and Forecast)<br />
Road Freight Task Actual<br />
Road Freight Task Estimate<br />
Year<br />
• The estimation suggests that interstate freight<br />
task will grow approximately 4.6% year-on-year<br />
to 2020. By this time interstate freight task is<br />
expected to be 58% up from 2010.<br />
Billion Tonnes Km<br />
200.0<br />
180.0<br />
160.0<br />
140.0<br />
120.0<br />
100.0<br />
80.0<br />
60.0<br />
40.0<br />
20.0<br />
0.0<br />
Interstate Freight Task All Modes (Coastal, Rail and Road)<br />
Interstate Freight Task Actual<br />
Interstate Freight Task Estimate<br />
Year<br />
Source: BITRE [8,9]<br />
Transport and Warehousing Cost<br />
• Total costs <strong>of</strong> transport and warehousing business are mainly<br />
influenced by fuel cost, wages, depreciation and rent, leaving<br />
5.6% <strong>of</strong> pr<strong>of</strong>it on average. IBISWorld [11].<br />
Cost Structure (Transport and Storage Industry)<br />
Cost Structure <strong>of</strong> the Transport and Storage Industry 2009-10<br />
.<br />
24.8%<br />
6.1%<br />
6.1%<br />
13.9%<br />
5.6%<br />
43.3%<br />
100.0%<br />
Purchase Wages Depreciation<br />
Rent<br />
Utilities,<br />
Interest,<br />
Other<br />
Total<br />
Pr<strong>of</strong>it<br />
Source: IBISWorld [11]<br />
www.laa.asn.au 13
S u p p l y C h a i n R e p o r t 2 0 1 0<br />
Labour Cost<br />
• Labour cost in the Transport and Storage sector increased by<br />
3.2% in 2009-10.<br />
• The rate <strong>of</strong> increase was similar to the country’s average rise<br />
across all sectors <strong>of</strong> 3.1%.<br />
• The 2009-10 annual increase <strong>of</strong> labour cost in Transport and<br />
Storage is the smallest increase in the past 5 years.<br />
Change <strong>of</strong> Labour Price Index<br />
(All Sectors vs. Transport and Storage)<br />
Percentage Change <strong>of</strong> Labour Price Index for All Sectors and Transport Sector<br />
5.0%<br />
4.5%<br />
4.0%<br />
3.5%<br />
3.0%<br />
2.5%<br />
2.0%<br />
1.5%<br />
1.0%<br />
All Sectors<br />
Transport<br />
0.5%<br />
0.0%<br />
2000/<br />
2001<br />
All Sectors<br />
Transport<br />
Source: ABS [30]<br />
3.7%<br />
3.2%<br />
2001/<br />
2002<br />
3.2%<br />
2.4%<br />
2002/<br />
2003<br />
3.5%<br />
3.3%<br />
2003/<br />
2004<br />
3.5%<br />
3.1%<br />
2004/<br />
2005<br />
4.1%<br />
3.2%<br />
2005/<br />
2006<br />
4.2%<br />
4.3%<br />
2006/<br />
2007<br />
4.0%<br />
4.1%<br />
2007/<br />
2008<br />
4.3%<br />
3.9%<br />
2008/<br />
2009<br />
3.7%<br />
4.4%<br />
2009/<br />
2010<br />
3.1%<br />
3.2%<br />
Fuel Cost<br />
• The strengthening sign <strong>of</strong> economic<br />
recovery has gradually added the pressure<br />
on fuel prices.<br />
200.0<br />
Cents<br />
Average Monthly Fuel Price (Unleaded and Diesel)<br />
July 2001 to June 2010<br />
• It is expected that the average fuel price<br />
will trend upwards and remain volatile. The<br />
industry should expect to respond to the<br />
impact <strong>of</strong> an unprecedented rise and fall <strong>of</strong><br />
fuel prices.<br />
• The strength <strong>of</strong> the <strong>Australia</strong>n dollar plays<br />
a role in limiting petrol price increase.<br />
180.0<br />
160.0<br />
140.0<br />
120.0<br />
100.0<br />
80.0<br />
60.0<br />
40.0<br />
Diesel<br />
Unleaded<br />
20.0<br />
0.0<br />
Period<br />
Source: AAA<br />
Jul<br />
-01<br />
Jan<br />
-02<br />
Jul<br />
-02<br />
Jan<br />
-03<br />
Jul<br />
-03<br />
Jan<br />
-04<br />
Jul<br />
-04<br />
Jan<br />
-05<br />
Jul<br />
-05<br />
Jan<br />
-06<br />
Jul<br />
-06<br />
Jan<br />
-07<br />
Jul<br />
-07<br />
Jan<br />
-08<br />
Jul<br />
-08<br />
Jan<br />
-09<br />
Jul<br />
-09<br />
Jan<br />
-10<br />
Jul<br />
-10<br />
Industrial Rental Cost<br />
• During the economic turmoil <strong>of</strong> 2008-2009, we<br />
saw overall demand s<strong>of</strong>ten in almost all areas.<br />
• Average net face rents for industrial markets<br />
remained stable or improved slightly.<br />
• The future <strong>of</strong> industrial rental costs is expected<br />
to stabilise given a positive economic condition.<br />
Area<br />
Perth<br />
Core<br />
North, East, South<br />
Brisbane<br />
Trade Coast<br />
Northside<br />
Southside/Outer South West<br />
Yatala<br />
Industrial Market Indicators (2009-2010)<br />
Rent per Sqm<br />
Prime Secondary<br />
$90-110<br />
$80-100<br />
$115-125<br />
$110-120<br />
$110-115<br />
$110-115<br />
$80-100<br />
$70-90<br />
$80-110<br />
$75-95<br />
$75-105<br />
$70-100<br />
Change <strong>of</strong> Rent<br />
from last period<br />
Remained steady<br />
after a slight decline<br />
in 2008-09<br />
Remained steady<br />
or slightly improve in<br />
some areas after a<br />
moderate decline<br />
in 2008-09<br />
Forecast Rent<br />
(6months)<br />
Adelaide<br />
Inner area<br />
Outer Area<br />
$100-160<br />
$60-100<br />
$50-100<br />
$35-65<br />
Stable<br />
slightly increase<br />
Gold Coast/Northern NSW<br />
$90-110<br />
$80-100<br />
Moderately declined<br />
Sydney<br />
North<br />
South<br />
West/South West<br />
$160-185<br />
$130-150<br />
$95-135<br />
$110-150<br />
$80-110<br />
$70-90<br />
Remained steady<br />
after a slight decline<br />
in 2008-09<br />
Melbourne<br />
Fringe<br />
East/South East<br />
West<br />
North<br />
$130-150<br />
$65-85<br />
$65-70<br />
$65-75<br />
$75-95<br />
$40-70<br />
$42-47<br />
$55-65<br />
Remained steady or<br />
slightly improve in some<br />
areas after a moderate<br />
decline in 2008-09<br />
Source: Colliers International [22,23,24,25,26,27]<br />
www.laa.asn.au 14
2000<br />
2001<br />
2002<br />
2003<br />
2004<br />
2005<br />
2006<br />
2007<br />
2008<br />
2009<br />
2010<br />
2011<br />
2012<br />
2013<br />
2014<br />
2015<br />
2016<br />
2017<br />
2018<br />
2019<br />
2020<br />
S u p p l y C h a i n R e p o r t 2 0 1 0<br />
Section B: Market Update<br />
An Update on Climate Change<br />
Business Response to the Climate Change Issue<br />
• <strong>Australia</strong>n federal and state governments have been<br />
working on policy and legislation to reduce greenhouse gas<br />
emissions since 2002.<br />
• At present, the direction <strong>of</strong> any major legislation is unclear<br />
after the government decided to defer the introduction <strong>of</strong> the<br />
Emission Trading Scheme (ETS) until 2013.<br />
• Despite the uncertainty <strong>of</strong> government speed and directions<br />
around climate change policy and legislation, global<br />
businesses continue to put climate change initiatives on top<br />
<strong>of</strong> their agenda according to the surveys conducted by both<br />
Ernst & Young and PwC [36,32].<br />
Latest Update on <strong>Australia</strong>’a Greenhouse Gas Emission Level<br />
<strong>Australia</strong>’s National Greenhouse Gas Inventory<br />
Category<br />
Annual Emissions through to March<br />
quarter (MillionTon CO2)<br />
% change<br />
in annual<br />
emissions<br />
March quarter 2008 March quarter 2009<br />
National Inventory<br />
Energy: Electricity<br />
Energy: Stationary energy<br />
Energy: Transport<br />
Energy: Fugitive emissions<br />
Industrial processes<br />
Waster<br />
Agriculture<br />
National Inventory Total<br />
200<br />
94<br />
80<br />
38<br />
31<br />
15<br />
90<br />
548<br />
201<br />
94<br />
80<br />
40<br />
31<br />
15<br />
91<br />
552<br />
0.80%<br />
0.20%<br />
-0.50%<br />
5.10%<br />
-0.40%<br />
0.60%<br />
0.50%<br />
0.70%<br />
Source: Departmant <strong>of</strong> Climate Change [31]<br />
• This section highlights the latest change in <strong>Australia</strong>n<br />
Greenhouse Gas Inventory, and reports the current progress<br />
against the target and updates <strong>of</strong> some <strong>of</strong> the industryrelated<br />
initiatives.<br />
National Greenhouse Gas Emission Level<br />
• In the 12 months ending March 2010, <strong>Australia</strong>’s<br />
greenhouse gas emissions declined slightly to approximately<br />
542 million tonnes, or about a 1 per cent reduction from the<br />
previous year.<br />
Greenhouse Gas Emission Reduction Target<br />
Against the Target<br />
• The 532 million tonnes emission recorded in<br />
2010 is a 1.4% decrease from the peak <strong>of</strong> 549<br />
million tonnes in 2008.<br />
• When compared to 2000, the emission level<br />
has increased approximately 9 per cent.<br />
• Over ten years, the government scheme aims<br />
to reduce between 5 to 15% from emission levels<br />
recorded in 2000.<br />
Million Ton CO2<br />
600<br />
500<br />
400<br />
300<br />
200<br />
100<br />
0<br />
<strong>Australia</strong>’s Greenhouse Gas Emission Target<br />
GDP ($m)<br />
Minimum Reduction<br />
Target 5% <strong>of</strong> 2000 level<br />
Ambitious Target, 25%<br />
reduction from 2000 level<br />
Year<br />
• The government also plans to commit to a<br />
more ambitious target <strong>of</strong> 25% reduction if the<br />
450 parts per million CO 2<br />
target is endorsed<br />
by global members.<br />
Source: Departmant <strong>of</strong> Climate Change [31]<br />
www.laa.asn.au 15
S u p p l y C h a i n R e p o r t 2 0 1 0<br />
Industry Initiatives<br />
• This section reports a few examples <strong>of</strong> industry initiatives during 2009-10.<br />
<strong>Logistics</strong> System Review and Sustainable Facility<br />
• Coca Cola Amatil (CCA) has been widely recognised for its sustainability initiative at its Eastern Creek distribution centre (DC) which<br />
opened in late 2009.<br />
• The DC is part <strong>of</strong> the CCA logistics system upgrade which expects to remove 26,000 large truck movements from Sydney roads<br />
annually.<br />
• More than 15% <strong>of</strong> the DC’s energy consumption is supplied by its solar system that produces clean and renewable energy.<br />
• It is estimated that the energy and fuel saving at CCA Eastern Creek distribution centre will result in a reduction <strong>of</strong> greenhouse gas<br />
emissions <strong>of</strong> up to 1000 tonnes per annum.<br />
Waste and Damage Reduction<br />
• After reviewing its transport logistics, Sugar <strong>Australia</strong> has changed the way finished goods are delivered to delivering in containers.<br />
• The initiative resulted in less packaging usage and less damage to finished products.<br />
Fuel Efficiency<br />
• In last year’s report, it was mentioned that the <strong>Australia</strong>n <strong>Logistics</strong> Council, supported by Linfox and Woolworths, launched an<br />
e-learning program named Eco-Drive for Commercial Vehicles, aiming to provide fuel efficiency education. Many corporations<br />
have embraced the initiative in 2009-10, for example CEVA and Cement <strong>Australia</strong> commenced the Eco-Driving Training on their<br />
transportation fleet.<br />
Significant Mergers & Acquisitions – All Sectors<br />
• After a quiet year for M&A during 2008-09, late 2009 looked like a strong period for activity after a very large deal in <strong>Australia</strong> M&A<br />
records was announced for the proposed BHP and Rio Pilbara iron ore joint venture. The proposed deal has a value <strong>of</strong> AUD 116<br />
billion.<br />
• The proposition however was withdrawn in 2010 after objections by different regulators in Japan, Korea, Germany, Europe and<br />
<strong>Australia</strong>.<br />
• Resources, Energy and Mining sectors are still the most active sectors in term <strong>of</strong> M&A deal volume and value in 2009-10.<br />
Significant Mergers and Acquisitions (M&A) Deals<br />
Announced in <strong>Australia</strong> (2009-10)<br />
Large M&A Deals Announced in 2009-10<br />
Year Deal Industry Size ($AU) Status<br />
2009 BHP and Rio Pilbara iron ore joint venture<br />
Resources 116 billion Abandoned<br />
2009 Yanzhou Coal Mining takeover <strong>of</strong> the<br />
<strong>Australia</strong>n coal producer, Felix Resources<br />
Resources 3.5 billion Completed<br />
2010 Newcrest Mining takeover <strong>of</strong>fer for Lihir Gold <strong>of</strong><br />
remaining shares it does not own<br />
Resources 9.5 billion Completed<br />
2010 Singapore Exchange proposed to takeover<br />
<strong>Australia</strong> stock exchange operator, ASX<br />
Investment 8.3 billion Pending<br />
2010 Seven Network and WesTrac merged to create an Investment/<br />
operating and investment group<br />
Resources<br />
3 billion Completed<br />
www.laa.asn.au 16
S u p p l y C h a i n R e p o r t 2 0 1 0<br />
Significant Mergers & Acquisitions – Transport and <strong>Logistics</strong> Sectors<br />
• Few substantial propositions were announced within the sector during 2009-10. The biggest was a proposition by the Canadian<br />
Pension Plan Investment Board, CPPIB, to take over the Transurban Group, which was finally rejected.<br />
• Toll Holdings continued its expansion into different regions by acquiring new businesses as shown in the table.<br />
Recent Mergers and Acquisitions (M&A) in <strong>Australia</strong>’s<br />
Transport and <strong>Logistics</strong> Sectors (2009-10)<br />
Recent M&A deals in Transport and <strong>Logistics</strong> Sector 2009-10<br />
Year Deal Size ($AU) Status<br />
2010 Transurban Group, an Australa’s toll road operator, was proposed to be taken 8 billion Rejected<br />
over by the Canada Pension Plan Investment Board (CPPIB)<br />
2010 Transurban Group bid for Connector Motorways to own the Sydney’s Lane 700 million Pending<br />
Cove tunnel<br />
2010 Port operator China Merchants Group (CMG) acquired Loscam, a leading pallet 676 million Completed<br />
pooling and rental service business in <strong>Australia</strong><br />
2010 CPPIB acquired the Goodman Group’s Kmart distribution centre in Melbourne 60 million<br />
Completed<br />
2009-10<br />
Toll Holdings acquired:<br />
2009 Footwork Express, an express freight services company (Japan)<br />
2009 Express <strong>Logistics</strong> Group (ELG), the freight forwarding companies in NZ<br />
2009 <strong>Logistics</strong> Distribution Systems (LDS), one <strong>of</strong> the leading private<br />
international freight forwarding companies in the United Arab Emirates<br />
2010 Qantas Airway’s Asia Pacific air freight business DPEX Group (Asia)<br />
2010 Summit <strong>Logistics</strong> International (New Jersey)<br />
2010 Concord Park, a privately owned interstate transport company (<strong>Australia</strong>)<br />
2010 WT Sea Air Group and Genesis Forwarding Group, the freight forwarding<br />
companies in UK<br />
95 million<br />
80 million<br />
128 million<br />
Completed<br />
Completed<br />
Completed<br />
Completed<br />
Completed<br />
Completed<br />
Completed<br />
Pending<br />
2010 Brambles has acquired Unitpool, a Swiss-based major independent provider <strong>of</strong> 38 million Completed<br />
pooled containers and pallets used by airlines<br />
<strong>Australia</strong>’s Future Infrastructure<br />
International Gateways & National Freight Network are in<br />
the top priority list for future national infrastructure<br />
• As part <strong>of</strong> the National Infrastructure Priorities declared in<br />
May 2009, the federal government has committed to develop<br />
competitive international gateways and a national freight<br />
network for the country.<br />
Infrastructure funding is managed through the Nation<br />
Building Program<br />
• Auslink Land Transport Funding Program has been replaced<br />
by the Nation Building Program.<br />
National Infrastructure Priorities<br />
• Competitive International Gateways<br />
- To develop more effective ports and<br />
associated land transport systems<br />
• National Freight Network<br />
- To develop rail and road networks so more<br />
freight can be moved efficiently by rail and by<br />
road<br />
Source: Infrastructure <strong>Australia</strong> [35]<br />
• Approximately $37 billion is planned for investments on road and rail infrastructure through the Nation Building Program over the<br />
six-year period between 2008-09 and 2013-14.<br />
• $8.5 billion was allocated to several transportation infrastructure projects during 2009-10.<br />
Infrastructure <strong>Australia</strong> plays a key role in seeking public input and public consultation, and advising the government on<br />
infrastructure needs and priorities for the nation<br />
• During 2009-10, Infrastructure <strong>Australia</strong> called for public input on the National Freight Network Plan.<br />
• Infrastructure <strong>Australia</strong> is seeking public consultation on the National Ports Strategy after receiving several public submissions on the<br />
Proposed National Ports Strategy in early 2010.<br />
www.laa.asn.au 17
S u p p l y C h a i n R e p o r t 2 0 1 0<br />
Significant Rail Infrastructure Upgrade Programs 2010-2011<br />
• Significant rail infrastructure upgrade projects for 2010-2011 are shown below.<br />
WA<br />
• Re-railing the line between Koolyanobbing and Kalgoorlie<br />
and building two new passing loops, to reduce<br />
transit times and delays - $95 million, 11 months.<br />
• Upgrading grain freight network, to improve<br />
grain transport efficiency - $352 million,<br />
48 months.<br />
SA<br />
• Re-railing the lines between Whyalla and Broken Hill<br />
and between Parkes and Broken Hill, to allow both lines<br />
to be used by heavier trains - $312 million, 25 months.<br />
Source: Departmant <strong>of</strong> Infrastructure and Transport [34]<br />
QLD<br />
• Line straightening between Maitland and the<br />
Queensland border, to help reduce transit<br />
times along the eastern seaboard<br />
- $170 million, 14 months.<br />
NSW<br />
• Building three double track passing loops near<br />
Goulburn, Moss Vale and Glenlee, to provide<br />
more overtaking opportunities and reducing<br />
delays - $24 million, 20 months<br />
• Replacing wooden sleepers with new<br />
concrete sleepers on the line between<br />
Parkes and Broken Hill, to improve<br />
capacity, transit time and eliminate the<br />
need for temporary speed restrictions<br />
during summer - $253 million, 13 months<br />
• Complete the detailed planning on the<br />
Moorebank Intermodal Terminal Project in<br />
Sydney’s southwest. The terminal is set<br />
to handle container traffic from interstate rail<br />
freight and Port Botany - $70.7 million,<br />
6 months.<br />
VIC<br />
• Re-railing the line between Albury to Melbourne to Geelong, to reduce transit times<br />
and allow use by heavier trains - $110 million, 13 months.<br />
• Building four new passing loops between Gheringhap and Maroona, to provide trains<br />
with more overtaking opportunities and reduce delays - $32 million, 16 months.<br />
Significant Road Infrastructure Upgrade Programs 2010-2011: SA, ACT and QLD<br />
Below are road projects in South <strong>Australia</strong>, Queensland and the <strong>Australia</strong>n Capital Territory.<br />
SA<br />
Projects commencing in 2010-11<br />
• The South Road Superway in<br />
Adelaide, the second stage <strong>of</strong><br />
the north-south corridor<br />
upgrade, scheduled to be<br />
completed in late 2013 - $812<br />
million, the biggest single<br />
investment in a South <strong>Australia</strong>n<br />
road project.<br />
Projects completing in 2010-11<br />
• The Northern Expressway between<br />
Gawler and Adelaide, opened for traffic in<br />
September 2010 - $564 million.<br />
Source: Departmant <strong>of</strong> Infrastructure and<br />
Transport [34]<br />
ACT<br />
Projects completing in 2010-11<br />
• Tharwa Road/Lanyon Drive<br />
Extension Stage 2 - $19 million.<br />
QLD<br />
Projects commencing in 2010-11<br />
• Bruce Highway - Cardwell Range realignment in<br />
North Queensland, scheduled completion in 2012 -<br />
$115 million.<br />
• Ongoing improvements to the Warrego Highway,<br />
including the upgrade <strong>of</strong> sections <strong>of</strong> the road<br />
between Roma and Mitchell, expected<br />
completion by 2012 - $70 million.<br />
• An upgrade <strong>of</strong> the Bruce Highway across<br />
the Cardwell Range, scheduled completion<br />
in 2012 - $115 million.<br />
• Safety improvement on the Bruce<br />
Highway between Curra to Sarina and<br />
Sarina to Cairns, expected completion<br />
by 2014 - $24 million.<br />
Projects completing in 2010-11<br />
• Upgrade to the Bruce Highway, southern<br />
approaches to Mackay - $57 million.<br />
• Pacific Motorway - Mudgeereba interchange - $47million.<br />
• Pacific Motorway - Coomera Interchange - $31million.<br />
• Pacific Motorway - Varsity Lakes Interchange - $80 million.<br />
www.laa.asn.au 18
S u p p l y C h a i n R e p o r t 2 0 1 0<br />
Significant Road Infrastructure Upgrade Programs 2010-2011: WA, NSW, NT, TAS and VIC<br />
NT<br />
Projects commencing in 2010-11<br />
• A new high level bridge over the Cullen River on the Stuart Highway, expected completion in 2011 - $6 million.<br />
• An improvement <strong>of</strong> flood immunity on the Port Keats Road, scheduled for completion in 2012 - $11 million.<br />
• An upgrade <strong>of</strong> the Central Arnhem Road, scheduled for completion in 2012 - $14 million.<br />
Projects completing in 2010-11<br />
• Stage 2 <strong>of</strong> the Tiger Brennan Drive East Arm Port Access Road - $89 million.<br />
• Upgrade <strong>of</strong> the Buntine Highway – $6.6 million.<br />
• Construction <strong>of</strong> a high level bridge over the McArthur River – $3 million.<br />
• Upgrade <strong>of</strong> the Plenty Highway – $8 million.<br />
WA<br />
Projects commencing in 2010-11<br />
• Dampier Highway stages 2-6<br />
between Balmoral Road West and<br />
Burrup Road, scheduled for completion<br />
in 2012 - $89 million.<br />
• Great Eastern Highway/Roe Highway interchange, scheduled for<br />
completion in 2012 - $110 million.<br />
• Great Northern Highway realignment in Port Hedland, scheduled for<br />
completion in 2014 - $188 million.<br />
• Hepburn Avenue Duplication stage 1 (Shire <strong>of</strong> Wanneroo), scheduled<br />
for completion in 2011 - $3.5 million.<br />
Projects completing in 2010-11<br />
• Mandurah Entrance Road at Mandurah - $155 million.<br />
• Reid Highway/Alexander Drive Interchange - $45 million.<br />
TAS<br />
Projects completing in 2010-11<br />
• Bridgewater Bridge Refurbishment and Lyell-Midland<br />
Highway Junction Upgrade - $14 million.<br />
• Formby Road Redevelopment – $2 million.<br />
• Illawarra Main Road Upgrade - $94 million.<br />
NSW<br />
Projects commencing in 2010-11<br />
• Hunter Expressway scheduled for completion in<br />
2013 - $1.7 billion.<br />
• Pacific Highway, Kempsey Bypass, scheduled for<br />
completion in 2014 - $618 million.<br />
• Pacific Highway, Sapphire to Woolgoolga,<br />
scheduled for completion in 2014 - $610<br />
million.<br />
• Pacific Highway, Devils Pulpit, scheduled for<br />
completion in 2012 - $62 million.<br />
• Hume Highway, Holbrook Bypass,<br />
scheduled for completion in 2012 - $210<br />
million.<br />
Projects continuing in 2010-11<br />
• Hume Highway, Tarcutta Bypass - $290<br />
million.<br />
• Hume Highway, Woomargama Bypass -<br />
$265 million.<br />
• Pacific Highway, Ballina Bypass - $640 million.<br />
• Pacific Highway, Banora Point Upgrade - $310<br />
million.<br />
• Pacific Highway, Bulahdelah Bypass - $300 million.<br />
• Pacific Highway, Glenugie Upgrade - $60 million.<br />
• Great Western Highway, Wentworth Falls East<br />
Upgrade - $132 million.<br />
Projects completing in 2010-11<br />
• NSW Bruxner Highway, Alstonville Bypass - $43 million.<br />
• ACT/NSW Lanyon Drive Extension Stage 2 - $19 million.<br />
VIC<br />
Projects commencing in 2010-11<br />
• Kings Road Interchange (Calder Freeway), scheduled for completion in 2012 -<br />
$60 million.<br />
• Geelong Ring Road 4B, Princes Highway Connection, scheduled for<br />
completion in 2014 - $71 million.<br />
• Duplication <strong>of</strong> the Princes Highway from Waurn Ponds to Winchelsea,<br />
scheduled for completion in 2014 - $220 million.<br />
• Development <strong>of</strong> the Wimmera Intermodal Terminal at Dooen, scheduled for<br />
completion in 2011-12 - $6.5 million.<br />
Source: Departmant <strong>of</strong> Infrastructure and Transport [34]<br />
Projects completing in 2010-11<br />
• Geelong Ring Road 4A, Anglesea Road Connection - $125 million.<br />
• Westgate Bridge Strengthening - $240 million.<br />
www.laa.asn.au 19
S u p p l y C h a i n R e p o r t 2 0 1 0<br />
Significant Infrastructure Upgrade 2010-11: Ports and ICT<br />
Ports<br />
Melbourne Port Expansion<br />
• After the completion <strong>of</strong> the channel deepening project in November 2009, the Victorian government started seeking industry views<br />
and options to meet the future trade volume at the port, which are projected to double by 2020.<br />
• The submission closed in September 2010. The Port <strong>of</strong> Melbourne Authority is preparing advice for the government based on the<br />
analysis <strong>of</strong> these submissions.<br />
Port Botany Expansion<br />
• The Port Botany $1 billion expansion project, which began the planning process in 2001, now progresses into the third year <strong>of</strong><br />
construction.<br />
• The first five berths are expected to be available for trade in 2012.<br />
Darwin Port Expansion<br />
• Federal government has agreed to allocate $50 million to the expansion <strong>of</strong> the Port <strong>of</strong> Darwin.<br />
• The project is expected to commence in 2010-11, and once completed will double the existing capacity and reduce export costs.<br />
National Broadband Network<br />
• The National Broadband Network is the largest infrastructure project the nation has ever undertaken, and is expected to cost $47<br />
billion over eight years.<br />
• The network is the Fibre to the Premises (FTTP), which will deliver an internet speed <strong>of</strong> 100 Mbps to more than 90% <strong>of</strong> households<br />
and businesses.<br />
• The network will be designed, built and operated at the wholesale level by NBN Co Limited, a company established by the<br />
government in 2009.<br />
Latest Status<br />
• A trial roll out was lunched in Tasmanian towns (Smithton, Scottsdale and Midway Point) in August 2010.<br />
• Wholesaler prices have not been set. The price guide given by the Minister is to be around $20–30 per month for an internet-only<br />
service, and $30–35 for internet plus voice services.<br />
• Currently, carriers can access the network at a flat rate <strong>of</strong> $300 per premise.<br />
• A further five trial sites in NSW, VIC, and QLD commenced construction in July 2010.<br />
• An additional 14 trial sites have been announced in all states and the construction will be commenced in Quarter 2 <strong>of</strong> 2011.<br />
[DBCDE,12]<br />
Warehouse Availability and Trends: Demand<br />
• On the demand side, in 2009-10 there<br />
appeared to be concern over the stability<br />
<strong>of</strong> economic recovery.<br />
Warehouse Availability and Trends: Demand<br />
Region 2009-2010 Demand Condition and Outlook Demand<br />
Forecast<br />
• Issues <strong>of</strong> uncertainty in the European and<br />
US markets and the introduction <strong>of</strong> a resource<br />
tax have slowed down decision-making in<br />
businesses.<br />
• It is noted that Kmart has taken the<br />
opportunity to consolidate into one DC<br />
north <strong>of</strong> Melbourne, in order to lower costs.<br />
• Demand is expected to strengthen given<br />
a positive outlook <strong>of</strong> the economy.<br />
Perth<br />
Brisbane<br />
Adelaide<br />
Gold Coast/<br />
Northern NSW<br />
Sydney<br />
• Demand for larger warehouse remains healthy driven by the resource related<br />
sector<br />
• Given the anticipated recovery in economic condition, the planned investment by<br />
resource sector, and the better employment level, demand is likely to improve.<br />
• Demand has overall been improved, although there were times that outlook <strong>of</strong> the<br />
economic recovery were unclear<br />
• Future demand is expected to be firm and tighten in 2010-11 provided the lower<br />
level <strong>of</strong> concern over resource tax issue and stability <strong>of</strong> economic condition<br />
• Demand in 2009-10 has been resilient especially for the smaller space (
S u p p l y C h a i n R e p o r t 2 0 1 0<br />
Warehouse Availability and Trends: <strong>Supply</strong><br />
• <strong>Supply</strong> remained limited in most areas<br />
during 2009-10.<br />
• New developments are expected to be<br />
seen given the less restricted lending conditions<br />
to which investors have begun to adjust.<br />
• It is noted that although the availability <strong>of</strong><br />
secondary warehouses has improved<br />
significantly during the crisis, the case is<br />
not true for high quality and prime location<br />
warehouses.<br />
Perth<br />
Brisbane<br />
Adelaide<br />
Warehouse Availability and Trends: <strong>Supply</strong><br />
Region 2009-2010 <strong>Supply</strong> Condition and Outlook <strong>Supply</strong><br />
Forecast<br />
• Ongoing lending constraints continued to limit supply in the market<br />
• The market still experienced low level <strong>of</strong> supply stock<br />
• Shortage <strong>of</strong> high quality space is presented in larger warehouse<br />
• Now that the investors have taken time to address the credit issues, it is expected<br />
that they will re-enter the market. Given the stabilised land price, we can expect<br />
not to see less supply<br />
• <strong>Supply</strong> has been quite limited due to a stricter condition impose by financial<br />
institutions. This resulted in a higher cost <strong>of</strong> new developments upfront.<br />
• As investors getting adjusted to the new financial condition, supply is expected to<br />
continue to be less constrained.<br />
• Limited availability <strong>of</strong> land in the prime locations (inner regions) still confined the<br />
development opportunities.<br />
• New developments are expected in the pre-commitment leasing group after<br />
almost 2 year <strong>of</strong> quiet period.<br />
Gold Coast/<br />
Northern NSW<br />
Sydney<br />
Melbourne<br />
• <strong>Supply</strong> level was driven higher in 2009 because many occupier was forced to<br />
liquidate the asset<br />
• However, development activities and new investments are expected to still be<br />
limited due to stricter lending practice <strong>of</strong> the bank.<br />
• Lack <strong>of</strong> high quality property in good locations both for lease and for sale.<br />
• New development activities are very limited due to a stricter condition impose by<br />
financial institutions and the s<strong>of</strong>ten demand<br />
Source: Colliers International [22,23,24,25,26,27]<br />
GDP ($m)<br />
www.laa.asn.au 21
S u p p l y C h a i n R e p o r t 2 0 1 0<br />
Section C: Market Participants<br />
Major Players in Integrated <strong>Logistics</strong><br />
• Integrated <strong>Logistics</strong> is the largest sector within the Transport and Storage<br />
Industry worth approximately AUD 90 billion [IBIS World, 15].<br />
Integrated <strong>Logistics</strong> Market Share<br />
Major Players in Integrated <strong>Logistics</strong><br />
• Integrated <strong>Logistics</strong> contributed more than 50% <strong>of</strong> the industry’s gross<br />
product.<br />
• Significant players in Integrated logistics include Toll Holding, QR National,<br />
Asciano Group and Linfox.<br />
Toll group<br />
• Toll is the number one player in integrated logistics by market share,<br />
generating a total annual revenue <strong>of</strong> more than AUD 6.9 billion in 2009-10,<br />
with approximately AUD 293 million net pr<strong>of</strong>it.<br />
Other 84%<br />
8%<br />
3%<br />
3%<br />
2%<br />
• Toll provides freight services, freight forwarding services, and logistics services<br />
domestically and globally.<br />
QR National<br />
• QR National is <strong>Australia</strong>’s largest rail freight company and the world’s largest<br />
train transporter <strong>of</strong> coal from mine to port for export markets.<br />
• The company has been separated into QR National and Queensland Rail as <strong>of</strong><br />
July 2010.<br />
2009-10 Annual Revenue and Pr<strong>of</strong>it <strong>of</strong><br />
Key Players in Integrated <strong>Logistics</strong><br />
Company<br />
Toll<br />
QR<br />
Asciano<br />
Linfox <strong>Logistics</strong><br />
All Sector (Approx)<br />
Revenue<br />
(Billion)<br />
6.9<br />
2.9<br />
2.9<br />
2.2<br />
90.0<br />
Pr<strong>of</strong>it<br />
(Million)<br />
293<br />
203<br />
310<br />
N/A<br />
• In 2009-10, QR National generated AUD 2.9 billion in revenue. Before<br />
excluding the passenger transport business, the company generated<br />
approximately AUD 4 billion.<br />
Asciano Group<br />
• Asciano Group operates in four segments <strong>of</strong> Coal, Intermodal, Container<br />
Ports, and Auto, Bulk and General. Coal and Intermodal operate under the<br />
Pacific National brand.<br />
• The group generated AUD 2.86 billion in 2009-10.<br />
Linfox<br />
• Linfox is another major player in Integrated <strong>Logistics</strong>, operating approximately<br />
5,000 trucks and 1.8 million m 2 <strong>of</strong> warehouse space.<br />
• Linfox generated more than AUD 2.2 billion <strong>of</strong> revenue in 2009-10 with an<br />
undisclosed pr<strong>of</strong>it.<br />
www.laa.asn.au 22
S u p p l y C h a i n R e p o r t 2 0 1 0<br />
Section D: <strong>Australia</strong>n Industry Performance<br />
International <strong>Logistics</strong> Performance Index<br />
• <strong>Australia</strong>’s <strong>Logistics</strong> Performance ranked<br />
18th <strong>of</strong> 150 countries in 2010, down one<br />
place from the previous ranking in 2007.<br />
• Average LPI is currently at 3.84, up<br />
from 3.79. The scores on each <strong>of</strong> the key<br />
dimensions are displayed in the table.<br />
• It is noted that <strong>Australia</strong> is rated better on<br />
every dimension except Track & Trace.<br />
Source: World Bank [17]<br />
LPI<br />
Rank<br />
1<br />
2<br />
3<br />
4<br />
5<br />
6<br />
7<br />
8<br />
9<br />
10<br />
11<br />
12<br />
13<br />
14<br />
15<br />
16<br />
17<br />
18<br />
19<br />
20<br />
Previous<br />
Rank<br />
3<br />
1<br />
4<br />
2<br />
23<br />
7<br />
6<br />
9<br />
12<br />
16<br />
11<br />
15<br />
8<br />
10<br />
14<br />
13<br />
18<br />
17<br />
5<br />
21<br />
Germany<br />
Singapore<br />
Sweden<br />
Netherlands<br />
Luxembourg<br />
Switzerland<br />
Japan<br />
United Kingdom<br />
Belgium<br />
Norway<br />
Ireland<br />
Finland<br />
Hong Kong, China<br />
Canada<br />
United States<br />
Denmark<br />
France<br />
<strong>Australia</strong><br />
Austria<br />
Taiwan<br />
4.11<br />
4.09<br />
4.08<br />
4.07<br />
3.98<br />
3.97<br />
3.97<br />
3.95<br />
3.94<br />
3.93<br />
3.89<br />
3.89<br />
3.88<br />
3.87<br />
3.86<br />
3.85<br />
3.84<br />
3.84<br />
3.76<br />
3.71<br />
4.00<br />
4.02<br />
3.88<br />
3.98<br />
4.04<br />
3.73<br />
3.79<br />
3.74<br />
3.83<br />
3.86<br />
3.60<br />
3.86<br />
3.83<br />
3.71<br />
3.68<br />
3.58<br />
3.63<br />
3.68<br />
3.49<br />
3.35<br />
4.34<br />
4.22<br />
4.03<br />
4.25<br />
4.06<br />
4.17<br />
4.19<br />
3.95<br />
4.01<br />
4.22<br />
3.76<br />
4.08<br />
4.00<br />
4.03<br />
4.15<br />
3.99<br />
4.00<br />
3.78<br />
3.68<br />
3.62<br />
3.66<br />
3.86<br />
3.83<br />
3.61<br />
3.67<br />
3.32<br />
3.55<br />
3.66<br />
3.31<br />
3.35<br />
3.70<br />
3.41<br />
3.67<br />
3.24<br />
3.21<br />
3.46<br />
3.30<br />
3.78<br />
3.78<br />
3.64<br />
4.14<br />
4.12<br />
4.22<br />
4.15<br />
3.67<br />
4.32<br />
4.00<br />
3.92<br />
4.13<br />
3.85<br />
3.82<br />
3.92<br />
3.83<br />
3.99<br />
3.92<br />
3.83<br />
3.87<br />
3.77<br />
3.70<br />
3.65<br />
Tracking &<br />
Tracing<br />
4.18<br />
4.15<br />
4.22<br />
4.12<br />
3.92<br />
4.27<br />
4.13<br />
4.13<br />
4.22<br />
4.10<br />
4.02<br />
4.09<br />
3.94<br />
4.01<br />
4.17<br />
3.94<br />
4.01<br />
3.87<br />
3.83<br />
4.04<br />
International <strong>Logistics</strong> Performance Index 2010<br />
Country LPI Customs Infrastructure<br />
International <strong>Logistics</strong><br />
Shipments<br />
Competence<br />
Timeliness<br />
4.48<br />
4.23<br />
4.32<br />
4.41<br />
4.58<br />
4.20<br />
4.26<br />
4.37<br />
4.29<br />
4.35<br />
4.47<br />
4.08<br />
4.04<br />
4.41<br />
4.19<br />
4.38<br />
4.37<br />
4.16<br />
4.08<br />
3.95<br />
Total Business Inventory<br />
• The cost <strong>of</strong> Total Business Inventory reduced during 2009 to<br />
about $130 billion in December and came back up slightly to<br />
$134 billion in June 2010 Quarter.<br />
• The significant fall <strong>of</strong> inventory level could be linked to the<br />
reaction <strong>of</strong> businesses to the economic crisis. It is expected<br />
that the level <strong>of</strong> inventory will be higher in 2010-2011 because<br />
<strong>of</strong> an improved economic outlook together with the strength <strong>of</strong><br />
the <strong>Australia</strong>n currency. Total inventory alone cannot provide a<br />
full picture <strong>of</strong> the industry performance.<br />
Total Business Inventory (June 2000 to June 2010)<br />
$m<br />
Inventories (Book Value, Current Prices)<br />
160,000<br />
140,000<br />
120,000<br />
100,000<br />
80,000<br />
60,000<br />
40,000<br />
20,000<br />
0<br />
GDP ($m)<br />
Period<br />
Jun Jun Jun Jun Jun Jun Jun Jun Jun Jun Jun<br />
00 01 02 03 04 05 06 07 08 09 10<br />
Source: ABS [4]<br />
Inventory to Sales Ratio<br />
• In the last report it was noted that the Inventory to Sales ratio<br />
climbed slightly during 2009, which could suggest the delay <strong>of</strong><br />
the industry’s response to declining sales.<br />
• The Inventory to Sales ratio improved again in 2010. Part<br />
<strong>of</strong> the reason could be that business is still cautious about<br />
prospects and avoids building up levels <strong>of</strong> inventory.<br />
• Overall, the Inventory to Sales ratio has continued to improve<br />
over the years due to improved supply chain management<br />
practices.<br />
Ratio<br />
Inventory to Sales Ratio (June 2000 to June 2010)<br />
1.00<br />
0.90<br />
0.80<br />
0.70<br />
0.60<br />
0.50<br />
0.40<br />
0.30<br />
0.20<br />
0.10<br />
Period<br />
0.0<br />
Jun<br />
00<br />
Jun<br />
01<br />
Jun<br />
02<br />
Jun<br />
03<br />
Jun<br />
04<br />
Jun<br />
05<br />
Jun<br />
06<br />
Jun<br />
07<br />
Jun<br />
08<br />
Jun<br />
09<br />
Jun<br />
10<br />
Source: ABS [3]<br />
www.laa.asn.au 23
S u p p l y C h a i n R e p o r t 2 0 1 0<br />
Section E: Employment and Training<br />
Employment Level in Transport and Storage Industry<br />
• The industry shows a long term growth <strong>of</strong><br />
employment over the last decade. Employment<br />
level is up from 467,000 persons in 2000 to 571,000<br />
in 2010.<br />
• This represents an annual growth rate <strong>of</strong> 2.1%.<br />
(’000) Person<br />
700<br />
600<br />
500<br />
Employment Level in the Transport and Storage<br />
Industry between August 2000 to August 2010<br />
Employment Level in Transport Industry (’000) Person<br />
• However, when considering the short term growth,<br />
the employment level was reported to be falling in<br />
2009 after peaking at a workforce <strong>of</strong> approximately<br />
600,000 people early the same year.<br />
400<br />
300<br />
200<br />
100<br />
• The record shows that the employment level did<br />
not fall further in 2010.<br />
• The Department <strong>of</strong> Employment and Workplace<br />
Relations (DEEWR) has predicted that industry<br />
employment will grow in the long term and that<br />
the industry is expected to employ around 640,000<br />
persons in 2014-15. DEEWR [see 5].<br />
0<br />
Aug<br />
00<br />
Aug<br />
01<br />
Person Employed<br />
Year on Year Growth<br />
Source: ABS [37]<br />
Aug<br />
02<br />
Aug<br />
01<br />
467<br />
0.3%<br />
Aug<br />
03<br />
Aug<br />
02<br />
442<br />
-5.2%<br />
Aug<br />
04<br />
Aug<br />
03<br />
465<br />
5.1%<br />
Aug<br />
05<br />
Year<br />
Aug<br />
04<br />
494<br />
6.3%<br />
Aug<br />
06<br />
Aug<br />
05<br />
501<br />
1.5%<br />
Aug<br />
06<br />
509<br />
1.5%<br />
Aug<br />
07<br />
Aug<br />
07<br />
542<br />
6.5%<br />
Aug<br />
08<br />
Aug<br />
08<br />
571<br />
6.5%<br />
Aug<br />
09<br />
Aug<br />
09<br />
579<br />
1.4%<br />
Aug<br />
10<br />
Aug<br />
10<br />
571<br />
-1.4%<br />
Change <strong>of</strong> Job Vacancies in Transport and Storage Industry<br />
• The figure shows the Internet Vacancy rate within<br />
the industry across all skill levels based on a count<br />
<strong>of</strong> online vacancies newly lodged on SEEK,<br />
MyCareer, CareerOne and <strong>Australia</strong>n JobSearch,<br />
recorded by DEEWR [see 5].<br />
• The Internet Vacancy in the industry reported in<br />
February 2010 fell 45% compared to the same<br />
period in 2008.<br />
• A sharp drop in Internet Vacancy is noted in<br />
all states and territories apart from ACT.<br />
5,000<br />
4,500<br />
4,000<br />
3,500<br />
3,000<br />
2,500<br />
2,000<br />
1,500<br />
1,000<br />
500<br />
0<br />
Number <strong>of</strong> Internet Vacancies by State/Territory<br />
February 2008, 2009 and 2010<br />
Total Vacancy<br />
% Change from Feb 08<br />
Feb 08 Feb 09 Feb 10<br />
15,607<br />
N/A<br />
9,449<br />
-39%<br />
8,557<br />
-45%<br />
Feb 08<br />
Feb 09<br />
Feb 10<br />
NSW VIC QLD SA WA TAS NT ACT<br />
Source: DEEWR Industry Internet Vacancy Index (three month moving average) see [5]<br />
www.laa.asn.au 24
S u p p l y C h a i n R e p o r t 2 0 1 0<br />
Employment in Transport and Storage Industry by Gender<br />
• The industry’s workforce remains dominated by<br />
males. The proportion <strong>of</strong> male-to-female<br />
employment has remained virtually unchanged<br />
during the past decade.<br />
• In the August 2010 quarter, male employment<br />
represented approximately 78% <strong>of</strong> the total<br />
workforce.<br />
100%<br />
90%<br />
80%<br />
70%<br />
60%<br />
50%<br />
40%<br />
30%<br />
20%<br />
10%<br />
Workforce by Gender (Quarterly)<br />
August 2000 to August 2010<br />
Transport and Warehouse Workforce by Gender<br />
Percent Female<br />
Percent Male<br />
0%<br />
Aug<br />
00<br />
Aug<br />
01<br />
Aug<br />
02<br />
Aug<br />
03<br />
Aug<br />
04<br />
Aug<br />
05<br />
Aug<br />
06<br />
Aug<br />
07<br />
Aug<br />
08<br />
Aug<br />
09<br />
Aug<br />
10<br />
Source: ABS [28]<br />
Employment in Transport and Storage Industry by Age<br />
• There is growing concern over the high proportion<br />
<strong>of</strong> themature workforce in the industry.<br />
• It is suggested that the proportion <strong>of</strong> the mature<br />
workforce is amongst the highest <strong>of</strong> all industries,<br />
second only to Agriculture, Education and Health<br />
Care. [5]<br />
• The figure illustrates the movement <strong>of</strong> workforce<br />
proportion by age group over the past decade.<br />
• The percentage <strong>of</strong> workforce aged over 45 years<br />
grew from 36% in 2000 to 44% in 2010.<br />
• The <strong>Australia</strong>n Transport Council (ATC) has included<br />
the fact as a key issue when developing a strategic<br />
action plan for National Workforce Planning and Skills. [20]<br />
• The ALC seeks industry collaboration and coordination<br />
to support and act in the identified areas for action.<br />
30%<br />
25%<br />
20%<br />
15%<br />
10%<br />
5%<br />
0%<br />
Source: ABS [37]<br />
Workforce by Age Group<br />
Transport and Warehouse Workforce by Age Group<br />
2000<br />
2005<br />
2010<br />
15-19 20-24 25-34 35-44 45-54 55-59 60-64 65 and<br />
over<br />
Education and Training in <strong>Logistics</strong><br />
• Major channels which provide education and training in <strong>Logistics</strong> remain the same being:<br />
- Universities and Colleges providing qualifications from Bachelor degree to Doctorate. Degrees in the area <strong>of</strong> Operations<br />
Management, <strong>Supply</strong> <strong>Chain</strong> Management and Engineering are being <strong>of</strong>fered at most <strong>of</strong> the universities/colleges.<br />
- In terms <strong>of</strong> vocational studies, TAFE Institutions and Colleges provide short courses, Certificates I-IV and Diplomas in different<br />
areas ranging from purchasing, transport, warehousing, maritime and aviation.<br />
- Training Institutions <strong>of</strong>fer courses (some <strong>of</strong> which are government funded) similar to the certificates and short courses <strong>of</strong>fered by TAFE.<br />
- Several companies in the industry also provide internal development programs, such as the graduate Program or Traineeship -<br />
Program <strong>of</strong>fered by Linfox and DHL.<br />
- Other training channels include: LAA/apics which coordinates a mentoring program and short courses, TLISC which provides<br />
training packages in Transport, <strong>Logistics</strong>, Maritime and Aviation, TDT Victoria which <strong>of</strong>fers cadetship programs related to<br />
Transport, Distribution and <strong>Logistics</strong>, and MGSM and CSIRO which <strong>of</strong>fer executive courses.<br />
• Although it seems that industry provides strong coverage <strong>of</strong> education and training channels, the need to improve integration<br />
between these channels and long term capability requirements is highlighted as a key challenge facing the industry [18].<br />
www.laa.asn.au 25
S u p p l y C h a i n R e p o r t 2 0 1 0<br />
Section F: Regulatory Environment<br />
Nationwide Transportation Regulation Reform – The Development<br />
• In July 2009, the Council <strong>of</strong> <strong>Australia</strong>n Governments agreed<br />
to the Transportation Regulation Reform which forms part <strong>of</strong><br />
the National Partnership Agreement to Deliver a Seamless<br />
National Economy. Three key agendas were proposed as part<br />
<strong>of</strong> the reform which relate to;<br />
1. Heavy Vehicles: a single national system <strong>of</strong> heavy<br />
vehicle regulation, registration and driver licensing;<br />
2. Maritime Safety: a single national system for maritime<br />
safety regulation administered by the <strong>Australia</strong>n Maritime<br />
Safety Authority; and<br />
3. Rail Safety: a national rail safety regulator and a<br />
national rail safety incident investigator.<br />
• The National Transport Commission (NTC) is responsible for<br />
developing the draft <strong>of</strong> the national laws for heavy vehicles and<br />
rail safety [21].<br />
• The formal industry consultation on the draft laws is planned<br />
to take place in the first half <strong>of</strong> 2011.<br />
• It is intended that the agreed national legislation is to be<br />
approved by April 2011.<br />
• The transition is planned to take place during 2011-2012.<br />
• It is expected that these regulators will commence<br />
operation by 1 January 2013.<br />
• The Emission Trading Scheme (ETS) which was planned<br />
to be introduced in 2010, has now been deferred to 2013.<br />
• The ETS scheme was to be based on Pr<strong>of</strong>essor Garnaut’s<br />
Climate Change Review that recommended the<br />
mechanism for the trading scheme.<br />
• In the meantime, the government plans to tackle the<br />
climate change problem through Energy Efficiency [18].<br />
• Queensland will be the host regulator for national heavy vehicles.<br />
• The <strong>Australia</strong>n Maritime Safety Authority to be the national<br />
regulator for maritime safety, responsible for regulating <strong>of</strong> all<br />
commercial shipping in <strong>Australia</strong>n waters.<br />
• The National Rail Safety Regulator will be based in Adelaide.<br />
Source: ATC [33]<br />
The Development<br />
What the Industry might be Expecting to<br />
See in the ETS<br />
• Inclusion <strong>of</strong> Transport in the Emission trading scheme.<br />
• Emission permits being sold by competitive auction, and not<br />
given away freely.<br />
• Permits may be sold at a “low, fixed” price during the transitional<br />
phase.<br />
• Inclusion <strong>of</strong> as many sectors as possible to the scheme for the<br />
purpose <strong>of</strong> spreading the costs across the economy.<br />
• Based on Garnaut’s Climate Change Review recommendations,<br />
commissioned by the government. [16]<br />
Source: ATC [33]<br />
Propose Energy Efficiency Legislations<br />
• Propose Energy Efficiency Legislations<br />
• Introduction <strong>of</strong> an Emission Standard for light vehicles, 190 g/km<br />
by 2015 and 155 g/km by 2024 (current level is 222 g/km).<br />
• Legislation related to energy efficiency standards for electric vehicles<br />
and heavy vehicles is expected.<br />
Voluntary Program<br />
• National Carbon Offset Standard (NCOS) launched in July 2010<br />
- Businesses <strong>of</strong>fering CO 2<br />
-neutral products/services can have the<br />
products/services certified and display NCOS logo<br />
• Other voluntary programs to improve energy efficiency <strong>of</strong> light<br />
and heavy vehicles is expected.<br />
www.laa.asn.au 26
S u p p l y C h a i n R e p o r t 2 0 1 0<br />
References<br />
1. <strong>Australia</strong> Bureau <strong>of</strong> Statistics, <strong>Australia</strong>n National Accounts:<br />
National Income, Expenditure and Product, Catalogue No. 5206.<br />
2010: Canberra.<br />
2. <strong>Australia</strong> Bureau <strong>of</strong> Statistics, Gross Value Added by Industry,<br />
<strong>Chain</strong> volume measures: Time Series Spreadsheet, Table 6, in<br />
<strong>Australia</strong>n National Accounts: National Income, Expenditure and<br />
Product, Catalogue No. 5206. 2010: Canberra.<br />
3. <strong>Australia</strong> Bureau <strong>of</strong> Statistics, Inventories to total sales: Ratio:<br />
Series ID A2302601C, in Time Series Spreadsheet, Table 20.<br />
Selected Analytical Series: Catalogue No. 5206, Editor. 2010:<br />
Canberra.<br />
4. <strong>Australia</strong> Bureau <strong>of</strong> Statistics, Private non-farm inventory<br />
levels - book values: Current prices: Series ID A2302598A, in<br />
Time Series Spreadsheet, Table 20. Selected Analytical Series:<br />
Catalogue No. 5206, Editor. 2010: Canberra.<br />
5. SkillInfo, Employment Outlook for Transport, Postal and<br />
Warehousing. 2010, Department <strong>of</strong> Employment and Workplace<br />
Relation: Canberra.<br />
6. <strong>Australia</strong> Bureau <strong>of</strong> Statistics, Consumer Price Index June<br />
Quarter 2010; All groups; <strong>Australia</strong>: Series ID A2325846C, in<br />
Time Series Spreadsheet, TABLES 1 and 2. CPI: All Groups Index<br />
Numbers and Percentage Changes, Editor. 2010: Canberra.<br />
7. <strong>Australia</strong> Bureau <strong>of</strong> Statistics, Consumer Price Index;<br />
Transportation; <strong>Australia</strong>: Series ID A2326071A, in Time Series<br />
Spreadsheet, TABLES 3 and 4. CPI: Groups Weighted Average<br />
<strong>of</strong> Eight Capital Cities Index Numbers and Percentage Changes,<br />
Editor. 2010: Canberra.<br />
8. Bureau <strong>of</strong> Infrastructure Transport and Regional Economics<br />
(BITRE), Multimodal Interstate Freight in <strong>Australia</strong>, Research<br />
<strong>Report</strong> 120. 2010: Canberra, ACT.<br />
9. Bureau <strong>of</strong> Infrastructure Transport and Regional Economics<br />
(BITRE), Road Freight Estimates and Forecasts in <strong>Australia</strong>:<br />
Interstate, Capital Cities and Rest <strong>of</strong> State, <strong>Report</strong> 121. 2010:<br />
Canberra, ACT.<br />
10. <strong>Australia</strong> Bureau <strong>of</strong> Statistics, International Trade in Goods<br />
and Services, <strong>Australia</strong>, Catalogue No. 5368. 2010: Canberra.<br />
11. Wilson, M., IBISWorld Industry <strong>Report</strong> I:Transport and<br />
Storage in <strong>Australia</strong>, IBISWorld, Editor. 2009.<br />
12. Department <strong>of</strong> Broadband Communications and the Digital<br />
Economy, The Geographical rollout, in http://www.nbn.gov.au/.<br />
2010: Canberra.<br />
13. Bureau <strong>of</strong> Infrastructure Transport and Regional Economics<br />
(BITRE), <strong>Australia</strong>n Sea Freight 2008–09, BITRE, Editor. 2010:<br />
Canberra, ACT.<br />
14. International Monetary Fund [IMF], World Economic Outlook<br />
Database, in World Economic and Financial Surveys,, IMF, Editor.<br />
2010, IMF: Washington DC.<br />
15. IBISWorld, Integrated <strong>Logistics</strong> in <strong>Australia</strong>, in IBISWorld<br />
Industry <strong>Report</strong>. 2009.<br />
16. Garnaut, R., The Garnaut Climate Change Review. 2008,<br />
Cambridge University Press, Melbourne.<br />
17. World Bank, <strong>Logistics</strong> Performance Index (LPI), in<br />
International LPI: ranking. 2010: Washington DC.<br />
18. Department <strong>of</strong> Climate Change and Energy Efficiency, A step<br />
change in <strong>Australia</strong>’s energy efficiency performance, in <strong>Report</strong><br />
and Recommendations <strong>of</strong> the Prime Minister’s Task Group on<br />
Energy Efficiency. 2010: Canberra.<br />
19. <strong>Australia</strong> Bureau <strong>of</strong> Statistics, Labour Force, <strong>Australia</strong>,<br />
Catalogue No. 6202.0. June 2010: Canberra.<br />
20. <strong>Australia</strong>n Transport Council, Strategic Action Plan, in<br />
National Workforce Planning and Skill, BITRE, Editor. 2009:<br />
<strong>Australia</strong>.<br />
21. <strong>Australia</strong>n Government, COAG: Transport regulations to be<br />
streamlined. 2009, Media Release ALP: Canberra.<br />
22. Colliers International, Market Indicators <strong>Report</strong>: Adelaide<br />
Industrial, in Colliers International Market Indicators <strong>Report</strong>, K.<br />
Dean, Editor. Spring 2010: SA.<br />
23. Colliers International, Market Indicators <strong>Report</strong>: Gold Coast/<br />
Northern NSW Industrial, in Colliers International Market<br />
Indicators <strong>Report</strong>, K. Sowry, Editor. Spring 2010: QLD.<br />
24. Colliers International, Market Indicators <strong>Report</strong>: Perth<br />
Industrial, in Colliers International Market Indicators <strong>Report</strong>, Q.<br />
Quach, Editor. Spring 2010: WA.<br />
25. Colliers International, Market Indicators <strong>Report</strong>: Brisbane<br />
Industrial, in Colliers International Market Indicators <strong>Report</strong>, H.<br />
Swanson, Editor. Spring 2010: QLD.<br />
26. Colliers International, Market Indicators <strong>Report</strong>: Sydney<br />
Industrial, in Colliers International Market Indicators <strong>Report</strong>, F.<br />
Spark, Editor. Spring 2010: NSW.<br />
27. Colliers International, Market Indicators <strong>Report</strong>: Melbourne<br />
Industrial, in Colliers International Market Indicators <strong>Report</strong>, A.<br />
Mehrotra, Editor. Spring 2010: VIC.<br />
28. <strong>Australia</strong> Bureau <strong>of</strong> Statistics, Labour Force, <strong>Australia</strong>,<br />
Detailed, Quarterly, Catalogue No. 6291.0.55.003. Aug 2010:<br />
Canberra.<br />
29. Maritime Union <strong>of</strong> <strong>Australia</strong>, <strong>Report</strong> on Container Movements<br />
at Four Key <strong>Australia</strong>n Ports: Issue 4-8, in Ports Update <strong>Report</strong>.<br />
2010: Sydney.<br />
30. <strong>Australia</strong> Bureau <strong>of</strong> Statistics, Labour Price Index, <strong>Australia</strong>,<br />
Catalogue No. 6345. March 2009: Canberra.<br />
31. Department <strong>of</strong> Climate Change: <strong>Australia</strong>n Government,<br />
<strong>Australia</strong>’s national greenhouse accounts, in Quarterly Update <strong>of</strong><br />
<strong>Australia</strong>’s National: Greenhouse Gas Inventory, March Quarter<br />
2010. 2010: Canberra.<br />
32. PricewaterhouseCoopers LLP, 13th Annual Global CEO<br />
Survey. 2010: Alabama.<br />
33. <strong>Australia</strong>n Transportation Council, Latest Communiqué: 24<br />
September 2010. 2010, ALC.<br />
34. Department <strong>of</strong> Infrastructure and Transport, Budget-Infra<br />
01-15/2010, in 2010-11 Budget Media Releases, <strong>Australia</strong>n<br />
Government, Editor. 2010: Canberra.<br />
35. Infrastructure <strong>Australia</strong>, National Infrastructure Priorities:<br />
Infrastructure for an economically, socially, and environmentally<br />
sustainable future, <strong>Australia</strong>n Government, Editor. 2009.<br />
36. Ernst & Young, Action Amid Uncertainty: The business<br />
response to climate change. 2010: London.<br />
www.laa.asn.au 27
1986-2011<br />
<strong>Logistics</strong> <strong>Association</strong> <strong>of</strong> <strong>Australia</strong><br />
Phone: 1300 651 911<br />
Web: www.laa.asn.au<br />
Address: PO Box 1265<br />
Parramatta NSW 2124