LIGO-P030036-00-R - Ligo - Caltech
LIGO-P030036-00-R - Ligo - Caltech
LIGO-P030036-00-R - Ligo - Caltech

Create successful ePaper yourself
Turn your PDF publications into a flip-book with our unique Google optimized e-Paper software.
HARRY, HOUSER, AND STRAIN PHYSICAL REVIEW D 65 082<strong>00</strong>1<br />
TABLE III. Parameters of the signal recycling mirror to simulate<br />
the frequency response of spheres. The transmittance of the<br />
input mirrors was held constant at t 1 2 0.03. The transmittance of<br />
the signal recycling mirror was held constant at t 3 2 0.<strong>00</strong>5. Note that<br />
the resonance frequency of the 1.25 m sphere in 2 was a typographical<br />
error, the value listed here is correct.<br />
Diameter<br />
d sph m<br />
Frequency f 0<br />
Hz<br />
Bandwidth<br />
f / f 0<br />
Phase <br />
3.25 795 0.170 0.2271<br />
2.75 940 0.172 0.1921<br />
2.35 11<strong>00</strong> 0.182 0.1641<br />
2.<strong>00</strong> 1292 0.2<strong>00</strong> 0.1395<br />
1.70 1520 0.225 0.1182<br />
1.45 1782 0.254 0.1<strong>00</strong>5<br />
1.25 2067 0.290 0.08619<br />
1.05 2461 0.330 0.07179<br />
of magnetohydrodynamical effects into the existing numerical<br />
models will have significant consequences on the stability<br />
and subsequent evolution of the post-collapsed object<br />
69.<br />
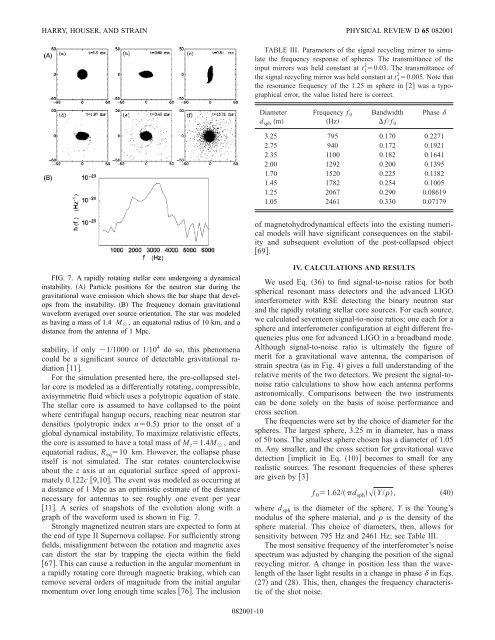
FIG. 7. A rapidly rotating stellar core undergoing a dynamical<br />
instability. A Particle positions for the neutron star during the<br />
gravitational wave emission which shows the bar shape that develops<br />
from the instability. B The frequency domain gravitational<br />
waveform averaged over source orientation. The star was modeled<br />
as having a mass of 1.4 M , an equatorial radius of 10 km, and a<br />
distance from the antenna of 1 Mpc.<br />
stability, if only 1/1<strong>00</strong>0 or 1/10 4 do so, this phenomena<br />
could be a significant source of detectable gravitational radiation<br />
11.<br />
For the simulation presented here, the pre-collapsed stellar<br />
core is modeled as a differentially rotating, compressible,<br />
axisymmetric fluid which uses a polytropic equation of state.<br />
The stellar core is assumed to have collapsed to the point<br />
where centrifugal hangup occurs, reaching near neutron star<br />
densities polytropic index n0.5) prior to the onset of a<br />
global dynamical instability. To maximize relativistic effects,<br />
the core is assumed to have a total mass of M t 1.4M , and<br />
equatorial radius, R eq 10 km. However, the collapse phase<br />
itself is not simulated. The star rotates counterclockwise<br />
about the z axis at an equatorial surface speed of approximately<br />
0.122c 9,10. The event was modeled as occurring at<br />
a distance of 1 Mpc as an optimistic estimate of the distance<br />
necessary for antennas to see roughly one event per year<br />
11. A series of snapshots of the evolution along with a<br />
graph of the waveform used is shown in Fig. 7.<br />
Strongly magnetized neutron stars are expected to form at<br />
the end of type II Supernova collapse. For sufficiently strong<br />
fields, misalignment between the rotation and magnetic axes<br />
can distort the star by trapping the ejecta within the field<br />
67. This can cause a reduction in the angular momentum in<br />
a rapidly rotating core through magnetic braking, which can<br />
remove several orders of magnitude from the initial angular<br />
momentum over long enough time scales 76. The inclusion<br />
IV. CALCULATIONS AND RESULTS<br />
We used Eq. 36 to find signal-to-noise ratios for both<br />
spherical resonant mass detectors and the advanced <strong>LIGO</strong><br />
interferometer with RSE detecting the binary neutron star<br />
and the rapidly rotating stellar core sources. For each source,<br />
we calculated seventeen signal-to-noise ratios; one each for a<br />
sphere and interferometer configuration at eight different frequencies<br />
plus one for advanced <strong>LIGO</strong> in a broadband mode.<br />
Although signal-to-noise ratio is ultimately the figure of<br />
merit for a gravitational wave antenna, the comparison of<br />
strain spectra as in Fig. 4 gives a full understanding of the<br />
relative merits of the two detectors. We present the signal-tonoise<br />
ratio calculations to show how each antenna performs<br />
astronomically. Comparisons between the two instruments<br />
can be done solely on the basis of noise performance and<br />
cross section.<br />
The frequencies were set by the choice of diameter for the<br />
spheres. The largest sphere, 3.25 m in diameter, has a mass<br />
of 50 tons. The smallest sphere chosen has a diameter of 1.05<br />
m. Any smaller, and the cross section for gravitational wave<br />
detection implicit in Eq. 10 becomes to small for any<br />
realistic sources. The resonant frequencies of these spheres<br />
are given by 3<br />
f 0 1.62/d sph Y /,<br />
40<br />
where d sph is the diameter of the sphere, Y is the Young’s<br />
modulus of the sphere material, and is the density of the<br />
sphere material. This choice of diameters, then, allows for<br />
sensitivity between 795 Hz and 2461 Hz; see Table III.<br />
The most sensitive frequency of the interferometer’s noise<br />
spectrum was adjusted by changing the position of the signal<br />
recycling mirror. A change in position less than the wavelength<br />
of the laser light results in a change in phase in Eqs.<br />
27 and 28. This, then, changes the frequency characteristic<br />
of the shot noise.<br />
082<strong>00</strong>1-10