guide to thin section microscopy - Mineralogical Society of America
guide to thin section microscopy - Mineralogical Society of America
guide to thin section microscopy - Mineralogical Society of America

Create successful ePaper yourself
Turn your PDF publications into a flip-book with our unique Google optimized e-Paper software.
GUIDE<br />
TO<br />
THIN SECTION MICROSCOPY<br />
Second Edition<br />
MICHAEL M. RAITH, PETER RAASE<br />
& JÜRGEN REINHARDT<br />
Raith, Raase, & Reinhardt – January – February 2012 2012<br />
ISBN 978-3-00-037671-9 (PDF)<br />
© 2012 by M.M. Raith (University <strong>of</strong> Bonn) , P. Raase (University <strong>of</strong> Kiel), J. Reinhardt (University<br />
<strong>of</strong> KwaZulu-Natal)<br />
All rights reserved. No part <strong>of</strong> this e-book may be reproduced, in any form or by any means, without<br />
the prior written permission <strong>of</strong> the authors.<br />
Mailing and E-Mail addresses:<br />
Pr<strong>of</strong>. Dr. Michael M. Raith, Roidestraße 19, 53359 Rheinbach, Germany. E-Mail: m.raith@uni-bonn.de<br />
Dr. Peter Raase, Steendiek 1, 24220 Schönhorst, Germany. E-Mail: pr@min.uni-kiel.de<br />
Dr. Jürgen Reinhardt, School <strong>of</strong> Agricultural, Earth & Environmental Sciences, Department <strong>of</strong><br />
Geology, University <strong>of</strong> KwaZulu-Natal, Durban 4000, South Africa. E-Mail: reinhardtj@ukzn.ac.za
Guide <strong>to</strong> Thin Section Microscopy<br />
Contents<br />
Contents<br />
Prefaces …………………….…...…………………………………………………………………………………………...………………………………………..……………I-II<br />
Literature………………………………………………………………………………………………………………………………………….………………..……...….……III<br />
Note on nomenclature and abbreviations……………………………………………………………………………………………….......….IV<br />
1. 1 The petrographic microscope:<br />
1.1 Magnifying glass (loupe) and microscope<br />
1.1.1 Imaging by a converging lens (objective)……………..……………………………………………..…....1-2<br />
1.1.2 Magnification with the loupe (ocular, eyepiece)…..…………....................................................……….3<br />
1.1.3 The compound microscope…..…………………………………………………………….………...……....……...…….3-6<br />
1.2 Objectives and oculars<br />
1.2.1 Objective………………..…………………….………………………………………..….…..………………………….......……………..6-8<br />
1.2.2 Ocular..……………………………………………………………………………………………………………………………………….….8-9<br />
Raith, Raase, & Reinhardt – January – February 2012 2012<br />
1.2.3 Tube, objective and ocular……………….…………………………………………………..………......….....…………….10<br />
1.3 Illumination<br />
1.3.1 Aperture <strong>of</strong> illumination....................................................................................................................................................10-11<br />
1.3.2 Light field...........................................................................................................................................................................................................11<br />
1.3.3 Glass diffusers and filters................................................................................................................................................11-13<br />
1.4 Light paths in the microscope<br />
1.4.1 Köhler illumination…………………...................................................………….............................................................................14<br />
1.4.2 Orthoscopic mode………………….....................................................…………................................................................................14<br />
1.4.3 Conoscopic mode………………...............................................….……………..................................................................................15<br />
1.5 Centring the microscope……..…………………………………………............................................................................................15-18<br />
1.6 Polarizer und Analyzer……………….……………………………………………………………………………..…….…...……….18-21<br />
1.7 Trouble-shooting<br />
1.7.1 Optimising the image <strong>of</strong> the specimen….………………………………………..…..........................................22<br />
1.7.2 Eliminating poor illumination………………………………….............................................................................22-23<br />
1.7.3 Sources <strong>of</strong> errors in the crossed-polarizers mode…………………….................................................23<br />
1.7.4 Microscope care and maintenance……………..……………………........................................................................23<br />
2. Measuring angles, lengths and thickness:<br />
2.1 Measurement <strong>of</strong> angles…………..................................................................................................................................................……24-25<br />
2.2 Measurement <strong>of</strong> lenghts……………………………………………………………………….……………….…..….……………...26-27<br />
2.3 Determination <strong>of</strong> <strong>thin</strong> <strong>section</strong> thickness.……………………………………………….………….…..……….…….28-30
Guide <strong>to</strong> Thin Section Microscopy<br />
Contents<br />
3. Morphological properties:<br />
3.1 Grain shape and symmetry……………………………………………………………………...…….….31-39<br />
3.2 Cleavage, fracture, deformation-recrystallization phenomena......................................40-46<br />
3.3 Twinning……….......................................................................................................................................................47-50<br />
3.4 Inclusions, intergrowths, alteration products …………………………….………………..…..51-59<br />
4. Optical properties:<br />
4.1 Some basic principles<br />
4.1.1 Nature <strong>of</strong> light, refraction ………………………………………………………………...……….……………..…....60-62<br />
4.1.2 Isotropy and anisotropy......................................................................................................................................................63-67<br />
4.2 Optical characteristics used for mineral determination<br />
4.2.1 Colour and pleochroism....................................................................................................................................................68-76<br />
4.2.2 Light refraction (relief, chagrin, Becke line)....................................................................................77-79<br />
4.2.3 Double refraction (extinction behaviour, interference colour).............................80-99<br />
4.2.4 Extinction positions in birefringent crystal <strong>section</strong>s ………………………..…….…..100-111<br />
4.2.5 Conoscopic methods (optical character)……………………...............…….....................................112-126<br />
5. Routine mineral determination................................................................................................................................................................................127<br />
Raith, Raase, & Reinhardt – January – February 2012 2012
Guide <strong>to</strong> Thin Section Microscopy<br />
Contents<br />
Preface <strong>to</strong> the Second Edition<br />
The main changes for the second edition concern chapters 1.6 (Polarizer and analyzer), 3.2<br />
(Cleavage, fracture, deformation and recrystallization phenomena), 3.4 (Inclusions, intergrowths,<br />
alteration products) and 4.2.3 (Double refraction). Otherwise, only minor edi<strong>to</strong>rial<br />
modifications have been made, including the replacement <strong>of</strong> some pho<strong>to</strong>micrographs.<br />
Chapter 1.6 has been reorganized <strong>to</strong> describe the necessary checks and adjustment procedures<br />
for the two polarizers step-by-step. Chapter 3.2 has been extended <strong>to</strong> include deformationrelated<br />
features at the grain or <strong>thin</strong> <strong>section</strong> scale, as far as such features can be observed in<br />
the transmitted-light microscope. The text and figures <strong>of</strong> chapter 3.4 have been revised and<br />
extended. Chapter 4.2.3, which includes aspects <strong>of</strong> optical mineralogy that are no<strong>to</strong>riously<br />
difficult <strong>to</strong> grasp for novices, has undergone a major revision. We added more figures and<br />
text that should help <strong>to</strong> understand the physical background <strong>to</strong> some basic optical phenomena<br />
such as retardation and interference colours. Furthermore, the upgrade involves new<br />
calculated interference colour charts, including a previously unpublished ∆n–d chart.<br />
Users <strong>of</strong> this <strong>guide</strong>book will notice that the pho<strong>to</strong>micrographs do not include a scale. Scales<br />
were left out here for two simple reasons: firstly, because the size <strong>of</strong> the <strong>thin</strong> <strong>section</strong> details<br />
shown <strong>to</strong> demonstrate optical or morphological properties is commonly not critical, and<br />
secondly, because we felt that the insertion <strong>of</strong> scales would clutter up the plates without<br />
serving much <strong>of</strong> a purpose. It needs <strong>to</strong> be stressed that scales on pho<strong>to</strong>micrographs attached<br />
<strong>to</strong> any particular mineralogical or petrological study are essential information that must be<br />
generally included.<br />
As explained on page IV, we decided <strong>to</strong> discontinue the use <strong>of</strong> the symbols δ and ∆ for<br />
birefringence and retardation, respectively. We hope those pr<strong>of</strong>essionals who have been<br />
brought up with the “deltas” will forgive us for breaking with this tradition.<br />
Raith, Raase, & Reinhardt – January – February 2012 2012<br />
M.M.R<br />
P.R.<br />
J.R.<br />
February 2012<br />
I
Guide <strong>to</strong> Thin Section Microscopy<br />
Preface<br />
Raith, Raase, & Reinhardt – January – February 2012 2012<br />
Preface <strong>to</strong> the First Edition<br />
The microscopic investigation <strong>of</strong> materials such as minerals, rocks, ores, technical and other<br />
synthetic products in transmitted and reflected light remains one <strong>of</strong> the classic, and <strong>to</strong> this day<br />
indispensable, mineralogical methods <strong>of</strong> analysis. Polarized-light <strong>microscopy</strong> provides a nondestructive<br />
way <strong>to</strong> identify solid substances (whether crystalline or amorphous) with<br />
relatively high spatial resolution, while the phases can be studied wi<strong>thin</strong> their textural<br />
framework. It allows an estimate <strong>of</strong> chemical compositions and provides clues <strong>to</strong> the his<strong>to</strong>ry<br />
<strong>of</strong> formation <strong>of</strong> the material, using specific textural characteristics (structure, fabric, phase<br />
assemblage, phase relationships, reaction textures). Thus, in many respects polarized-light<br />
<strong>microscopy</strong> has distinct advantages over bulk-analytical methods that use sample powders for<br />
phase identification (XRD) or for the analysis <strong>of</strong> chemical composition (XRF, AAS). The<br />
limitations <strong>of</strong> polarized-light <strong>microscopy</strong> are obvious where the chemical composition <strong>of</strong><br />
complex solid solutions has <strong>to</strong> be determined, or where the material is <strong>to</strong>o fine-grained <strong>to</strong><br />
allow the identification <strong>of</strong> single phases. Depending on the specific objectives and the nature<br />
<strong>of</strong> the material <strong>to</strong> be investigated, a modern study in material science will therefore aim <strong>to</strong><br />
combine polarized-light <strong>microscopy</strong> with complementary non-destructive methods <strong>of</strong> high<br />
spatial resolution (EMPA, SEM-EDX, TEM).<br />
There are numerous textbooks that provide detailed accounts <strong>of</strong> the determinative techniques<br />
<strong>of</strong> polarized-light <strong>microscopy</strong> as well as the crystal-optical background for examining<br />
transparent amorphous and crystalline phases (glasses, minerals, synthetic substances).<br />
Hence, there is no need for a comprehensive presentation <strong>of</strong> that material in the following<br />
introduction <strong>to</strong> mineral determination in <strong>thin</strong> <strong>section</strong>. For practical work at the polarized-light<br />
microscope it is sufficient <strong>to</strong> summarise the necessary facts such that even users without an<br />
in-depth knowledge <strong>of</strong> mineralogy can follow the instructions. Fundamentals <strong>of</strong> crystal optics<br />
and crystallography are included only where they are crucial for explaining the observed<br />
optical phenomena and the morphological properties <strong>of</strong> crystals.<br />
The identification <strong>of</strong> minerals under the polarized-light microscope is based on optical and<br />
morphological properties. Books that contain extensive listings <strong>of</strong> such properties provide the<br />
data basis for the vast number <strong>of</strong> natural minerals and synthetic phases (see reference list).<br />
This <strong>guide</strong> is based on a previously published text that has been widely used in the Germanspeaking<br />
world, but is now out <strong>of</strong> print: “Methoden der Dünnschliffmikroskopie” by G.<br />
Müller and M. Raith (Clausthaler Tek<strong>to</strong>nische Hefte, vol.14). We adopted this text <strong>to</strong> a large<br />
degree, revising the figures using modern graphics s<strong>of</strong>tware, and adding many more figures<br />
and pho<strong>to</strong>micrographs <strong>to</strong> illustrate the various phenomena described in the text.<br />
We hope that this <strong>guide</strong> will provide students with the necessary basics <strong>to</strong> master and<br />
successfully apply polarized-light <strong>microscopy</strong>.<br />
Suggestions are always welcome!<br />
January 2011<br />
Michael M. Raith, Peter Raase & Jürgen Reinhardt<br />
II
Guide <strong>to</strong> Thin Section Microscopy<br />
Bibliography<br />
Bibliography<br />
Optical crystallography and techniques in mineralogical and petrographic <strong>microscopy</strong><br />
Bloss, F.D. (1999): Optical Crystallography. <strong>Mineralogical</strong> <strong>Society</strong> <strong>of</strong> <strong>America</strong>,<br />
Washing<strong>to</strong>n, D.C. 239 p.<br />
Dyar M.D., Gunter, M.E. & Tasa, D. (2008): Mineralogy and Optical Mineralogy.<br />
<strong>Mineralogical</strong> <strong>Society</strong> <strong>of</strong> <strong>America</strong>, Chantilly, Va. 708 p.<br />
Ehlers, E.G. (1987): Optical Mineralogy, Vol. 1. Theory and Technique. Blackwell<br />
Scientific Publ., Palo Al<strong>to</strong>. 158 p.<br />
Nesse, W.D. (2003): Introduction <strong>to</strong> Optical Mineralogy (3rd ed.). Oxford University Press,<br />
New York. 348 p.<br />
Phillips, W.R. (1971): Mineral Optics – Principles and Techniques. Freeman and Company,<br />
San Francisco. 249 p.<br />
S<strong>to</strong>iber, R.E. & Morse, S.A. (1994): Crystal identification with the Polarizing Microscope.<br />
Chapman & Hall. 358 p.<br />
Wahlstrom, E.E. (1979): Optical Crystallography (5th ed.). John Wiley & Sons, New York.<br />
488 p.<br />
Mineral determination<br />
Raith, Raase, & Reinhardt – January – February 2012 2012<br />
Deer, W.A., Howie, R.A. & Zussman, J. (1992): An Introduction <strong>to</strong> the Rock-Forming<br />
Minerals (2nd edition). Longman, London. 696 p. *<br />
Ehlers, E.G. (1987): Optical Mineralogy, Vol. 2. Mineral Descriptions. Blackwell Scientific<br />
Publ., Palo Al<strong>to</strong>. 286 p. *<br />
Heinrich, E.W. (1965): Microscopic Identification <strong>of</strong> Minerals. McGraw-Hill, New York.<br />
414 p. *<br />
Kerr, P.F. (1977): Optical Mineralogy (4th ed.). McGraw-Hill, New York. 492 p. *<br />
MacKenzie, W.S. & Adams, A.E. (1994): A Colour Atlas <strong>of</strong> Rocks and Minerals in Thin<br />
Section. Manson Publ. 192 p.<br />
MacKenzie, W.S. & Guilford, C. (1980): Atlas <strong>of</strong> Rock-Forming Minerals in Thin Section.<br />
Longman, London. 98 p.<br />
Nesse, W.D. (2003): Introduction <strong>to</strong> Optical Mineralogy (3rd ed.). Oxford University Press,<br />
New York. 348 p. *<br />
Perkins, D. & Henke, K.R. (2003): Minerals in Thin Section (2nd ed.). Prentice Hall, Upper<br />
Saddle River. 176 p. *<br />
Phillips, W.R. & Griffen, D.T. (1981): Optical Mineralogy. The Nonopaque Minerals. W.H.<br />
Freeman, San Francisco. 677 p. *<br />
Tröger, W.E., Bambauer, H.U., Taborszky, F. & Trochim, H.D. (1979): Optical<br />
Determination <strong>of</strong> Rock-Forming Minerals. Part 1: Determinative Tables.<br />
Schweizerbart, Stuttgart. 188 p. *<br />
* books with more or less extensive mineral data compilations<br />
III
Guide <strong>to</strong> Thin Section Microscopy<br />
Terminology & abbreviations<br />
A note on terminology and some abbreviations used in this book<br />
When using a polarized-light microscope, communicating directions in an unequivocal way is<br />
important. The cross-hairs in the ocular, the directions <strong>of</strong> light polarization and the microscope<br />
axis are the main reference directions. The four cardinal points (and intermediate directions<br />
derived from those) are commonly used <strong>to</strong> express and distinguish directions, with no<br />
geographical meaning, obviously. For a standard microscope set-up, "N-S" means parallel <strong>to</strong><br />
the "vertical" cross-hair or parallel <strong>to</strong> a line running from brow <strong>to</strong> chin between the two eyes<br />
<strong>of</strong> the observer; "E-W" means parallel <strong>to</strong> the "horizontal" cross-hair or parallel <strong>to</strong> a line across<br />
the centre <strong>of</strong> both eyes. Diagonal directions are thus referred <strong>to</strong> as NW-SE and NE-SW.<br />
The Greek letters α, β, γ, ε, ω are used by some authors as subscripts <strong>to</strong> refractive indices (n).<br />
In this text, we follow the terminology <strong>of</strong> Tröger et al. (1979) and others which is logical and<br />
intuitive in the sense that the refractive indices n x , n y and n z correlate with the axes X, Y and Z<br />
<strong>of</strong> the coordinate system in which the shape <strong>of</strong> the indicatrix <strong>of</strong> biaxial crystals is defined.<br />
Furthermore, α, β, γ are crystallographic cell parameters, and hence any potential confusion<br />
with optical parameters should be avoided. In the same way as in n x , n y and n z , the subscripts o<br />
and e relate <strong>to</strong> refractive indices <strong>of</strong> O- and E-rays or O- and E-waves in uniaxial crystals.<br />
As pointed out in the previous edition <strong>of</strong> the <strong>guide</strong>book, many (though not all) authors <strong>of</strong><br />
optical mineralogy textbooks use the Greek letter delta for two different parameters that are<br />
related <strong>to</strong> each other: δ stands for birefringence and ∆ for retardation (∆ = δ * d; d = thickness<br />
<strong>of</strong> crystal plate). To add <strong>to</strong> the potential confusion, ∆ is the symbol for birefringence in the<br />
widely used Tröger tables (Tröger et al., 1979). Although the use <strong>of</strong> δ and ∆ may be standard<br />
symbols in the teaching <strong>of</strong> crystal optics in some institutions, we decided <strong>to</strong> abandon these for<br />
the 2012 edition in order <strong>to</strong> make the shorthand terminology less confusing for those being<br />
introduced <strong>to</strong> optical mineralogy. We will use the symbol ∆ strictly in its standard mathematical<br />
sense (i.e., "difference"). Hence, birefringence can simply be expressed as ∆n (= n z - n x ,<br />
for example). The symbol for retardation is the Greek letter Γ (hence, Γ = ∆n * d).<br />
Raith, Raase, & Reinhardt – January – February 2012 2012<br />
In science the common symbol for wavelength is λ, but in optical mineralogy λ is also used<br />
for indicating the interference colour order (1λ = first order red, 2λ = second order red, etc.).<br />
We have tried <strong>to</strong> circumvent reference <strong>to</strong> the latter, but the use <strong>of</strong> terms such as "λ-plate"<br />
(meaning 1λ or 551 nm retardation corresponding <strong>to</strong> 1st order red) and "λ/4-plate" are somewhat<br />
entrenched and thus hard <strong>to</strong> avoid.<br />
IV
Guide <strong>to</strong> Thin Section Microscopy<br />
Microscope<br />
1. The petrographic microscope<br />
1.1 Magnifying glass (loupe) and microscope<br />
In order <strong>to</strong> examine the microtextural and mineralogical features in the <strong>thin</strong> <strong>section</strong> <strong>of</strong> a rock<br />
with higher resolution than that <strong>of</strong> the naked eye, a microscope is used. A microscope has two<br />
systems <strong>of</strong> lenses. The first lens system (objective) produces a magnified image <strong>of</strong> the object.<br />
This real image is viewed by the second lens system (ocular or eyepiece) that also provides<br />
further magnification.<br />
1.1.1 Imaging by a converging lens (objective)<br />
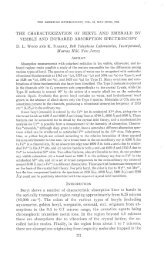
Optical images <strong>of</strong> an object are formed by converging lenses, i.e. spherical lenses with<br />
outward bulging surfaces (biconvex lenses). An inverted real image is formed if the object is<br />
placed beyond the focal length (f) <strong>of</strong> the lens. This image can be projected on a screen (which<br />
is the principle behind the camera and the human eye; Fig. 1-1, upper part).<br />
The distances from the object <strong>to</strong> the lens (a) and from the lens <strong>to</strong> the image (b) are related <strong>to</strong><br />
the focal lenghts (f) <strong>of</strong> the biconvex lens by the following equation (lens formula, Fig. 1-1,<br />
lower part):<br />
1 +<br />
f<br />
a<br />
1 1<br />
=<br />
b f<br />
The magnification <strong>of</strong> the lens is given by:<br />
B b b − f<br />
M = = =<br />
A a f<br />
f<br />
=<br />
a −<br />
The size <strong>of</strong> the real image (B) is larger than that <strong>of</strong> the object (A), if<br />
b − f<br />
f<br />
> 1<br />
i.e.<br />
2f<br />
< b<br />
resp.<br />
f<br />
a − f<br />
> 1<br />
i.e.<br />
a < 2f.<br />
Raith, Raase & Reinhardt – February 2012<br />
Example: If an object is placed at a distance <strong>of</strong> 33 mm in front <strong>of</strong> a biconvex lens with a focal<br />
length <strong>of</strong> 30 mm, the lens will produce a 10-times magnified image (M = 10:1) at a distance<br />
<strong>of</strong> 330 mm behind the lens.<br />
The human eye can modify the focal length by changing the curvature <strong>of</strong> its lens such that it<br />
can project sharp images on the retina <strong>of</strong> objects ranging in distance from about 250 mm <strong>to</strong><br />
infinity.<br />
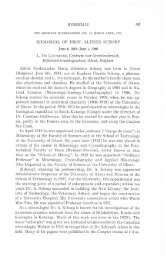
As an object approaches the human eye from a greater distance it is seen at increasing visual<br />
angles (α) and, with the concomitant increasing magnification, the image on the retina<br />
becomes progressively larger (Fig. 1-2, upper part).<br />
The shortest possible distance <strong>of</strong> focused vision varies individually. It has been set at 250 mm<br />
by the optical industry in order <strong>to</strong> standardize the calculation <strong>of</strong> magnification values.<br />
1
Guide <strong>to</strong> Thin Section Microscopy<br />
Microscope<br />
Figure 1-1. Optical imaging <strong>of</strong> a crystal by a biconvex lens<br />
Raith, Raase & Reinhardt – February 2012<br />
Placed at the shortest distance <strong>of</strong> focused vision, the object is seen at the largest possible<br />
visual angle and thus with the highest possible magnification. Fine structures <strong>of</strong> an object,<br />
when observed at the shortest distance <strong>of</strong> vision, can only be resolved, however, if they<br />
appear at visual angles larger than 1’ (about 0.02˚).<br />
Structural details that remain below this limit <strong>of</strong> vision can still be resolved through further<br />
magnification with a magnifying glass (loupe) or microscope.<br />
2
Guide <strong>to</strong> Thin Section Microscopy<br />
Microscope<br />
1.1.2 Magnification with the loupe (ocular, eyepiece)<br />
The most simple device <strong>to</strong> increase the visual angle is a magnifying glass (loupe). It consists<br />
<strong>of</strong> a biconvex lens with a focal length that is smaller than the minimum distance <strong>of</strong> vision<br />
(
Guide <strong>to</strong> Thin Section Microscopy<br />
Microscope<br />
Raith, Raase & Reinhardt – February 2012<br />
Figure 1- 2. Magnification <strong>of</strong> a crystal by a biconvex lens (magnifying glass, loupe, ocular)<br />
4
Guide <strong>to</strong> Thin Section Microscopy<br />
Microscope<br />
Raith, Raase & Reinhardt – February 2012<br />
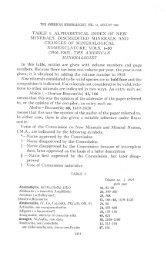
Figure 1-3. Two-step magnification <strong>of</strong> a crystal by the compound microscope<br />
5
Guide <strong>to</strong> Thin Section Microscopy<br />
Microscope<br />
The <strong>to</strong>tal magnification M <strong>of</strong> a compound microscope is the product <strong>of</strong> objective<br />
magnification (M O ) and ocular magnification (M L ):<br />
M = M O * M L<br />
Example: A microscope equipped with an objective M O = 50 and an ocular M L = 10 has a<br />
final magnification <strong>of</strong> 50 x 10 = 500.<br />
In modern compound microscopes (with infinity-corrected optical systems) the magnification<br />
<strong>of</strong> the object is performed in a somewhat different way. The specimen is placed in the lower<br />
focal plane <strong>of</strong> the objective, so that its image is projected at infinity. An auxiliary lens (tube<br />
lens or telan) placed wi<strong>thin</strong> the tube between the objective and the eyepiece brings the<br />
parallel light rays in<strong>to</strong> focus and produces the real image which then is viewed with the<br />
ocular. The infinity-corrected imaging technique allows <strong>to</strong> insert accessory components such<br />
as analyzer, compensa<strong>to</strong>rs or beam splitters in<strong>to</strong> the light path <strong>of</strong> parallel rays between the<br />
objective and the tube lens with only minimal effects on the quality <strong>of</strong> the image. It further<br />
provides a better correction <strong>of</strong> spherical and chromatic aberration.<br />
1.2 Objective and ocular (eyepiece)<br />
1.2.1 Objective<br />
The quality <strong>of</strong> the observed image is largely determined by the objective. The objective is<br />
thus a key component in the microscope, being responsible for the primary image, its<br />
magnification and the resolution under which fine details <strong>of</strong> an object can be observed. The<br />
ocular merely serves <strong>to</strong> further magnify the fine details that are resolved in the intermediate<br />
image, so that they exceed the angular resolution limits <strong>of</strong> the human eye and can be viewed<br />
at visual angles larger than 1' (Ch. 1.1.1, loupe).<br />
The important properties <strong>of</strong> an objective are its magnification, its numerical aperture and the<br />
degree <strong>of</strong> aberration correction, whereby the latter two determine the quality <strong>of</strong> the<br />
intermediate image.<br />
Raith, Raase & Reinhardt – February 2012<br />
Aberration<br />
Simple biconvex lenses produce imperfect, dis<strong>to</strong>rted images that show spherical and<br />
chromatic aberrations. In modern objectives, such optical aberrations are compensated <strong>to</strong> a<br />
large extent by a combination <strong>of</strong> converging and diverging lenses that are made <strong>of</strong> materials<br />
with different refractive indices and dispersion. Remaining abberations are compensated by<br />
oculars with complementary corrections.<br />
At high magnification and large aperture, the cover glass <strong>of</strong> <strong>thin</strong> <strong>section</strong>s introduces<br />
chromatic and spherical aberrations which have an adverse effect on image quality. This is<br />
because light rays emerging from an object point P are refracted at the boundary cover<br />
glass/air. As a consequence, the backward extensions <strong>of</strong> the light rays do not focus in a spot,<br />
but form a blurry, defocused area (Fig. 1-4A, grey areas). With increasing thickness <strong>of</strong> the<br />
cover glass the blurring effect becomes more pronounced. High-power objectives are<br />
therefore corrected for this type <strong>of</strong> cover glass aberration, commonly for a standard glass<br />
thickness <strong>of</strong> 0.17 mm. Hence, the cover glass forms part <strong>of</strong> the objective system! Any<br />
thickness deviating from 0.17 mm affects the intermediate image. Furthermore, if the cover<br />
glass is <strong>to</strong>o thick, it may not be possible <strong>to</strong> focus the specimen using high-power objectives,<br />
due <strong>to</strong> the short free working distances <strong>of</strong> such objectives (see Table 1).<br />
6
Guide <strong>to</strong> Thin Section Microscopy<br />
Microscope<br />
Figure 1-4. A. Aberration <strong>of</strong> light rays in the cover glass; B. Aperture <strong>of</strong> the objective<br />
Raith, Raase & Reinhardt – February 2012<br />
Aperture and resolution<br />
The numerical aperture (N.A.) <strong>of</strong> the objective is a measure <strong>of</strong> the quantity <strong>of</strong> light taken up<br />
by the objective lens. The N.A. is proportional <strong>to</strong> the angular aperture α <strong>of</strong> the cone <strong>of</strong> light<br />
rays emitted from a point on the specimen that enters the objective, and <strong>to</strong> the refractive<br />
index n <strong>of</strong> the medium which separates the specimen from the front lens <strong>of</strong> the objective (e.g.<br />
1.0 for air, 1.33 for water, and ~1.56 for oil): N.A. = n * sinα (Fig. 1-4B).<br />
When viewing the specimen with objectives <strong>of</strong> increasing numerical aperture, the cone <strong>of</strong><br />
light rays entering the front lens <strong>of</strong> the objective increases in width. This is <strong>of</strong> great<br />
importance in <strong>microscopy</strong>, because the resolving power <strong>of</strong> the objective, i.e. the ability <strong>of</strong> the<br />
objective <strong>to</strong> visualize fine details <strong>of</strong> the specimen in the intermediate image, increases with its<br />
numerical aperture. Resolution is defined as the shortest distance d at which two narrowly<br />
spaced points on the specimen are still visualized as separate entities in the intermediate<br />
image. The resolution limit d depends only on the numerical aperture and the wavelength λ <strong>of</strong><br />
the light used: d = 0.5 λ/N.A..<br />
It follows that, in order <strong>to</strong> resolve finest details, the specimen should be viewed with a highpower<br />
objective with large numerical aperture and under short-wavelength monochromatic<br />
light.<br />
7
Guide <strong>to</strong> Thin Section Microscopy<br />
Microscope<br />
The numerical aperture <strong>of</strong> the objective, and hence its resolution, can be increased by filling<br />
the space between the front lens <strong>of</strong> the objective and the specimen with an immersion liquid<br />
<strong>of</strong> suitably high refractive index (oil; n ~1.56). Thereby the refraction <strong>of</strong> light rays at the<br />
interface between the cover glass and oil is minimised, and a wider cone <strong>of</strong> light rays enters<br />
the objective (Fig. 1-4B).<br />
For this purpose special objective systems with small focal length and short free working<br />
distance have been designed: oil-immersion objectives. While “dry” objectives operating in<br />
air do not have numerical apertures beyond 0.95 (the theoretical limit being N.A. = 1),<br />
aperture values up <strong>to</strong> 1.40 can be achieved with oil-immersion objectives, depending on the<br />
refractive index <strong>of</strong> the appropriate immersion liquid (water = 1.333; glycerine = 1.455;<br />
immersion oil = 1.515; methylene iodide = 1.744).<br />
Specific properties <strong>of</strong> the objective such as magnification, numerical aperture, optical tube<br />
length, degree <strong>of</strong> aberration correction, and cover glass thickness are engraved on the outer<br />
objective barrel (Fig. 1-5, Table 1). Objectives designed for polarized-light <strong>microscopy</strong><br />
consist <strong>of</strong> strain-free lens systems and are marked with the inscription P, PO, or Pol. Table 1<br />
also gives the free working distance (FWD) between the specimen and the front lens <strong>of</strong> the<br />
objective for selected objectives <strong>of</strong> some major manufacturers.<br />
1.2.2 Ocular (Eyepiece)<br />
Fine structures in the intermediate image are only resolved by the human eye if they are<br />
viewed at visual angles >1'. Commonly, this requires a further magnification <strong>of</strong> the intermediate<br />
image by the ocular. The optimal resolution is achieved if the <strong>to</strong>tal magnification <strong>of</strong><br />
the microscope is the numerical aperture <strong>of</strong> the objective multiplied by 500 <strong>to</strong> 1000:<br />
M = M O * M L = 500 * N.A. ↔ 1000 * N.A.<br />
If the <strong>to</strong>tal magnification lies below this range, finest structures in the intermediate image<br />
remain invisible. If it is higher, the intermediate image is magnified without any further gain<br />
in resolution (= empty magnification).<br />
Raith, Raase & Reinhardt – February 2012<br />
Modern oculars consist <strong>of</strong> two multi-lens components, the “eye lens” and the “field lens”,<br />
that correct optical aberrations <strong>of</strong> the ocular itself and eliminate residual aberrations <strong>of</strong> the<br />
intermediate image. A Periplan ocular, for example, contains seven lenses that are cemented<br />
in<strong>to</strong> a single doublet, a single triplet, and two individual lenses. A fixed internal diaphragm is<br />
positioned in the focal plane <strong>of</strong> the ocular, between the “eye lens” and “field lens”<br />
components, in focus with the intermediate image, and defines the circular field <strong>of</strong> view.<br />
For polarized-light <strong>microscopy</strong>, an ocular with exactly adjusted crosshairs (or a crossed<br />
micrometer disc) mounted on the fixed diaphragm not only provides the ‘N-S’ and ‘E-W’<br />
reference directions for the vibration directions <strong>of</strong> the polarizer and analyzer, but also serves<br />
<strong>to</strong> measure angles (Ch. 2.1, 4.2.1). For measuring and counting objects in a <strong>thin</strong> <strong>section</strong>, glass<br />
discs with engraved linear and crossed micrometers or grids can be placed in the diaphragm<br />
plane. By adjusting the height <strong>of</strong> the eye lens, diaphragm and reticule are brought in<strong>to</strong> focus<br />
with the intermediate image.<br />
The specific properties <strong>of</strong> oculars are inscribed on their casing (Fig. 1-5, Table 1).<br />
8
Guide <strong>to</strong> Thin Section Microscopy<br />
Microscope<br />
Table 1. Objectives and oculars <strong>of</strong> some renowned manufacturers<br />
I. Strain-free objectives for polarizing <strong>microscopy</strong><br />
Company Designation M NA<br />
FWD<br />
(mm)<br />
Cover glass<br />
thickness<br />
Leica Hi Plan Pol 4 0.10 26.2 -<br />
Hi Plan Pol 10 0.22 7.8 -<br />
II. Oculars<br />
Hi Plan Pol 20 0.40 0.9 0.17<br />
Hi Plan Pol 40 0.65 0.31 0.17<br />
Hi Plan Pol 63 0.75 0.31 0.17<br />
Nikon CFI Achromat P 4 0.10 30 -<br />
CFI Achromat P 10 0.25 6.1 -<br />
CFI Achromat P 20 0.40 3 0.17<br />
CFI Achromat P 40 0.65 0.65 0.17<br />
Zeiss A-Plan 2.5 0.06 9.4 -<br />
A-Plan 5 0.12 9.9 -<br />
A-Plan 10 0.25 4.4 -<br />
A-Plan 20 0.45 0.51 0.17<br />
A-Plan 40 0.65 0.43 0.17<br />
Olympus PLN4xP 4 0.10 18.5 -<br />
ACHN10xP 10 0.25 6 -<br />
Company<br />
ACHN20xP 20 0.40 3 0.17<br />
ACHN40xP 40 0.65 0.45 0.17<br />
Designation<br />
Magnification<br />
Field number<br />
(mm)<br />
Leica Periplan 10<br />
20<br />
Periplan crossed micrometer 10<br />
20<br />
Nikon C FI 10<br />
22<br />
CFI CM crossed micrometer 10<br />
22<br />
Zeiss W-PL, focusable 10<br />
23<br />
Olympus WHN10x 10<br />
22<br />
WHN10x-H, focusable 10<br />
22<br />
Raith, Raase & Reinhardt – February 2012<br />
Figure 1-5. Objective (Example: Nikon CFI Achromat 20x P) and ocular (Example: Leica<br />
Periplan with reticule plate)<br />
9
Guide <strong>to</strong> Thin Section Microscopy<br />
Microscope<br />
1.2.3 Tube, objective and ocular<br />
Objective and ocular are connected by a microscope tube. In older microscopes the tube has a<br />
specified length (Nikon, Olympus, Zeiss: 160 mm; Leitz: 170 mm) because the objectives<br />
project the real images on<strong>to</strong> a fixed plane. In modern microscopes the tube length can vary as<br />
infinity-corrected objectives are used. In such systems, the tube length is referred <strong>to</strong> as the<br />
reference focal length and ranges between 165 mm (Zeiss) and 200 mm (Leica, Nikon).<br />
The ocular is inserted in<strong>to</strong> the upper end <strong>of</strong> the tube. Two small slots at the tube edge ensure<br />
that the ocular position is fixed, with the crosshairs oriented either N-S and E-W or<br />
diagonally at 45° <strong>to</strong> these directions. To account for variable eyesight, the crosshairs can be<br />
focused by adjusting the height <strong>of</strong> the eye lens.<br />
The objective is mounted at the lower end <strong>of</strong> the tube. The single-objective holders common<br />
in former petrographic microscopes are nowadays only used in reflected-light, interference<br />
and universal-stage <strong>microscopy</strong>. In modern microscopes, the objectives are mounted on a<br />
quadruple or quintuple revolving nosepiece (turret) accommodating 4 <strong>to</strong> 5 objectives <strong>of</strong><br />
different magnification which can thus be quickly selected for observation (Fig. 1-6). A clicks<strong>to</strong>p<br />
mechanism ensures an accurate position when changing objectives. When objectives <strong>of</strong><br />
different magnification are used on the same object, it is desirable that the images remain<br />
focused. Thus, modern objectives have a fixed distance from the nosepiece objective<br />
mounting hole <strong>to</strong> the point <strong>of</strong> focus on the specimen (= parfocal distance; Leica, Zeiss:<br />
45mm; Nikon: 60 mm).<br />
Raith, Raase & Reinhardt – February 2012<br />
1.3 Illumination<br />
To be viewed with the microscope, the specimens, unless they fluoresce, must be illuminated.<br />
Opaque specimens (e.g. ore minerals, metals) are imaged with the proportion <strong>of</strong> light that is<br />
reflected from the specimen (reflected-light <strong>microscopy</strong>). Transparent or weakly absorbent<br />
specimens are observed using the light that passes through them (transmitted-light<br />
<strong>microscopy</strong>). The images reveal only those structures <strong>of</strong> the specimen where the colour and<br />
intensity <strong>of</strong> the transmitted light is modified through absorption, diffraction and reflection.<br />
In older microscopes the illumination <strong>of</strong> a translucent specimen is achieved by directing the<br />
light from the sun or from a matted bulb via a planar or concave mirror and a subsequent<br />
focusing lens system (condenser) through the specimen.<br />
In modern microscopes a built-in light source in the base <strong>of</strong> the microscope provides the<br />
specimen illumination. Commonly a 6V 20W halogen bulb is used with variable brightness<br />
control. The light emitted from the bulb is focused by a simple lens system (collec<strong>to</strong>r) and<br />
then directed via the condenser through the specimen (Fig. 1-7).<br />
1.3.1 Aperture <strong>of</strong> illumination<br />
A homogeneous illumination <strong>of</strong> the observed specimen area is essential for the quality <strong>of</strong> the<br />
microscopic image. Furthermore, in order <strong>to</strong> achieve optimal resolution, the cone <strong>of</strong> light rays<br />
passing through the specimen should have the largest possible opening angle (cf. Ch. 1.2.1,<br />
Aperture).<br />
10
Guide <strong>to</strong> Thin Section Microscopy<br />
Microscope<br />
As a rule, the aperture <strong>of</strong> illumination should equate or be slightly less than the aperture <strong>of</strong><br />
the objective. Larger apertures would cause a loss <strong>of</strong> contrast, smaller apertures a reduction <strong>of</strong><br />
resolution. The aperture <strong>of</strong> illumination is adjusted with a diaphragm which is located below<br />
the condenser lenses (iris diaphragm or aperture diaphragm) (Fig. 1-7; Ch. 1.4.1). By closing<br />
the diaphragm, the illumination aperture is reduced, resulting in increased image contrast and<br />
depth <strong>of</strong> field. Opening the diaphragm increases the aperture <strong>of</strong> illumination and leads <strong>to</strong> a<br />
loss <strong>of</strong> image contrast.<br />
1.3.2 Light field<br />
Depending on their magnification, objectives cover specimen areas <strong>of</strong> different size (object<br />
field). To avoid blooming <strong>of</strong> the fine image details by lateral stray light, the diameter <strong>of</strong> the<br />
illuminating light bundle (light field) should not exceed the size <strong>of</strong> the viewed object field.<br />
The light field can be adjusted <strong>to</strong> the required size by a diaphragm which is located above the<br />
collec<strong>to</strong>r lens <strong>of</strong> the illumina<strong>to</strong>r (field diaphragm) (Fig. 1-7; Ch. 1.4.1).<br />
Illumination aperture and light field can also be modified by changing the focal length <strong>of</strong> the<br />
condenser. For this purpose, modern condensers are equipped with a swing-in auxiliary<br />
condensing lens which, when inserted, changes the system from long focal length (low<br />
aperture, large light field) <strong>to</strong> short focal length (high aperture, small light field size).<br />
To achieve complete illumination <strong>of</strong> specimens when using objectives <strong>of</strong> low magnification<br />
(e.g. M = 1.25), the front lens, and in some cases the entire condenser, must be removed from<br />
the substage assembly.<br />
A number <strong>of</strong> particular condensers has been designed for application in special imaging<br />
techniques (phase contrast, interference, fluorescence and dark field <strong>microscopy</strong>).<br />
To ensure optimum illumination and resolution <strong>of</strong> fine specimen structures, a special<br />
illumination method was introduced by A. Köhler in 1893, which is still the most widely used<br />
method <strong>of</strong> specimen illumination in transmitted-light <strong>microscopy</strong> (see Ch. 1.4).<br />
Raith, Raase & Reinhardt – February 2012<br />
1.3.3 Glass diffuser and filters<br />
Built in<strong>to</strong> the lamphouse <strong>of</strong> modern microscopes, a thermal filter absorbs the heat produced<br />
by the halogen lamp, and an opal glass then diffuses the emitted light, thereby improving the<br />
homogeneous illumination <strong>of</strong> the specimen.<br />
Various filters are either housed in the base <strong>of</strong> the microscope or can be placed in a port<br />
above the field diaphram. Commonly, a blue daylight filter serves <strong>to</strong> condition the light<br />
emitted from the artificial light source <strong>to</strong> the quality <strong>of</strong> sunlight. Neutral density filters are<br />
used <strong>to</strong> attenuate the intensity <strong>of</strong> light without changing its spectral composition.<br />
Monochromatic light which is needed for special measurements, such as the determination <strong>of</strong><br />
refractive indexes with the immersion method, is usually generated by interference filters<br />
(dichroic filters).<br />
11
Guide <strong>to</strong> Thin Section Microscopy<br />
Microscope<br />
Raith, Raase & Reinhardt – February 2012<br />
Figure 1-6. Design <strong>of</strong> polarized-light microscopes (Nikon Eclipse 50/Pol; Leica Laborlux 12<br />
Pol)<br />
12
Guide <strong>to</strong> Thin Section Microscopy<br />
Microscope<br />
Figure 1-7. Orthoscopic and conoscopic ray paths in the microscope<br />
Raith, Raase & Reinhardt – February 2012<br />
A: Orthoscopic illumination mode. In finite tube-length microscopes, the objective<br />
produces a real inverted image (intermediate image) <strong>of</strong> the specimen which then is viewed<br />
with further enlargement through the ocular (A-2). In infinity-corrected microscopes, the<br />
objective projects the image <strong>of</strong> the specimen <strong>to</strong> infinity, and a second lens placed in the tube<br />
(tube lens) forms the intermediate image which then is viewed through the ocular (A-1). This<br />
imaging design allows <strong>to</strong> insert accessory components such as analyzer, compensa<strong>to</strong>rs or<br />
beam splitters in<strong>to</strong> the light path <strong>of</strong> parallel rays between the objective and the tube lens with<br />
only minor effects on the image quality.<br />
B: Conoscopic illumination mode. Parallel rays <strong>of</strong> the light cone which illuminates the<br />
specimen create an image in the upper focal plane <strong>of</strong> the objective (B). In the case <strong>of</strong><br />
anisotropic crystals, an interference image is generated which can be viewed as an<br />
enlargement by inserting an auxiliary lens (Amici-Bertrand lens). The interference image can<br />
also be directly observed in the tube through a pinhole which replaces the ocular.<br />
13
Guide <strong>to</strong> Thin Section Microscopy<br />
Microscope<br />
1.4 Light paths in the microscope<br />
1.4.1 Köhler illumination<br />
The Köhler illumination is based on a specific geometry <strong>of</strong> light paths in the illuminating<br />
substage part <strong>of</strong> the microscope, and is achieved through a special arrangement <strong>of</strong> the light<br />
source, collec<strong>to</strong>r lens, field diaphragm, aperture diaphragm and condenser lens (Fig. 1-7).<br />
This special illumination mode ensures an even illumination <strong>of</strong> the viewed object field (light<br />
field) and further allows <strong>to</strong> independently adjust the illumination aperture and the size <strong>of</strong> the<br />
light field.<br />
1. The collec<strong>to</strong>r lens projects an enlarged image <strong>of</strong> the light source (filament <strong>of</strong> the halogen<br />
lamp) on<strong>to</strong> the front focal plane <strong>of</strong> the condenser where the aperture diaphragm resides. As a<br />
result, the illuminating light beam is leaving the condenser as a light cone consisting <strong>of</strong><br />
bundles <strong>of</strong> parallel rays (Fig. 1-7). The aperture <strong>of</strong> the illuminating cone can be modified by<br />
varying the aperture <strong>of</strong> the iris diaphragm. As each point in the object field receives light rays<br />
from each point <strong>of</strong> the filament <strong>of</strong> the halogen lamp, an even illumination <strong>of</strong> the entire object<br />
field is achieved. Further images <strong>of</strong> the light source (filament) are generated in the upper<br />
focal plane <strong>of</strong> the objective (resp. the tube lens) and the upper focal plane <strong>of</strong> the ocular.<br />
2. The condenser lens projects an image <strong>of</strong> the field diaphragm on<strong>to</strong> the specimen plane, and<br />
hence, superposed images <strong>of</strong> both object and field diaphragm are generated by the objective<br />
in the intermediate image plane where they are jointly observed through the ocular. The size<br />
<strong>of</strong> the illuminated field <strong>of</strong> the specimen (light field) can be adjusted by varying the aperture<br />
<strong>of</strong> the field diaphragm without affecting the illumination aperture (Fig. 1-7).<br />
The microscope alignment for Köhler illumination is described in Chapter 1.5.<br />
The Köhler illumination allows <strong>to</strong> examine optically anisotropic minerals in two different<br />
modes:<br />
Raith, Raase & Reinhardt – February 2012<br />
1.4.2 Orthoscopic mode<br />
The divergent light rays emanating from each point <strong>of</strong> a specimen are focused in the<br />
intermediate image plane, thereby creating the real image <strong>of</strong> the specimen (Fig. 1-7A).<br />
In an optically anisotropic mineral, along each direction <strong>of</strong> the illuminating cone (Ch. 4.1)<br />
light waves with different velocity (birefringence; Ch. 4.2.3) and in part also different<br />
amplitude (absorption) pass through the grain. The light waves are superposed at each point<br />
<strong>of</strong> the object image. Therefore, the image <strong>of</strong> an individual mineral grain, when viewed under<br />
strongly convergent illumination, does not provide information on the optical behaviour in<br />
different directions <strong>of</strong> the mineral.<br />
However, when the aperture <strong>of</strong> the illumination cone is reduced by closing down the aperture<br />
diaphragm, the optical phenomena observed in the intermediate image are dominated by the<br />
properties <strong>of</strong> light waves that pass through the mineral grain at right angle <strong>to</strong> the viewing<br />
plane: orthoscopic mode (Ch. 4). It follows that direction-dependent optical properties <strong>of</strong> an<br />
anisotropic mineral in <strong>thin</strong> <strong>section</strong> must be deduced from examining several grains cut in<br />
different crystallographic orientations.<br />
14
Guide <strong>to</strong> Thin Section Microscopy<br />
Microscope<br />
1.4.3 Conoscopic mode<br />
When a highly convergent light cone is generated (e.g. by inserting the condenser front lens<br />
in<strong>to</strong> the light path), bundles <strong>of</strong> parallel light rays in a wide range <strong>of</strong> directions pass through<br />
the mineral grain. The parallel light rays are then focused in the rear focal plane <strong>of</strong> the<br />
objective, whereby rays with different tilt angles <strong>to</strong>wards the microscope axis produce image<br />
points in different positions (Fig. 1-7B, Fig. 4-48).<br />
This image therefore allows <strong>to</strong> examine the behaviour <strong>of</strong> light propagating along distinct<br />
crystallographic directions in a single grain: conoscopic mode. When viewed with crossed<br />
polarizers, characteristic interference figures are observed that reflect the symmetry and<br />
optical properties <strong>of</strong> the anisotropic mineral (Ch. 5).<br />
The conoscopic interference figure only records those optical directions that are represented<br />
in the aperture cone (Ch. 1.2). In order <strong>to</strong> maximise the range <strong>of</strong> directions in a cone as wide<br />
as possible, the aperture <strong>of</strong> both objective and condenser must be large.<br />
An enlarged interference image can be observed by inserting an auxiliary lens, the Amici-<br />
Bertrand lens, in<strong>to</strong> the tube between analyzer and ocular (Fig. 1-7B). The interference image<br />
can be focused by adjusting the distance <strong>of</strong> the ocular <strong>to</strong> the Amici-Bertrand lens, provided<br />
the microscope allows such an adjustment. Some microscopes <strong>of</strong>fer special devices for<br />
centring and focusing the Amici-Bertrand lens.<br />
Alternatively, the interference figure can be directly viewed wi<strong>thin</strong> the microscope tube after<br />
removing the ocular, or by looking through a pinhole which replaces the ocular. The image<br />
appears smaller and has better contrast compared <strong>to</strong> an interference figure observed through<br />
the Amici-Bertrand lens.<br />
Practical guidance <strong>to</strong> the conoscopic imaging mode is given in Chapter 5, which also<br />
discusses the application <strong>of</strong> conoscopy <strong>to</strong> the identification <strong>of</strong> anisotropic minerals.<br />
1.5 Centring the microscope<br />
Raith, Raase & Reinhardt – February 2012<br />
Apart from adjusting the substage illumination alignment according <strong>to</strong> Köhler, an optimal<br />
microscope performance requires that all optical components (light source, collec<strong>to</strong>r,<br />
condenser, objective, ocular) and the rotatable stage are aligned on a common central axis<br />
which coincides with the direction <strong>of</strong> the vertical light rays in the microscope. All<br />
components are centred <strong>to</strong> the axis <strong>of</strong> the rotating stage. The centring is done in three steps:<br />
A. Centring the objectives<br />
The centre <strong>of</strong> the field <strong>of</strong> view, which corresponds <strong>to</strong> the lens axis <strong>of</strong> the objective, must be in<br />
alignment with the axis <strong>of</strong> the rotating stage. To check this, the <strong>thin</strong> <strong>section</strong> has <strong>to</strong> be put in<strong>to</strong><br />
focus, a minute grain or object in the sample is selected and shifted <strong>to</strong> the centre (Fig. 1-8, I).<br />
When rotating the microscope stage the following situations may occur:<br />
a) The particle remains stationary in its central position, indicating that the objective is<br />
precisely centred.<br />
15
Guide <strong>to</strong> Thin Section Microscopy<br />
Microscope<br />
b) The particle is moving along a circular <strong>of</strong>f-centre path (Fig. 1-8,II), indicating that the<br />
objective is not centred. The rotation axis <strong>of</strong> the image has <strong>to</strong> be shifted in<strong>to</strong> the centre <strong>of</strong> the<br />
reticule. This is achieved by turning the two centering screws located in the objective casing<br />
or the nosepiece using the centring <strong>to</strong>ols commonly provided with the microscope. Older<br />
microscopes may have centring rings on the objectives (and hence no special centring <strong>to</strong>ols<br />
are required). The objectives are centred if the rotation centre <strong>of</strong> any circular particle path<br />
coincides with the crosshairs inter<strong>section</strong>. An alternative way <strong>of</strong> achieving this is <strong>to</strong> rotate the<br />
stage such that an observed particle is in the most distant <strong>of</strong>f-centre position, 180° from its<br />
position at the crosshairs inter<strong>section</strong>. By turning the centring screws, the particle is then<br />
shifted half the distance <strong>to</strong>wards the crosshairs inter<strong>section</strong> (Fig. 1-8,III).<br />
To verify that the objective is precisely centred now, the particle is shifted in<strong>to</strong> the crosshairs<br />
inter<strong>section</strong> by carefully moving the <strong>thin</strong> <strong>section</strong>. If the particle remains in its position when<br />
rotating the stage, the objective is centred (Fig. 1-8,IV). Otherwise, the centring procedure<br />
has <strong>to</strong> be repeated.<br />
All the objectives on the nosepiece have <strong>to</strong> be centred this way. Should an objective <strong>of</strong> high<br />
magnification be already centred precisely, it is even easier <strong>to</strong> centre the lower-magnification<br />
objectives. A small grain or object is positioned in the crosshairs inter<strong>section</strong> using the highmagnification<br />
objective. Then the poorly centred objective is rotated in<strong>to</strong> the optical path and<br />
the particle is moved <strong>to</strong> the crosshairs inter<strong>section</strong> using the centering devices.<br />
Caution! It is important <strong>to</strong> ensure that the nosepiece is positioned correctly on the tube and<br />
the objective in use has clicked in<strong>to</strong> place. Otherwise, centring can never be achieved (Ch.<br />
1.7). Some microscopes (e.g., Olympus) have a stage that can be centred. The stage is then<br />
centred on a single fixed objective and has <strong>to</strong> be aligned first, with that particular objective in<br />
place, before the other objectives can be centred. Any attempt <strong>to</strong> centre the objectives with<br />
the stage being <strong>of</strong>f-centre will result in a serious misalignment <strong>of</strong> the light path.<br />
What applies <strong>to</strong> all microscopes: To avoid de-centring <strong>of</strong> the objectives, they must never be<br />
<strong>to</strong>uched when changing magnification! Always grab the grooved rim <strong>of</strong> the nosepiece <strong>to</strong><br />
change between objectives.<br />
Raith, Raase & Reinhardt – February 2012<br />
Figure 1-8. Centring the objective<br />
16
Guide <strong>to</strong> Thin Section Microscopy<br />
Microscope<br />
B. Centring the condenser for Köhler illumination<br />
After focusing the <strong>thin</strong> <strong>section</strong>, the field diaphragm is closed, the front lens <strong>of</strong> the condenser<br />
inserted in<strong>to</strong> the optical path, and the field diaphragm focused in the image plane by adjusting<br />
the substage height (Fig. 1-9 I→II). The following situations may be encountered:<br />
(a) The centre <strong>of</strong> the field diaphragm image coincides with the crosshairs inter<strong>section</strong>, i.e. the<br />
centre <strong>of</strong> the field <strong>of</strong> view, indicating that the condenser is perfectly centred (Fig. 1-9 III).<br />
(b) The field diaphragm image is <strong>of</strong>fset with respect <strong>to</strong> the crosshairs. In this case, the field<br />
diaphragm image must be centred by turning the condenser-centring screws (Fig. 1-9 II→III).<br />
Finally, in order <strong>to</strong> avoid glare by lateral stray light, the field diaphragm should be opened<br />
only slightly beyond the margin <strong>of</strong> the field <strong>of</strong> view (Fig. 1-9 IV).<br />
Figure 1-9. Centring the condenser<br />
Raith, Raase & Reinhardt – February 2012<br />
C. Centring the light source<br />
In modern microscopes, light source and collec<strong>to</strong>r are commonly integrated in<strong>to</strong> the base <strong>of</strong><br />
the microscope and thus need not be centred. In certain microscopes, centring bolts in the<br />
lamp case allow <strong>to</strong> centre the lamp socket. After the condenser has been centred, the lamp<br />
position is adjusted until the object field is evenly and brightly illuminated.<br />
For precise Köhler illumination, the collec<strong>to</strong>r must be adjusted so that an image <strong>of</strong> the lamp<br />
filament is created in the plane <strong>of</strong> the aperture diaphragm <strong>of</strong> the condenser. This filament<br />
image can be made visible by putting tracing paper on<strong>to</strong> the aperture diaphragm. A further<br />
image <strong>of</strong> the filament is created in the upper focal plane <strong>of</strong> the objective which can be<br />
observed more conveniently in conoscopic mode.<br />
Filament images can only be observed if frosted glass inserts are removed from the<br />
illumination path!<br />
D. Adjustment <strong>of</strong> the oculars<br />
If a microscope is fitted with a binocular head, the eyepieces must be adjusted individually in<br />
order <strong>to</strong> obtain a focused image for both eyes, also after changing between different<br />
objectives. Furthermore, the oculars must be adjusted for the correct interpupillary distance,<br />
i.e. the distance between the eyes.<br />
17
Guide <strong>to</strong> Thin Section Microscopy<br />
Microscope<br />
The oculars <strong>of</strong> infinity-corrected microscopes are adjusted as follows (whereby the ocular<br />
with the crosshairs should be placed in the right tube <strong>of</strong> the binocular):<br />
(1) Look through the oculars and close the left eye. The crosshairs in the right ocular is<br />
observed with the right eye and focused with the diopter adjustment ring on this ocular. Then<br />
the object image is focused by carefully adjusting the stage height with the fine adjustment<br />
knob.<br />
(2) Now close the right eye and observe the object image with the left eye through the left<br />
ocular, without adjusting the stage vertically. If the image is not properly focused, the<br />
adjustment must be made using the diopter adjustment ring on the left ocular.<br />
When focusing the object image, it is important that both eyes are relaxed and focused <strong>to</strong><br />
infinity.<br />
1.6 Polarizer and analyzer<br />
The polarizer (polarizing filter or nicol prism) resides below the condenser. It can be swung in<br />
and out <strong>of</strong> the light path, and in many microscopes it is possible <strong>to</strong> rotate the polarizer about a<br />
vertical axis. The light source emits waves that vibrate randomly in all possible planes. The<br />
polarizing filter used in modern microscopes consists <strong>of</strong> a stretched polyvinyl film which<br />
reduces the randomly vibrating light waves <strong>to</strong> waves <strong>of</strong> a single vibration direction<br />
(polarization plane). For simplicity, the term “pol-waves” is introduced here for the planepolarized<br />
waves leaving the polarizer.<br />
When passing through the <strong>thin</strong> <strong>section</strong>, the pol-waves may undergo diverse modifications<br />
(refraction, absorption, birefringence etc., Ch. 4.2). In order <strong>to</strong> detect and quantify such<br />
modifications, the polarization plane should correspond <strong>to</strong> an easily identifiable reference<br />
direction in the field <strong>of</strong> view. In modern microscopes, the reference direction for the lower<br />
polarizer is E-W, parallel <strong>to</strong> the “horizontal” crosshair. There are microscopes, however,<br />
where the orientation <strong>of</strong> the polarizers is different (lower polarizer N-S, analyzer E-W).<br />
Specific optical-microscopic phenomena relate directly <strong>to</strong> the polarizer orientation (such as<br />
pleochroism and relief change, where the vibration direction <strong>of</strong> the lower polarizer provides<br />
the reference direction in the field <strong>of</strong> view).<br />
Raith, Raase & Reinhardt – February 2012<br />
Therefore, apart from ensuring that the polarizers are aligned, the general orientation <strong>of</strong> the<br />
polarizers must be known <strong>to</strong> the opera<strong>to</strong>r before starting <strong>to</strong> work on <strong>thin</strong> <strong>section</strong>s. This routine<br />
check may be performed with a colored <strong>to</strong>urmaline crystal, whether as a loose grain or as a<br />
prismatic <strong>section</strong> in <strong>thin</strong> <strong>section</strong>. The maximum absorption will be observed if the c-axis is<br />
oriented perpendicular <strong>to</strong> the polarizer direction (Fig. 1-10). The same check can be done with<br />
biotite in <strong>section</strong>s roughly orthogonal <strong>to</strong> (001). Biotite is a common mineral in many rocks,<br />
and thus <strong>thin</strong> <strong>section</strong>s containing biotite should be easily available. Biotite in <strong>section</strong>s roughly<br />
orthogonal <strong>to</strong> (001) displays its prominent cleavage and shows its maximum absorption (i.e.<br />
deepest color) if its basal plane (001) or cleavage is sub-parallel <strong>to</strong> the lower polarizer<br />
direction (Fig. 1-10). Biotite should not be used for alignment, though, as it is monoclinic.<br />
The angles between its (001) plane and any <strong>of</strong> the crosshairs may be close <strong>to</strong> zero, but it can<br />
also deviate by as much as 10°, depending on composition.<br />
18
Guide <strong>to</strong> Thin Section Microscopy<br />
Microscope<br />
In this <strong>guide</strong>book, we generally assume that the lower polarizer is oriented E-W. In microscopes<br />
where it is N-S, a rotation <strong>of</strong> directions by 90˚ would apply <strong>to</strong> certain descriptions,<br />
sketches and pho<strong>to</strong>graphs in chapters 4.2.1 and 4.2.3 (e.g., pho<strong>to</strong>micrographs <strong>of</strong> Figs. 4-11 <strong>to</strong><br />
4-17, Figs. 4-22 <strong>to</strong> 4-26).<br />
The analyzer (polarizing filter or nicol prism) is used <strong>to</strong> analyse the modifications the polwaves<br />
have experienced in the <strong>thin</strong> <strong>section</strong> (Ch. 4.2). It is positioned between the objective<br />
and the ocular, and is either pushed or swung in<strong>to</strong> the tube below the Amici-Bertrand lens.<br />
The polarization plane <strong>of</strong> the analyzer must be perpendicular <strong>to</strong> that <strong>of</strong> the lower polarizer<br />
(i.e., N-S if the lower polarizer direction is E-W).<br />
Although microscopes should always be in proper working order, a routine check for<br />
alignment <strong>of</strong> polarizers and crosshairs should be performed if extinction positions are critical<br />
(e.g., when measuring extinction angles). This can be done by putting a strongly elongate<br />
mineral with well-developed, straight prism faces under crossed polarizers. Suitable are all<br />
minerals <strong>of</strong> orthorhombic or higher symmetry with interference colors <strong>of</strong> at least higher first<br />
order (e.g., sillimanite, orthoamphibole, <strong>to</strong>urmaline). If both polarizers and the ocular<br />
crosshairs are properly aligned, such crystals will be completely black when positioned<br />
exactly parallel <strong>to</strong> one <strong>of</strong> the crosshairs (Fig.1-11). If polarizers are out <strong>of</strong> alignment, the<br />
procedures below can be followed <strong>to</strong> rectify the problem. The crosshairs in modern<br />
microscopes are mechanically fixed. Potential misalignment <strong>of</strong> the polarizers can occur either<br />
due <strong>to</strong> both polarizers being rotated with respect <strong>to</strong> the crosshairs (i.e., crystals as in Fig. 1-11<br />
turn black under crossed polarizers, but there is an angle between the prism faces and the<br />
crosshairs), or the polarizers are not at precisely 90° <strong>to</strong> each other (i.e., the crystals will not<br />
turn completely black when rotated). The latter is more common as either <strong>of</strong> the two<br />
polarizers is in a fixed position in most standard-fitted microscopes. Hence, only one <strong>of</strong> the<br />
two can be easily adjusted. Nevertheless, the possibility remains that a fixed polarizing filter<br />
is misaligned in its casing.<br />
Raith, Raase & Reinhardt – February 2012<br />
To align the polarization plane <strong>of</strong> the polarizer (= vibration direction <strong>of</strong> the pol-wave) with<br />
the E-W thread <strong>of</strong> the crosshairs, a grain mount <strong>of</strong> fine, deeply coloured <strong>to</strong>urmaline needles<br />
can be used. These needles must lie exactly in the <strong>thin</strong> <strong>section</strong> plane, which is easier <strong>to</strong><br />
achieve using loose grains than trying <strong>to</strong> find that orientation in a rock <strong>thin</strong> <strong>section</strong>. First, a<br />
<strong>to</strong>urmaline needle is aligned with its c-axis parallel <strong>to</strong> the N-S direction <strong>of</strong> the crosshairs and<br />
then the polarizer rotated until the needle shows maximum absorption (in the same way as<br />
shown in the <strong>thin</strong> <strong>section</strong> pho<strong>to</strong>graph <strong>of</strong> Fig. 1-10, left side). For this procedure, the analyzer<br />
is kept out <strong>of</strong> the light path.<br />
Explanation: Tourmaline is a strongly dichroic mineral (dichroism, Ch. 4). Maximum<br />
absorption occurs perpendicular <strong>to</strong> the c-axis, i.e. in the vibration direction <strong>of</strong> the O-wave.<br />
Caution! Ensure that the adjusted position <strong>of</strong> the polarizer is not changed afterwards. If the<br />
microscope has a rotatable polarizer, the correct position can be marked on the holder or, if<br />
necessary, be fixed with adhesive tape.<br />
19
Guide <strong>to</strong> Thin Section Microscopy<br />
Microscope<br />
Figure 1-10. Routine check <strong>of</strong> lower polarizer orientation using <strong>to</strong>urmaline or biotite. In<br />
microscopes where the polarizer is oriented N-S, the directions <strong>of</strong> maximum absorption <strong>of</strong> the<br />
two minerals are rotated 90° with respect <strong>to</strong> the positions shown here.<br />
Once the polarizer is properly oriented, the polarization plane <strong>of</strong> the analyzer is aligned with<br />
the N-S direction <strong>of</strong> the crosshairs. When inserting the analyzer in<strong>to</strong> the light path (no<br />
specimen on the stage), the field <strong>of</strong> view should appear black if the polarization direction <strong>of</strong><br />
the analyzer is oriented parallel N-S. If the field <strong>of</strong> view is not black, the analyzer must be<br />
adjusted. This adjustment can also be made using long-prismatic <strong>section</strong>s <strong>of</strong> minerals with<br />
orthorhombic or higher symmetry, as shown in Fig. 1-11. This set-up has the advantage that<br />
the precise alignment <strong>of</strong> the two polarizers and the crosshairs can be examined at the same<br />
time.<br />
Raith, Raase & Reinhardt – February 2012<br />
Rotatable analyzers allow <strong>to</strong> adjust the orientation <strong>of</strong> the polarization filter with a graduated<br />
spindle that can be locked after adjustment. In the more common swing-in or push-in<br />
analyzers, the correct position <strong>of</strong> the polarizing filter in the casing would have <strong>to</strong> be adjusted<br />
manually. As pointed out before, in many modern microscopes only one <strong>of</strong> the two polarizers<br />
can be adjusted while the orientation <strong>of</strong> either lower polarizer or analyzer is fixed.<br />
If high-magnification objectives are used for observation (without any object in the light<br />
path!) and the aperture diaphragm is open, the field <strong>of</strong> view does not appear completely black<br />
under crossed polarizers. This is caused by a rotation <strong>of</strong> the E-W vibrating pol-waves at the<br />
strongly curved surfaces <strong>of</strong> the objective lenses. Under conoscopic illumination an interference<br />
image is observed which resembles the centred optic-axis interference figure <strong>of</strong> a<br />
weakly birefringent positive uniaxial crystal (Ch. 5).<br />
20
Guide <strong>to</strong> Thin Section Microscopy<br />
Microscope<br />
Raith, Raase & Reinhardt – February 2012<br />
Figure 1-11. Testing the precise alignment <strong>of</strong> polarizer, analyzer and crosshairs with the help<br />
<strong>of</strong> prismatic <strong>section</strong>s <strong>of</strong> high-symmetry minerals.<br />
If the angle between the extinction position and either <strong>of</strong> the crosshairs is exactly 0° (as seen<br />
here), all three elements are perfectly aligned. If the lower polarizer is correctly adjusted<br />
against the crosshairs, the analyzer can be adjusted such that the extinction position <strong>of</strong> the<br />
prismatic minerals corresponds with a parallel alignment <strong>of</strong> prism faces and crosshairs. Note<br />
that the orientation <strong>of</strong> the lower polarizer (E-W vs. N-S) cannot be checked under crossed<br />
polarizers.<br />
21
Guide <strong>to</strong> Thin Section Microscopy<br />
Microscope<br />
1.7 Trouble-shooting<br />
1.7.1 Optimising the image <strong>of</strong> the specimen<br />
It is assumed that the microscope has been aligned for Köhler illumination (Ch. 1.5).<br />
(1) If the <strong>thin</strong> <strong>section</strong> can be perfectly focused with low magnification objectives (M O = 2.5 <strong>to</strong> 10),<br />
but remains out <strong>of</strong> focus when objectives <strong>of</strong> higher magnification (M O = 20, 40, 63 etc.) are used, it<br />
should be checked whether the <strong>thin</strong> <strong>section</strong> is lying on its wrong side, i.e. with the cover glass<br />
down (see free working distance <strong>of</strong> objectives, Table 1).<br />
(2) If the correctly placed <strong>thin</strong> <strong>section</strong> cannot be focused with high-magnification objectives, the<br />
cover glass is <strong>to</strong>o thick and must be replaced by a cover glass <strong>of</strong> the standard thickness <strong>of</strong> 0.17<br />
mm.<br />
(3) Proper focusing may also be hampered by dusty surfaces <strong>of</strong> the optical components. The dust<br />
is best removed with a s<strong>of</strong>t and completely grease-free brush.<br />
(4) Indistinct and blurred images result when the front lenses <strong>of</strong> objectives and oculars are<br />
smudged with fingerprints resp. the grease <strong>of</strong> the eyelashes. In such cases it is advised <strong>to</strong> breathe<br />
on the lenses and then carefully clean them with a lens tissue or a lint-free paper tissue. Oily stains<br />
(e.g. by immersion liquids) are best removed with a cot<strong>to</strong>n bud dipped in ether or ethyl alcohol.<br />
Solvents, however, should be applied with caution as the lenses are mounted in synthetic resins.<br />
To avoid fingerprints on the front lenses, objectives should always be changed with the fingers on<br />
the revolving turret, not on the objectives.<br />
1.7.2 Eliminating poor illumination<br />
Raith, Raase & Reinhardt – February 2012<br />
The microscope alignment for Köhler illumination ensures a perfect, evenly illuminated field <strong>of</strong><br />
view (Ch. 1.5). However, problems may still be encountered with the quality <strong>of</strong> illumination.<br />
If the field <strong>of</strong> view is unevenly or not at all illuminated, although the light source is working and<br />
the field diaphragm illuminated, potential causes <strong>of</strong> such problems in the substage assembly are:<br />
(a) The front lens <strong>of</strong> the condenser or an extra lens below the condenser have not been properly<br />
put in<strong>to</strong> or out <strong>of</strong> the optical pathway. As a result, the lens mounts may partially or completely<br />
block the light beam.<br />
(b) Filters are not correctly positioned.<br />
(c) When using low-magnification objectives for observation, the field <strong>of</strong> view will be poorly<br />
illuminated if either the field diaphragm is closed down, the condenser is in a high position, or the<br />
front lens <strong>of</strong> the condenser is in the light path.<br />
The sub-stage illumination is perfectly adjusted if the <strong>thin</strong> <strong>section</strong>, when viewed sideways from<br />
the <strong>to</strong>p, shows an evenly and brightly illuminated round field which can be enlarged or reduced in<br />
size by opening or closing the field diaphragm.<br />
If the image <strong>of</strong> the <strong>thin</strong> <strong>section</strong> remains imperfect when viewed through the oculars, the causes for<br />
poor illumination must be sought in the tube part <strong>of</strong> the microscope. The light path may be<br />
partially or completely blocked if:<br />
(a) The revolving nosepiece was not properly mounted on the microscope stand or an objective<br />
has not clicked in<strong>to</strong> place after a change <strong>of</strong> magnification.<br />
22
Guide <strong>to</strong> Thin Section Microscopy<br />
Microscope<br />
(b) An accessory plate has not been fully inserted in<strong>to</strong> the tube.<br />
(c) The analyzer has not been fully inserted (swung-in) or removed (swung-out).<br />
(d) The Amici-Bertrand lens has been partially swung-in (out).<br />
(e) An accessory magnification lens (e.g. Op<strong>to</strong>var <strong>of</strong> the Zeiss Pho<strong>to</strong>microscope) has not<br />
properly clicked in<strong>to</strong> position.<br />
1.7.3 Sources <strong>of</strong> error in the crossed-polarizers mode<br />
(a) In a <strong>thin</strong> <strong>section</strong> <strong>of</strong> standard thickness (25µm) quartz and feldspar grains show first-order<br />
grey-white interference colours. If instead brownish-white shades are observed, the<br />
polarizers are not precisely adjusted, i.e. their polarizing planes are not oriented<br />
perpendicular <strong>to</strong> one another. Hence, polarizer and analyzer must be adjusted following the<br />
instructions given in Ch. 1.6.<br />
(b) If the quartz and feldspars grains show blue-green and orange-red interference colours<br />
instead <strong>of</strong> the first-order grey-white colours, the first-order red plate (λ-plate) resides in the<br />
light path (cf. accessory plates, Ch. 4.2.4).<br />
(c) The crosshairs (or crossed micrometer) must be precisely oriented N-S and E-W. For this<br />
purpose the tube has two slots in<strong>to</strong> which the notch on the ocular casing fits. These allow <strong>to</strong><br />
fix the ocular with its crosshairs in the standard N-S–E-W orientation or, if needed, in a 45°<br />
diagonal orientation.<br />
1.7.4 Microscope care and maintenance<br />
The microscope should be kept in a dry labora<strong>to</strong>ry and should not be exposed <strong>to</strong> direct<br />
sunlight. In humid climates, the labora<strong>to</strong>ry should be air-conditioned.<br />
To prevent the microscope from collecting dust, it must be under a suitable protective cover<br />
if not in use. Even if properly protected, dust will accumulate on the equipment eventually.<br />
Hence, the surfaces <strong>of</strong> the optically effective systems such as illumination set-up, filters,<br />
polarizer, condenser lenses and ocular need <strong>to</strong> be cleaned every few days with a s<strong>of</strong>t brush.<br />
For longer periods <strong>of</strong> non-use, it is advisable <strong>to</strong> s<strong>to</strong>re microscopes in a cupboard.<br />
Raith, Raase & Reinhardt – February 2012<br />
When transporting microscopes they should be kept upright, such that filters or accessory<br />
plates that are not firmly attached cannot fall <strong>of</strong>f and get potentially damaged. For longer<br />
transport, all these parts need <strong>to</strong> be removed. Furthermore, microscope manufacturers advise<br />
that the objectives should be taken <strong>of</strong>f and s<strong>to</strong>red separately, preferably in their original<br />
containers. It should be kept in mind that polarized-light microscopes are high-precision<br />
instruments, and any mishap during transport can seriously compromise the alignment <strong>of</strong><br />
the optical systems. Thus, care must be taken that the microscope is safely secured. The<br />
s<strong>to</strong>rage cabinets previously supplied with each microscope have unfortunately become a<br />
<strong>thin</strong>g <strong>of</strong> the past.<br />
The bearings <strong>of</strong> the movable parts in the microscope are lubricated. The grease tends <strong>to</strong><br />
become more viscous over time. Thus, the movable parts must be attended <strong>to</strong> by a trained<br />
precision mechanic in regular intervals. Although the lenses <strong>of</strong> modern microscopes are<br />
protected with anti-fungal coatings, the lens systems have <strong>to</strong> be cleaned regularly by a<br />
service person. Fungus growth can be a serious problem, particularly in tropical climates.<br />
23
Guide <strong>to</strong> Thin Section Microscopy<br />
Measuring angles<br />
2. Measuring angles, lengths and thicknesses<br />
2.1 Measurement <strong>of</strong> angles<br />
The determination <strong>of</strong> an unknown mineral or the determination <strong>of</strong> the composition <strong>of</strong> a solid<br />
solution may require measuring an angle between two specific linear or planar features. Such<br />
features include crystal faces, cleavage planes, twin planes and vibration directions.<br />
With the help <strong>of</strong> angles between cleavage sets, pyroxenes can be distinguished from<br />
amphiboles, for example. Of even greater importance is the determination <strong>of</strong> angles between<br />
mineral planes and optical vibration directions (Ch. 4.2.4).<br />
Angles are determined using a polarized-light microscope with a 360˚ scale on the rotating<br />
stage. Furthermore, a reference direction is required which is provided by the crosshairs in the<br />
ocular. A prerequisite for a precise measurement is exact centring <strong>of</strong> the microscope and the<br />
use <strong>of</strong> a higher-magnification objective with a small depth <strong>of</strong> field. For the determination <strong>of</strong><br />
angles between cleavage sets, the analyzer should be out <strong>of</strong> the light path.<br />
Ideally the angle between cleavage planes, crystal faces etc. is measured on a grain or a grain<br />
domain where both planes are parallel <strong>to</strong> the viewing direction. If the <strong>thin</strong> <strong>section</strong> is<br />
defocused, whereby the aperture diaphragm is partially closed <strong>to</strong> obtain a sufficiently high<br />
contrast, fringes <strong>of</strong> equal brightness appear on both sides <strong>of</strong> the traces <strong>of</strong> such planes and<br />
migrate outwards in a symmetric fashion. Such an ideal grain orientation is rarely realised in<br />
<strong>thin</strong> <strong>section</strong>, though, and it is sufficient <strong>to</strong> find grains in which the traces <strong>of</strong> the cleavage<br />
planes appear as <strong>thin</strong> dark lines.<br />
For measurement, the <strong>thin</strong> <strong>section</strong> is oriented, either by hand or using a mechanical stage,<br />
such that the inter<strong>section</strong> <strong>of</strong> the traces <strong>of</strong> the planes is in the centre <strong>of</strong> the crosshairs. By<br />
rotating the stage it can be tested whether the inter<strong>section</strong> remains centred. If it moves <strong>of</strong>fcentre<br />
the objective will need <strong>to</strong> be centred. While rotating the stage avoid pressing against it<br />
unnecessarily.<br />
Raith, Raase & Reinhardt – February 2012<br />
Next, cleavage set 1 is rotated such that is lies parallel <strong>to</strong> the N-S thread <strong>of</strong> the crosshairs.<br />
Then, the angle I is read from the vernier at the stage edge (Fig. 2-1, left). Now the<br />
microscope stage is rotated until the cleavage set 2 is parallel <strong>to</strong> the N-S thread <strong>of</strong> the<br />
crosshairs, and angle II is read from the vernier (Fig. 2-1, right). The difference between I and<br />
II is the angle in question.<br />
Note: If the 360˚ mark is crossed during the procedure, the two partial angles have <strong>to</strong> be<br />
added up.<br />
24
Guide <strong>to</strong> Thin Section Microscopy<br />
Measuring angles<br />
Figure 2-1. Measurement <strong>of</strong> the angle α between two cleavage sets<br />
The following may contribute <strong>to</strong> measuring errors:<br />
1. Mechanical <strong>to</strong>lerance <strong>of</strong> the stage<br />
2. Precision in reading the scale on the stage<br />
3. Precision in placing the traces <strong>of</strong> planes parallel <strong>to</strong> one <strong>of</strong> the crosshairs<br />
4. Precision in finding the exact extinction position, if angles are measured<br />
<strong>to</strong>wards vibration directions<br />
5. Quality <strong>of</strong> the planar elements used and their traces in the mineral grain<br />
Raith, Raase & Reinhardt – February 2012<br />
Assuming careful positioning <strong>of</strong> the traces <strong>of</strong> the planes and care in reading the scale, the<br />
cause <strong>of</strong> the largest error commonly relates <strong>to</strong> a badly defined cleavage. Particularly minerals<br />
with cleavage classified as poor or merely distinct may show cleavage traces that are either<br />
not exactly planar, or stepped, or <strong>to</strong>o short. Furthermore, the cleavage may be bent due <strong>to</strong><br />
deformation or it may host secondary minerals. During preparation, holes may form as<br />
mineral fragments break out along cleavages, or careful grinding may lead <strong>to</strong> very few<br />
cleavage planes opening up and becoming visible. Twin planes may also not follow the ideal<br />
crystallographic directions exactly.<br />
A common problem is <strong>to</strong> find a grain <strong>of</strong> ideal crystallographic orientation in a <strong>thin</strong> <strong>section</strong><br />
(the inter<strong>section</strong> line between two sets <strong>of</strong> planes being exactly vertical), and this may indeed<br />
prove <strong>to</strong> be impossible in certain cases. When using a grain with a slightly inclined<br />
orientation an error <strong>of</strong> a few degrees must be taken in<strong>to</strong> consideration.<br />
25
Guide <strong>to</strong> Thin Section Microscopy<br />
Measuring lengths<br />
2.2 Measurement <strong>of</strong> lengths<br />
The measuring <strong>of</strong> distances is necessary for the determination <strong>of</strong> grain size, length-width<br />
ratios etc. For such measurements oculars are used that have a graticule (ocular micrometer)<br />
which must be calibrated. The graticule is commonly combined with the ocular crosshairs as<br />
a horizontally or vertically oriented scale attached <strong>to</strong> the E-W or N-S threads <strong>of</strong> the crosshairs,<br />
respectively (Fig. 2-2).<br />
If objectives with increasing magnification are used, the image increases in size<br />
correspondingly. Therefore, the calibration <strong>of</strong> the graduations on the ocular scale must be<br />
carried out for each ocular-objective combination separately. The engraved magnification<br />
numbers on the objectives are only approximate values which would make a calibration based<br />
purely on calculations <strong>to</strong>o imprecise.<br />
For calibration, a specific scale is used, called an object micrometer, with a graduation <strong>of</strong> 10<br />
μm per mark; 100 graduation marks add up <strong>to</strong> 1 mm. The object micrometer is put in a<br />
central stage position and, after focusing, is placed parallel and adjacent <strong>to</strong> the ocular scale<br />
(Fig. 2-2). In example (a) 100 graduation marks <strong>of</strong> the object micrometer, adding up <strong>to</strong> 1000<br />
μm, correspond <strong>to</strong> 78 graduation marks on the ocular micrometer. At this magnification<br />
(objective 6.3x; ocular 12.5x) the distance between two graduation marks in the ocular is<br />
1000 μm divided by 78. The interval is therefore 12.8 μm. Example (b) is valid for another<br />
combination (objective 63x; ocular 12.5x).<br />
If, for example, a grain diameter needs <strong>to</strong> be determined, the number <strong>of</strong> graduation marks<br />
representing the grain diameter are counted and then multiplied by the calibration value for<br />
the particular objective-ocular combination (Fig. 2-2c).<br />
Raith, Raase & Reinhardt – February 2012<br />
The <strong>to</strong>tal error <strong>of</strong> the described procedure is a complex accumulated value. Both the object<br />
micrometer used for calibration and the ocular micrometer have a certain <strong>to</strong>lerance range.<br />
Errors occur with strongly magnifying lens systems because the image is not entirely planar,<br />
but has dis<strong>to</strong>rtions in the peripheral domains. The largest error is commonly made by the<br />
human eye when comparing object and graduation. For increased accuracy it is important <strong>to</strong><br />
use an objective with the highest possible magnification, such that the mineral grain covers a<br />
large part <strong>of</strong> the ocular scale.<br />
26
Guide <strong>to</strong> Thin Section Microscopy<br />
Measuring lengths<br />
Raith, Raase & Reinhardt – February 2012<br />
Figure 2-2. Calibration <strong>of</strong> the ocular micrometer and measurement <strong>of</strong> distances<br />
27
Guide <strong>to</strong> Thin Section Microscopy<br />
Measuring thickness<br />
2.3 Determination <strong>of</strong> <strong>thin</strong> <strong>section</strong> thickness<br />
The birefringence <strong>of</strong> anisotropic minerals can be determined in approximation by comparing<br />
the interference colours <strong>to</strong> those <strong>of</strong> the Michel-Lévy or Raith-Sørensen interference colour<br />
charts (Ch. 4.2.3), or it can be done precisely using the compensation method. For both<br />
methods the thickness <strong>of</strong> the mineral in <strong>thin</strong> <strong>section</strong> must be known. Commonly, the <strong>thin</strong><br />
<strong>section</strong> thickness is standardised <strong>to</strong> 25 resp. 30 μm. Abundant minerals such as quartz and<br />
feldspar would then show an interference colour <strong>of</strong> first-order grey <strong>to</strong> white. If these minerals<br />
are not present in the <strong>thin</strong> <strong>section</strong>, thickness is difficult <strong>to</strong> estimate for the inexperienced. In<br />
such a case, the thickness can be determined via the vertical travel <strong>of</strong> the microscope stage.<br />
For focusing the image, microscopes are equipped with focusing knobs for coarse and fine<br />
adjustment. The instruction manuals supplied by the manufacturers contain information on<br />
the vertical travel per graduation mark. This value is 2 μm for many microscopes.<br />
For measuring the thickness, an objective with high magnification and small depth <strong>of</strong> field<br />
(40x or 63x) is chosen and the surface <strong>of</strong> the cover slip is put in<strong>to</strong> focus. This surface can be<br />
recognised by the presence <strong>of</strong> dust particles. The inexperienced user may put a fingerprint<br />
on<strong>to</strong> the surface! Now the fine adjustment is turned in the appropriate direction <strong>to</strong> decrease<br />
the distance between sample and objective. Eventually, the focus plane has passed the cover<br />
slip, and the interface between the embedding medium and the minerals appears. This is<br />
recognised by the surface roughness and the grinding marks on the <strong>thin</strong> <strong>section</strong>. Reducing the<br />
distance between sample and microscope stage further, the lower surface <strong>of</strong> the <strong>thin</strong> <strong>section</strong><br />
with all its uneven features comes in<strong>to</strong> focus. The path through the <strong>thin</strong> <strong>section</strong> can also be<br />
followed along cleavage planes and inclusions. Inexperienced users should repeat this<br />
procedure a couple <strong>of</strong> times and maybe make notes about, and cross-check, the positions <strong>of</strong><br />
the various boundary surfaces using the scale at the focusing knobs.<br />
Raith, Raase & Reinhardt – February 2012<br />
For a precise determination <strong>of</strong> thickness using the upper and lower boundary surfaces <strong>of</strong> the<br />
<strong>thin</strong> <strong>section</strong>, it is necessary <strong>to</strong> turn the focal adjustment in one direction only, eliminating the<br />
mechanical backlash. If the thickness from the lower <strong>to</strong> the upper surface is measured, the<br />
starting position <strong>of</strong> the focal plane must be in the 1 mm thick glass slide. If moving in the<br />
reverse sense, the starting position must be in the 0.17 mm thick cover glass above the<br />
mineral surface.<br />
The number <strong>of</strong> graduation marks by which the fine adjustment is turned in order <strong>to</strong> shift the<br />
focus from the lower <strong>to</strong> the upper boundary surface (or in the reverse direction) multiplied by<br />
the value given per graduation mark (e.g., 2 μm) results in a vertical travel distance h in μm.<br />
However, this distance is commonly not the true thickness <strong>of</strong> the <strong>section</strong>.<br />
28
Guide <strong>to</strong> Thin Section Microscopy<br />
Measuring thickness<br />
Due <strong>to</strong> light refraction against air, both boundary surfaces <strong>of</strong> the mineral in the <strong>thin</strong> <strong>section</strong><br />
are not observed in their true position. The apparent position <strong>of</strong> the lower surface is<br />
influenced further by the refractive index <strong>of</strong> the mineral (Fig. 2-3, <strong>to</strong>p).<br />
The thickness is thus: d = n crystal / n air * ∆h<br />
whereby ∆h, the vertical distance, is measured in number <strong>of</strong> graduation marks. The refraction<br />
index <strong>of</strong> the mineral should be known at least <strong>to</strong> the first decimal, which can be easily<br />
estimated.<br />
For quartz, an example could be: d = 1.55/1.00 * 8.5<br />
If one graduation mark corresponds <strong>to</strong> 2 μm, the result for the <strong>thin</strong> <strong>section</strong> thickness is:<br />
d = 1.55/1.00 * 8.5 * 2 μm = 26.35 μm.<br />
Calibration <strong>of</strong> travel<br />
If the vertical travel is not known or maybe modified from extensive use <strong>of</strong> the microscope, it<br />
has <strong>to</strong> be calibrated. To this end, a cover glass is broken in two, and the thickness <strong>of</strong> the glass<br />
is determined near the broken edge with a micrometer <strong>to</strong>ol. Such devices are available in<br />
every mechanical workshop. The cover glass fragment is then put on<strong>to</strong> a glass slide, with the<br />
fracture in the centre <strong>of</strong> view. Depending on the orientation <strong>of</strong> the fracture surface, there are<br />
two ways <strong>of</strong> calibration which should lead <strong>to</strong> the same result (Fig. 2-3a,b):<br />
a) d = ∆h<br />
b) n = n glass ~ 1.5; d = ∆h * 1.5 (see above)<br />
If the thickness <strong>of</strong> the cover glass measured with the micrometer <strong>to</strong>ol was 168.4 μm, and the<br />
travel was 67.3, respectively 44.9, graduation marks, the calibration value per graduation<br />
mark would be<br />
Raith, Raase & Reinhardt – February 2012<br />
in case a) 168.4 μm / 67.3 = 2.5 μm;<br />
in case b) 168.4 μm / 44.9 / 1.5 (n glass ) = 2.5 μm.<br />
The calibration error can have a number <strong>of</strong> sources. Mechanical <strong>to</strong>lerances <strong>of</strong> the micrometer<br />
and the microscope are normally small in comparison <strong>to</strong> observational errors in determining<br />
the different positions <strong>of</strong> the boundary surfaces. This error may be established from a series<br />
<strong>of</strong> measurements.<br />
29
Guide <strong>to</strong> Thin Section Microscopy<br />
Measuring thickness<br />
Figure 2-3. Calibration <strong>of</strong> vertical travel and measurement <strong>of</strong> thickness<br />
Raith, Raase & Reinhardt – February 2012<br />
30
Guide <strong>to</strong> Thin Section Microscopy<br />
Crystal shape and symmetry<br />
3. Morphological properties<br />
3.1 Grain shape and symmetry<br />
Natural minerals as well as synthetic crystalline phases show a considerable variety <strong>of</strong> crystal<br />
forms. The symmetry <strong>of</strong> the "outer" crystal form <strong>of</strong> a specific mineral species is an expression<br />
<strong>of</strong> the symmetry <strong>of</strong> the "inner" a<strong>to</strong>mic structure. According <strong>to</strong> their symmetry characteristics<br />
all known crystalline phases can be assigned <strong>to</strong> one <strong>of</strong> the seven groups <strong>of</strong> symmetry (=<br />
crystal systems) (Fig. 3-1).<br />
Combination <strong>of</strong> crystal faces: Depending on growth conditions, a mineral species can occur<br />
in different crystal forms through combinations <strong>of</strong> different crystal faces. Fig. 3-2 shows<br />
examples <strong>of</strong> the variety <strong>of</strong> crystal forms <strong>of</strong> natural occurring olivine and augite.<br />
Habit: Crystals may also have different proportions, even if they have the same crystal faces<br />
developed. That means they differ in the relative size <strong>of</strong> crystal faces <strong>to</strong> each other. Figure 3-3<br />
shows crystals <strong>of</strong> different habit using the examples spinel, garnet, sodalite and leucite (all<br />
equant), melilite, mica (flaky, platy <strong>to</strong> short-columnar) and clinopyroxene and amphibole<br />
(acicular, prismatic).<br />
Crystal form: Euhedral crystals, which are crystals completely bound by rational crystal<br />
faces reflect unobstructed growth (such as crystallisation in a melt, Fig. 3-4, or in amygdales,<br />
caverns, pores etc.), or they form if a particular mineral has the tendency <strong>to</strong> impose its crystal<br />
shape and faces on<strong>to</strong> the adjacent, "weaker" ones (crystalloblastic series; Fig. 3-4).<br />
Subhedral and anhedral grain shapes are observed if the mineral’s characteristic shape could<br />
only develop partly (Fig. 3-5), or not at all, if thermally induced annealing creates polycrystalline<br />
grain aggregates (Fig. 3-6), or if dissolution or melting processes lead <strong>to</strong> a<br />
"rounding" <strong>of</strong> crystal edges.<br />
Fast crystallization from a melt can produce skeletal crystals or hollow shapes (Fig. 3-7).<br />
Minute feathery, dendritic or acicular crystals grow in undercooled melt (glass) (Fig. 3-8).<br />
Raith, Raase & Reinhardt – February 2012<br />
In the two-dimensional <strong>thin</strong> <strong>section</strong> image, the 3-D crystal shape <strong>of</strong> a mineral species has <strong>to</strong><br />
be deduced from the outlines <strong>of</strong> the different crystal cross-<strong>section</strong>s (Fig. 3-9). For the rockforming<br />
minerals, the schematic crystal drawings in the tables <strong>of</strong> Tröger et al. (1979) may be<br />
used as a reference. Fig. 3-10 shows the correlation between crystal shape and crystal <strong>section</strong>s<br />
for a member <strong>of</strong> the clinopyroxene group.<br />
31
Guide <strong>to</strong> Thin Section Microscopy<br />
Crystal shape and symmetry<br />
Raith, Raase & Reinhardt – February 2012<br />
Figure 3-1. Crystal systems<br />
32
Guide <strong>to</strong> Thin Section Microscopy<br />
Crystal shape and symmetry<br />
Raith, Raase & Reinhardt – February 2012<br />
Figure 3-2. Variety <strong>of</strong> crystal forms shown by single mineral species through combinations <strong>of</strong><br />
different crystal faces, as seen in augite and olivine<br />
33
Guide <strong>to</strong> Thin Section Microscopy<br />
Crystal shape and symmetry<br />
Raith, Raase & Reinhardt – February 2012<br />
Figure 3-3. Habit <strong>of</strong> crystals<br />
34
Guide <strong>to</strong> Thin Section Microscopy<br />
Crystal shape and symmetry<br />
Figure 3-4. Euhedral grain shape<br />
A: Augite (basalt). B: Sanidine (trachyte). C: Zircon (syenite pegmatite). D: Plagioclase (basalt). E: Garnet<br />
(garnet-kyanite micaschist). F: Leucite (foidite).<br />
Figure 3-5. Subhedral grain shape<br />
A: Amphibolite. B: Biotite-muscovite schist;. C: Olivine in basalt.<br />
Raith, Raase & Reinhardt – February 2012<br />
Figure 3-6. Anhedral grain shape<br />
Granoblastic textures <strong>of</strong> quartzite (A <strong>to</strong> C), marble (D), anorthosite (E) and fayalite fels (F).<br />
35
Guide <strong>to</strong> Thin Section Microscopy<br />
Crystal shape and symmetry<br />
Figure 3-7. Skeletal crystal shapes<br />
A: Olivine (basalt). B, C, D: Diopside, ferriclinopyroxene and kirschsteinite (slags). E: A<strong>to</strong>ll garnet (gneiss).<br />
F: Quartz in microcline (graphic granite).<br />
Raith, Raase & Reinhardt – February 2012<br />
Figure 3-8. Spherulitic, dendritic and radiating crystals<br />
A: Chlorite spherulites (charnockite). B: Spherules <strong>of</strong> radiating zeolite showing Brewster crosses (limburgite;<br />
+Pol). C: Spherules (obsidian, Lipari). D: Dendritic devitrification domains (basalt). E: Fan-shaped spherulitic<br />
devitrification (obsidian, Arran). F: Microlites with dendritic, fan-shaped devitrification domains (obsidian,<br />
Arran). G: Chalcedony (agate). H: Baryte rosettes with Brewster crosses. I: Anhydrite rosette (anhydrite,<br />
Zechstein).<br />
36
Guide <strong>to</strong> Thin Section Microscopy<br />
Crystal shape and symmetry<br />
Raith, Raase & Reinhardt – February 2012<br />
Figure 3-9. Sections <strong>of</strong> euhedral crystals<br />
37
Guide <strong>to</strong> Thin Section Microscopy<br />
Crystal shape and symmetry<br />
Raith, Raase & Reinhardt – February 2012<br />
Figure 3-9 contd.. Sections <strong>of</strong> euhedral crystals<br />
38
Guide <strong>to</strong> Thin Section Microscopy<br />
Crystal shape and symmetry<br />
Raith, Raase & Reinhardt – February 2012<br />
010<br />
Figure 3-10. Relation between crystal form and cross-<strong>section</strong>s using the example <strong>of</strong> clinopyroxene<br />
(titanaugite). Plane-polarized light<br />
39
Guide <strong>to</strong> Thin Section Microscopy<br />
Cleavage and fracture<br />
3.2 Cleavage, fracture, deformation and recrystallization phenomena<br />
Cleavage<br />
Many minerals split preferentially along one or more directions. This is called cleavage. Through<br />
the application <strong>of</strong> mechanical force - whether related <strong>to</strong> geological processes or <strong>to</strong> <strong>thin</strong> <strong>section</strong><br />
preparation - crystallographically defined planar fractures can be generated in mineral grains. The<br />
abundance and quality <strong>of</strong> cleavage are mineral-specific, but also depend on the level <strong>of</strong> mechanical<br />
stress the mineral grains were subjected <strong>to</strong>. Cleavage follows crystallographic planes that are<br />
characterized by weak bonding and thus reflects a specific crystal structure. Examples are sheet<br />
silicates with their prominent basal cleavage and chain silicates showing two prismatic cleavage<br />
sets, but no basal cleavage (Fig. 3-11 A-C). It is quite common that cleavage planes have an orientation<br />
parallel <strong>to</strong> dominant crystal faces (Fig. 3-11 A-D,F). However, this cannot be generalized<br />
(Fig. 3-11 E).<br />
In mineral cross-<strong>section</strong>s cleavage is recognised as – in the ideal case – straight traces <strong>of</strong> planes<br />
dissecting the grain. If the cleavage planes are oriented parallel <strong>to</strong> the viewing direction they<br />
appear as <strong>thin</strong> dark lines. With increasing tilt <strong>of</strong> the cleavage planes the lines broaden and the<br />
traces appear increasingly blurry. If the cleavage orientation is at a small angle <strong>to</strong> <strong>thin</strong> <strong>section</strong><br />
plane, cleavage traces may not be observed.<br />
Cleavage, and also the absence <strong>of</strong> cleavage (e.g., quartz, staurolite), is an important morphological<br />
property for mineral identification. The number <strong>of</strong> cleavage sets and the specific angles<br />
between them can be distinctive for mineral species and also entire mineral groups (pyroxenes,<br />
amphiboles, etc.). It should be noted that the <strong>of</strong>ten cited cleavage angles that are critical for specific<br />
Raith, Raase & Reinhardt – February 2012<br />
Figure 3-11. Cleavage<br />
A: Augite− Section orthogonal <strong>to</strong> the c axis. The {110} cleavage planes form angles <strong>of</strong> 87˚ and 93˚. B: Hornblende−<br />
Section orthogonal <strong>to</strong> the c axis. The {110} cleavage planes form angles <strong>of</strong> 56˚ and 124˚. C: Biotite− Section<br />
orthogonal <strong>to</strong> the perfect cleavage (001).<br />
D: Kyanite− Section approximately orthogonal <strong>to</strong> c shows the typical pattern <strong>of</strong> very good cleavage (100) and distinct<br />
cleavage (010). E: Sillimanite− The <strong>section</strong> orthogonal <strong>to</strong> c shows the good cleavage (010). F: Andalusite− Section<br />
orthogonal <strong>to</strong> the c axis. The good {110} cleavage planes intersect at almost right angles.<br />
40
Guide <strong>to</strong> Thin Section Microscopy<br />
Cleavage and fracture<br />
minerals can only be observed in appropriate <strong>section</strong>s (Fig. 3-11 A,B). Once the common axis<br />
between two cleavage sets is tilted, the angles <strong>of</strong> the cleavage traces do no longer correspond <strong>to</strong><br />
those between the respective planes. For prismatic cleavage sets this common axis is normally c.<br />
Thus, cleavage can also provide clues <strong>to</strong> the orientation <strong>of</strong> mineral grains in <strong>thin</strong> <strong>section</strong>. For<br />
example, amphibole crystals in basal <strong>section</strong>s (about orthogonal <strong>to</strong> c) show two intersecting<br />
cleavage sets, whereas prismatic <strong>section</strong>s (parallel <strong>to</strong> c) show apparently one cleavage only (Figs. 3-<br />
11 B, 4-15 – 4-17). Factually, these parallel cleavage traces derive from the two intersecting {110}<br />
sets which cannot be readily distinguished in prismatic <strong>section</strong>s. In other words, the arrangement <strong>of</strong><br />
cleavage traces in amphiboles (as well as pyroxenes) can be used <strong>to</strong> identify basal and prismatic<br />
<strong>section</strong>s, in combination with other criteria such as birefringence and, if the minerals are coloured,<br />
pleochroism.<br />
Fracture<br />
Many minerals show poor cleavage only or no cleavage at all. If exposed <strong>to</strong> external mechanical<br />
stress or internal stress during rapid cooling such mineral grains develop irregular fractures. These<br />
may still have a preferred orientation (Fig. 3-12).<br />
Cleavage and fracturing are dependent on grain size. Minerals forming small grains commonly<br />
show neither cleavage nor fracture.<br />
Raith, Raase & Reinhardt – February 2012<br />
Figure 3-12. Fracture<br />
A: Perlite− Due <strong>to</strong> quenching <strong>of</strong> the glassy material (obsidian) concentrically curved tension cracks developed.<br />
B: Nepheline− Irregular tension cracks caused by rapid cooling. C: Pyrope− Radial cracks emanating from<br />
coesite inclusions now largely transformed <strong>to</strong> quartz. The cause <strong>of</strong> the fracturing is the volume increase from the<br />
coesite-quartz transformation, resulting in increased pressure imposed on the garnet host.<br />
D: Garnet− Fracture planes oriented parallel <strong>to</strong> narrow-spaced jointing in a basic granulite. E: Garnet− Irregular<br />
cracks predating the resorption by orthopyroxene+cordierite symplectite. F: Olivine− The irregular cracks<br />
document brittle behaviour <strong>of</strong> the forsterite grain during plastic deformation <strong>of</strong> the calcite matrix.<br />
41
Guide <strong>to</strong> Thin Section Microscopy<br />
Cleavage and fracture<br />
Deformation and recrystallization<br />
Minerals in metamorphic rocks respond in different ways <strong>to</strong> tec<strong>to</strong>nic stress, depending on prevailing<br />
temperature conditions, deformation rates, level <strong>of</strong> differential stress and presence or<br />
absence <strong>of</strong> fluids. Generally speaking, minerals at low temperatures tend <strong>to</strong> show brittle<br />
behaviour, whereas they deform plastically at high temperature. The temperatures <strong>of</strong> the<br />
transition between brittle and plastic behaviour are mineral-specific (about 300˚C for quartz,<br />
400-500˚C for feldspars, at deformation rates that are typical for orogenic processes).<br />
Figure 3-13 shows typical microstructures produced through brittle deformation at low<br />
temperature. At the brittle-ductile transition, mineral grains may show features <strong>of</strong> both brittle<br />
(fracturing, cataclasis) and plastic behaviour (undulose extinction, kinking, bending).<br />
Figure 3-13. Brittle deformation behaviour <strong>of</strong> mineral grains<br />
A: Domino-style fracturing <strong>of</strong> sillimanite crystal. B: Cataclastic deformation <strong>of</strong> quartz. C: Broken and kinked<br />
glaucophane crystals in micr<strong>of</strong>old. D: Cataclastic deformation <strong>of</strong> plagioclase. E,F: Microboudinage <strong>of</strong> biotite<br />
and <strong>to</strong>urmaline. The open fractures are filled with quartz.<br />
(Pho<strong>to</strong>micrographs − B: Michael Stipp, IFM-Geomar Kiel; E,F: Bernardo Cesare, University <strong>of</strong> Padova)<br />
Raith, Raase & Reinhardt – February 2012<br />
In the polarized-light microscope, plastic crystal deformation is indicated where mineral<br />
grains show bending or kinking <strong>of</strong> normally planar morphological elements such as cleavage,<br />
rational crystal faces or twin planes (Fig. 3-14). The continuous or discontinuous change <strong>of</strong><br />
crystal lattice orientation wi<strong>thin</strong> a single mineral grain corresponds <strong>to</strong> a gradual or abrupt<br />
shift <strong>of</strong> the extinction position as the microscope stage is turned. Even where distinct morphological<br />
elements are lacking (as in quartz), deformation can be recognised from the nonuniform<br />
extinction positions <strong>of</strong> different domains wi<strong>thin</strong> a grain (Fig. 3-14 J,L). These deformation<br />
features are caused by stress-induced intracrystalline processes such as dislocation<br />
glide and dislocation creep. Plastic deformation <strong>of</strong> crystal lattices may be continuous over a<br />
mineral grain or affect discrete grain domains only. Deformation lamellae or translation<br />
lamellae may form along defined glide planes (Fig. 3-14 K; 3-15 H).<br />
42
Guide <strong>to</strong> Thin Section Microscopy<br />
Cleavage and fracture<br />
Figure 3.2-3: Deformation and recrystallisation phenomena<br />
Raith, Raase & Reinhardt – February 2012<br />
Figure 3-14. Plastic deformation <strong>of</strong> mineral grains (bending, kinking and deformation<br />
lamellae)<br />
A-C: Strongly deformed crystals with bent twin lamellae (albite, plagioclase, calcite). D-F: Bent and<br />
kinked crystals (mica, orthopyroxene, glaucophane). G: Strongly kinked phlogopite. H: Olivine with<br />
kink bands. I: Kyanite with kink bands. J: Quartz with undula<strong>to</strong>ry extinction K: Quartz showing bent<br />
translation lamellae on (0001). L: Deformed cordierite showing undula<strong>to</strong>ry extinction and pinitized<br />
margins. (Pho<strong>to</strong>micrographs B,K: Jörn Kruhl, TU München)<br />
43
Guide <strong>to</strong> Thin Section Microscopy<br />
Cleavage and fracture<br />
Figure 3.2-3: Deformation and recrystallisation phenomena<br />
Figure 3-15. Plastic deformation and recrystallization <strong>of</strong> quartz<br />
A,B: Subgrain domains that are elongate parallel <strong>to</strong> c. D: Chess board pattern. D,E: Partially<br />
recrystallized grains showing subgrain domains. F: Static recrystallization <strong>of</strong> the marginal domain <strong>of</strong> a<br />
turbid quartz crystal. G,H: Platy quartz in a recrystallized matrix <strong>of</strong> quartz + feldspar (felsic granulite).<br />
I: Strongly flattened quartz with serrated grain boundaries.<br />
(Pho<strong>to</strong>micrographs - E: Rainer Kleinschrodt, Universität Köln; F,I: Jörn Kruhl, TU München)<br />
Raith, Raase & Reinhardt – February 2012<br />
Deformation by mechanical twinning is restricted <strong>to</strong> certain minerals (e.g., plagioclase,<br />
calcite). As opposed <strong>to</strong> growth twins, deformation twins typically show a wedge-shaped<br />
outline (Fig. 3-16 A,B,I).<br />
As the deformation process proceeds, dislocation migration and accumulation <strong>of</strong> dislocations<br />
along preferred zones (subgrain boundaries) wi<strong>thin</strong> a mineral grain can lead <strong>to</strong> the formation<br />
<strong>of</strong> aggregates <strong>of</strong> dislocation-poor crystal domains (subgrains; Fig. 3-15 A-E, Fig. 3-16<br />
D,F,G,H). The crystal lattice between adjacent subgrains is tilted by a few degrees only (lowangle<br />
grain boundaries). Between crossed polarizers a distinctly discontinuous change in the<br />
direction <strong>of</strong> extinction can be observed. (domainal undula<strong>to</strong>ry extinction). Subgrain formation<br />
is particularly common in quartz, but also observed in other minerals. (Fig. 3-16, D,F,G,H). In<br />
quartz, subgrain domains may be elongate in the crystallographic c direction (Fig. 3-15<br />
A,B,D,E). Cross-cutting subgrain patterns do also occur (chess-board pattern; Fig. 3-15 C).<br />
44
Guide <strong>to</strong> Thin Section Microscopy<br />
Cleavage and fracture<br />
Figure 3.2-3: Deformation and recrystallisation phenomena<br />
Figure 3-16. Plastic deformation and recrystallization<br />
A,B: Deformed and partially recrystallized plagioclase crystals. C: Deformed and partially recrystallized<br />
orthoclase. D,E: Deformed cordierite showing a chessboard subgrain structure, partially recrystallized <strong>to</strong> a<br />
polygonal granular aggregate. F: Subgrain domains in sillimanite. G: Subgrain pattern in glaucophane. H: Bent<br />
calcite showing undula<strong>to</strong>ry extinction and subgrain formation. I: Calcite with lamellar deformation twins,<br />
partially recrystallized statically <strong>to</strong> form a fine-grained polygonal aggregate.<br />
Raith, Raase & Reinhardt – February 2012<br />
Plastically deformed crystals tend <strong>to</strong> recrystallize at high temperatures, whereby crystal<br />
defects are eliminated. Recrystallized crystals are typically smaller-grained than the original<br />
deformed grains. The individual recrystallized grains show even extinction under crossed<br />
polarizers and have high-angle grain boundaries with the adjacent new grains. Recrystallized<br />
grains may have lobate <strong>to</strong> straight grain boundaries (Fig. 3-15 D,F,H; Fig. 3-16 B,C,I). Twin<br />
lamellae or inclusions contained in the large deformed crystal are commonly not preserved in<br />
the smaller recrystallized grain aggregate (Fig. 3-15 F; Fig. 3-16 E,I).<br />
Recrystallization <strong>of</strong> deformed crystals may occur while deformation is active, or under static<br />
conditions. Typical for dynamic recrystallization is a side-by-side occurrence <strong>of</strong> larger grains<br />
showing undula<strong>to</strong>ry extinction or subgrain structures and domains <strong>of</strong> finer-grained recrystallized<br />
material (Fig. 3-15 G-I). At high temperatures a relatively large grain-size spectrum and<br />
strongly curved or embayed grain boundaries are commonly observed.<br />
45
Guide <strong>to</strong> Thin Section Microscopy<br />
Cleavage and fracture<br />
Static recrystallization typically produces relatively even-grained aggregates <strong>of</strong> undeformed<br />
grains with straight grain boundaries (recovery texture). Minerals with no pronounced<br />
inherent shape anisotropy (e.g., quartz, calcite, feldspar) tend <strong>to</strong> form polygonal aggregates <strong>of</strong><br />
equant grains (Fig. 3-17). Evidence for post-deformative recrystallization <strong>of</strong> minerals with a<br />
pronounced shape anisotropy (e.g., micas, amphiboles) is perhaps best observed in rocks<br />
where such minerals occur in an originally planar arrangement that had been subjected <strong>to</strong> later<br />
folding. Recovery <strong>of</strong> the deformed grains in micr<strong>of</strong>old hinges leads <strong>to</strong> the formation <strong>of</strong> socalled<br />
polygonal arcs (Fig. 3-18).<br />
Figure 3-17: Static recrystallization and annealing<br />
A-C: Granoblastic-polygonal grain aggregates generated by high-temperature (granulite-facies) static<br />
recrystallization or annealing. Garnet (A), spinel (B), orthopyroxene (C), plagioclase (D), quartz (E), calcite (F).<br />
Raith, Raase & Reinhardt – February 2012<br />
Figure 3-18: Static recrystallization <strong>of</strong> minerals with a strong shape anisotropy<br />
A-C: Static recrystallization in micr<strong>of</strong>old hinges ("polygonal arcs"). Mica (A), chlorite (B), amphibole (C).<br />
46
Guide <strong>to</strong> Thin Section Microscopy<br />
Twinning<br />
3.3. Twinning<br />
Twins are generated through crystal-structure-controlled intergrowths <strong>of</strong> two or more<br />
individual crystal segments with a defined symmetrical relationship. Twinning can also result<br />
from deformation (as in calcite). The individual parts <strong>of</strong> a twinned mineral are intergrown<br />
such that they either mirror each other's orientation (the mirror plane being the twin plane), or<br />
they are rotated against each other by a specific angle (the rotation axis being the twin axis),<br />
or both. The twin interface commonly corresponds <strong>to</strong> the twin plane.<br />
For many mineral species twinning is an important property for identification. There are<br />
different kinds <strong>of</strong> twinning such as contact twins, penetration twins, simple twins, multiple<br />
twins, polysynthetic (or lamellar) twins (Fig. 3-19).<br />
In <strong>thin</strong> <strong>section</strong>, twinning is commonly easily recognised under crossed polarizers if the<br />
mineral is anisotropic. The individual parts <strong>of</strong> twinned crystals show different brightness and<br />
interference colour, and on turning the microscope stage different extinction positions are<br />
revealed (Fig. 3-20). There are exceptions, however, as not all types <strong>of</strong> twins can be recognised<br />
under the microscope. If the indicatrix orientation <strong>of</strong> the individual parts <strong>of</strong> twinned<br />
crystals is identical, they are indistinguishable under crossed polarizers (e.g., the most<br />
abundant quartz twins have a twin axis parallel <strong>to</strong> c, which means the indicatrices are in<br />
parallel alignment. Thus, the twins go in<strong>to</strong> extinction simultaneously).<br />
Raith, Raase & Reinhardt – February 2012<br />
Figure 3-19. Types <strong>of</strong> twinning<br />
47
Guide <strong>to</strong> Thin Section Microscopy<br />
Twinning<br />
Raith, Raase & Reinhardt – February 2012<br />
Figure 3-20. Twinning in minerals (I)<br />
A: Staurolite, penetration twin on (320). B: Kyanite, simple twin on (100). C: Titanite, simple twin on (100).<br />
D: Simple and lamellar twins in chondrodite grains. E-G: Simple and lamellar twins on (100) in augite.<br />
H: Pigeonite twin on (100) inverted <strong>to</strong> orthopyroxene with augite exsolution lamellae on (001). I: Amphibole,<br />
simple twin on (100). J: Wollas<strong>to</strong>nite, twins on (100). K: Epidote, lamellar twins on (100). L: Margarite, simple<br />
twins on (001).<br />
48
Guide <strong>to</strong> Thin Section Microscopy<br />
Twinning<br />
Raith, Raase & Reinhardt – February 2012<br />
Figure 3-20. Twinning in minerals (II)<br />
A: Chlori<strong>to</strong>id, lamellar twins on (001). B: Mg-rich chlorite (clinochlore), lamellar twins on (001). C: Cumming<strong>to</strong>nite,<br />
<strong>thin</strong> twin lamellae on (100). D: Plagioclase laths with polysynthetic, lamellar twins. E-G: Polysynthetic<br />
twinning in plagioclase. H: Sanidine, Carlsbad twins. I: K-feldspar, Baveno growth twin. J,K:<br />
Cordierite, cyclic twinning on {110} (triplet). First-order red plate inserted in K for better birefringence<br />
contrast. L: Lamellar twins in cordierite.<br />
(Pho<strong>to</strong>micrograph K: Bernardo Cesare, University <strong>of</strong> Padova)<br />
49
Guide <strong>to</strong> Thin Section Microscopy<br />
Twinning<br />
Raith, Raase & Reinhardt – February 2012<br />
Figure 3-20. Twinning in minerals (III)<br />
A: Microcline with characteristic cross-hatched twinning (<strong>section</strong> approximately parallel <strong>to</strong> (001)). B: Microcline,<br />
twin set (<strong>section</strong> approximately parallel <strong>to</strong> (001)). C: Chessboard albite, formed by albitization <strong>of</strong> microcline.<br />
D-F: Leucite with complex lamellar twinning. G: Grossular (anomalous-birefringent) with concentricoscillating<br />
zoning and sec<strong>to</strong>r twins. H: Uvarovite (anomalous-birefringent) with sec<strong>to</strong>r twins. I: Larnite with <strong>thin</strong><br />
polysynthetic twins on (100) and (010). J,K. Calcite with polysynthetic glide twins on {0112}. L: Corundum with<br />
twin lamellae on {1011}.<br />
50
Guide <strong>to</strong> Thin Section Microscopy<br />
Inclusions, intergrowths, alteration products<br />
Raith, Raase & Reinhardt – February 2012<br />
3.4 Inclusions, intergrowths, alteration products<br />
Additional characteristics that can be used for mineral identification are, on the one hand,<br />
inclusions which have been incorporated during crystal growth (primary inclusions) and, on the<br />
other hand, inclusions that formed from alteration <strong>of</strong> the host mineral (secondary inclusions).<br />
Although primary inclusions are not mineral-specific, they can give clues <strong>to</strong> the growth conditions<br />
<strong>of</strong> the host mineral (pressure-temperature conditions; changes <strong>of</strong> compositional parameters).<br />
Primary fluid and melt inclusions are found in minerals that have grown in the presence <strong>of</strong> a free<br />
fluid or from a melt (Fig. 3.21 A-D, L). Large crystals in metamorphic rocks (porphyroblasts) may<br />
contain small-sized inclusions, the orientation and distribution <strong>of</strong> which provides evidence for<br />
timing relationships between crystal growth and deformation (Fig. 3-21 E, F, K). In micaceous<br />
metamorphic rocks, Al-rich minerals such as staurolite (Fig. 3.21 G), garnet, andalusite and<br />
kyanite commonly form poikiloblasts rich in quartz inclusions. In quartz-rich rocks, skeletal<br />
crystals <strong>of</strong> these minerals can be observed (Fig. 3-21 H). Porphyroblasts with growth sec<strong>to</strong>rs that<br />
advanced much faster than other sec<strong>to</strong>rs <strong>of</strong> the crystal display a high density <strong>of</strong> minute primary<br />
inclusions (hourglass structure: chlori<strong>to</strong>id, andalusite; Fig. 3.21 I, J).<br />
Secondary inclusions are, for example, intergrowths <strong>of</strong> isomorphic minerals that are the result <strong>of</strong><br />
unmixing from solid solutions, such as pyroxenes, amphiboles and feldspars. The unmixed phases<br />
which are commonly lamellar <strong>to</strong> spindle-shaped show a regular, structurally controlled orientation<br />
wi<strong>thin</strong> the host (Figs. 3.22, 3.23 J). The unmixed phase may, however, also be irregular in shape<br />
(e.g., dolomite in calcite; Fig. 3.22 K, L). Other commonly occurring secondary intergrowths are<br />
formed by the precipitation <strong>of</strong> Fe- and Ti-oxides in minerals from high-temperature rocks<br />
(pyroxene, amphibole, biotite, garnet, quartz, plagioclase; Fig. 3.23). Precipitation follows the<br />
cooling <strong>of</strong> the rocks whereby the solubility <strong>of</strong> Ti decreases. Although the crystal structures <strong>of</strong> host<br />
mineral and secondary phases are not isomorphic, the precipitation <strong>of</strong> Fe- and Ti-oxides may still<br />
be structurally controlled by the host mineral.<br />
High-grade metamorphic rocks can show reaction textures that relate <strong>to</strong> decompression, particularly<br />
<strong>to</strong> episodes <strong>of</strong> rapid exhumation at relatively high temperatures. Commonly intergrowths <strong>of</strong><br />
two new minerals form at the expense <strong>of</strong> a previously stable one (symplectites: Figs. 3.24, 3.25).<br />
Less common are fibrous intergrowths <strong>of</strong> three newly formed minerals (kelyphite: Fig. 3.24 A).<br />
Single-phase reaction coronas form during the pseudomorphic transformation <strong>of</strong> coesite <strong>to</strong> quartz<br />
(Fig. 3.25 I, J), from the pseudomorphic reaction <strong>of</strong> corundum <strong>to</strong> spinel (Fig. 3.25 G), or from the<br />
hydration <strong>of</strong> periclase <strong>to</strong> brucite (Fig. 3.25 E).<br />
Characteristic replacement textures are also generated by retrograde reactions involving hydrous<br />
fluids. In the presence <strong>of</strong> such fluids, hydrous phases grow at the expense <strong>of</strong> less hydrous or<br />
anhydrous minerals. The primary mineral is replaced from the surface inwards, while the reaction<br />
proceeds also preferentially along fractures and open cleavage planes (Figs. 3.26, 3.27). During<br />
saussuritization and sericitization <strong>of</strong> plagioclase, consumption <strong>of</strong> the anorthite component produces<br />
fine-grained clinozoisite, zoisite and sericite, without orientation relationships with the host<br />
crystal. (Fig. 3.27 J, K). Apart from hydration, oxidation reactions may be involved as well in<br />
such replacement processes (Fig. 3.26 A-E, I).<br />
A special feature are pleochroic haloes around minerals containing a significant amount <strong>of</strong> radiogenic<br />
iso<strong>to</strong>pes. The most common minerals in this group are zircon, monazite and xenotime. The<br />
radioactive radiation emitted from these minerals affects the crystal structure <strong>of</strong> the surrounding<br />
host minerals, and these structural defects become visible as coloured concentric haloes around<br />
the inclusion (Fig. 3-28). Over geological time, the effect intensifies, and the minerals that carry<br />
the radiogenic iso<strong>to</strong>pes may have their own crystal structure modified if not destroyed.<br />
51
Guide <strong>to</strong> Thin Section Microscopy<br />
Inclusions<br />
Raith, Raase & Reinhardt – February 2012<br />
Figure 3-21. Inclusions<br />
A,B: Fluid inclusions in quartz. C: Melt inclusions in plagioclase. D: Melt inclusions in leucite.<br />
E: Albite porphyroblast with sigmoidal inclusion trails defined by tiny graphite particles. F: Cordierite<br />
porphyroblast showing inclusion trails that are identical <strong>to</strong> matrix foliation. G: Staurolite poikiloblast.<br />
H: Skeletal garnet. I: Chlori<strong>to</strong>id with minute inclusions forming an hour-glass structure. J: Andalusite<br />
with fine-grained inclusions (chiastholite). K: Biotite, statically overgrowing the external schis<strong>to</strong>sity.<br />
L: Apatite, clouded interior due <strong>to</strong> tiny fluid inclusions.<br />
52
Guide <strong>to</strong> Thin Section Microscopy<br />
Exsolution textures<br />
Raith, Raase & Reinhardt – February 2012<br />
Figure 3-22 Exsolution textures<br />
A: Augite twin on (100) with pigeonite lamellae on (001). B: Bronzite with <strong>thin</strong> augite lamellae on<br />
(100). C: Exsolution lamellae in grunerite. D-H: Perthitic unmixing in alkali feldspars: mesoperthite,<br />
film-like spindle perthite, network-like vein perthite. spindle perthite. coarse vein perthite. I,J: Antiperthitic<br />
unmixing in plagioclase. K,L: Embayed platelets and drop-like crystals <strong>of</strong> exsolved dolomite<br />
in calcite host.<br />
53
Guide <strong>to</strong> Thin Section Microscopy<br />
Exsolution textures<br />
Raith, Raase & Reinhardt – February 2012<br />
Figure 3-23. Oriented exsolution <strong>of</strong> Fe,Ti-oxides (secondary inclusions)<br />
A-E: Oriented precipitation <strong>of</strong> ilmenite platelets in orthopyroxene (A,B), clinopyroxene (C), hornblende<br />
(D) and biotite (E). F-I: Oriented precipitation <strong>of</strong> rutile needles in biotite (= sagenite; F,G),<br />
garnet (H,I) and quartz (K). J: Hercynite with exsolved magnetite platelets. L: Oriented precipitation<br />
<strong>of</strong> Fe,Ti-oxide needles in plagioclase.<br />
54
Guide <strong>to</strong> Thin Section Microscopy<br />
Reaction textures<br />
Raith, Raase & Reinhardt – February 2012<br />
Figures 3-24. Reaction textures in granulites<br />
A-F: Garnet breakdown– A: Radiating Hbl-Opx-Spl kelyphite fringe (garnet peridotite). B,C: Opx+Crd<br />
symplectite (Grt+Qz→Opx+Crd; metapelite; Namibia, Lapland). D: Opx-Sil symplectite (Grt+Qz→<br />
Opx+Sil; Mg-Al granulite, Kola Peninsula). E: Opx-Spr symplectite (Grt+”Mg”→Opx+Spr; Mg-Al<br />
granulite, Eastern Ghats, India). F: Crd-Qz symplectite (metapelite, Lapland). G,H: Breakdown <strong>of</strong><br />
sillimanite <strong>to</strong> form Spr-Crd symplectite (Opx+Sil→Spr+Crd. Mg-Al granulite, southern India).<br />
I: Hercynite (Mt-unmixing, ilmenite), with finely pigmented cordierite rim in mesoperthite-quartz<br />
matrix (Spl+Qz→Crd; metapelite, southern Madagascar). J: Sil+Grt double seam between nearly<br />
opaque spinel and quartz (Spl+Qz→Grt+Sil; Fe-Al granulite, Eastern Ghats, India). K,L: Coronitic and<br />
skeletal garnet formation in plagioclase (Cpx+Fa+Pl→Grt; ferrodiorite, Eastern Ghats, India).<br />
Mineral abbreviations after Whitney & Evans (<strong>America</strong>n Mineralogist, 95, 185–187, 2010).<br />
55
Guide <strong>to</strong> Thin Section Microscopy<br />
Reaction textures<br />
Raith, Raase & Reinhardt – February 2012<br />
Figure 3-25. Reaction textures in granulites and HP- <strong>to</strong> UHP-metamorphic rocks<br />
A: Garnet coronas around clinopyroxene (Cpx+Pl→Grt+Qz; calcsilicate rock, Eastern Ghats Belt,<br />
India). B: Monticellite+wollas<strong>to</strong>nite symplectite (åkermanite→Mtc+Wol; calcsilicate rock, Adirondacks,<br />
USA). C: Anorthite+calcite symplectite (meionite→An+Cal; calcsilicate rock, Eastern Ghats<br />
Belt, India). D: Cal+Qz aggregate (Wol+CO 2 →Cal+Qz; South Norway). E: Periclase with brucite<br />
fringe (Per+H 2 O→Bru; calcsilicate marble, Bad Harzburg, Germany). F: Diopside corona around<br />
forsterite (Fo+Cal+CO 2 →Di+Dol; marble, South Madagascar). G: Pseudomorphic replacement <strong>of</strong><br />
corundum by spinel (Crn+”MgO”→Spl; Corundum-anorthite rock, South Madagascar). H: Fayalite+<br />
quartz symplectite (ferrosilite→Fa+Qz; Eastern Ghats Belt, India). I,J: Polymorphic transformation<br />
coesite→quartz (Dora Maira, Western Alps). K,L: Reaction omphacite+quartz→diopside+albite<br />
(eclogite; Saualpe, Austria).<br />
Mineral abbreviations after Whitney & Evans (<strong>America</strong>n Mineralogist, 95, 185–187, 2010).<br />
56
Guide <strong>to</strong> Thin Section Microscopy<br />
Alteration phenomena<br />
Raith, Raase & Reinhardt – February 2012<br />
Figure 3-26. Secondary alteration through reaction with aqueous fluids (I)<br />
A-C: Serpentinization− forsterite→serpentine+magnetite. D,E: Alteration <strong>of</strong> olivine <strong>to</strong> “iddingsite”<br />
(goethite and clay minerals). F: Oriented replacement <strong>of</strong> orthopyroxene by talc. G: Reaction clinopyroxene<br />
→ amphibole. H: Oriented replacement <strong>of</strong> clinopyroxene by amphibole (uralite). I: Kaersutitic<br />
amphibole with microcrystalline alteration seam <strong>of</strong> magnetite+clinopyroxene (opacite). J-L: Replacement<br />
<strong>of</strong> garnet by chlorite (J), biotite (K) and epidote (L).<br />
57
Guide <strong>to</strong> Thin Section Microscopy<br />
Alteration phenomena<br />
Raith, Raase & Reinhardt – February 2012<br />
Figure 3-27. Secondary alteration through reaction with aqueous fluids (II)<br />
A: Chloritization− biotite. B,C: Pinitization− cordierite→muscovite. D: Brucite pseudomorphing<br />
peri-clase. E,F: Replacement <strong>of</strong> corundum by muscovite (E) and gibbsite (F). G: Alteration <strong>of</strong> kyanite<br />
<strong>to</strong> pyrophyllite. H,I: Muscovite replacing andalusite (H) and staurolite (I). J: Saussuritization− plagioclase→clinozoisite+albite.<br />
K: Sericitization− plagioclase→muscovite. L: Zeolitization− anorthite→<br />
thomsonite.<br />
58
Guide <strong>to</strong> Thin Section Microscopy<br />
Alteration phenomena<br />
Raith, Raase & Reinhardt – February 2012<br />
Figure 3-28. Pleochroic halos around minerals containing radioactive iso<strong>to</strong>pes<br />
A-L: Pleochroic halos around inclusions <strong>of</strong> zircon, monazite and xenotime in biotite (A-C), cordierite<br />
(D-F), amphibole (G-H) and chlorite (J-L).<br />
59
Guide <strong>to</strong> Thin Section Microscopy<br />
Optical properties: basic principles<br />
4. Optical properties<br />
4.1 Some basic principles<br />
4.1.1 Nature <strong>of</strong> light, refraction<br />
In order <strong>to</strong> describe the interaction <strong>of</strong> light rays with matter, two physical models can be<br />
applied: (a) light as a wave, and (b) light as energy quanta. Most optical phenomena which<br />
are observed during microscopic investigation <strong>of</strong> amorphous or crystalline substances (glass<br />
phase, minerals), can be adequately explained with the wave model.<br />
Wave model: Light rays propagate as electromagnetic waves. In each wave electric and<br />
magnetic vec<strong>to</strong>rs oscillate orthogonal <strong>to</strong> each other and orthogonal <strong>to</strong> the propagation<br />
direction. The optical behaviour <strong>of</strong> light when passing through amorphous or crystalline<br />
substances is essentially controlled by the interaction <strong>of</strong> the electric vec<strong>to</strong>r with the electric<br />
field <strong>of</strong> the ions. Interactions with the magnetic vec<strong>to</strong>r are negligible. Thus, each light wave<br />
can be described as a harmonic oscillation [y = A sin(x)] (Fig. 4-1).<br />
Colour: The human eye can only see a small part <strong>of</strong> the large spectrum <strong>of</strong> electromagnetic<br />
radiation, namely the spectral domain between about 400 and 800 nm (visible light). This is<br />
the colour spectrum from violet <strong>to</strong> blue, green, yellow, orange and red (Fig. 4-1). Sunlight<br />
consists <strong>of</strong> various proportions <strong>of</strong> these colours, the combination <strong>of</strong> which is perceived as<br />
white light. In <strong>thin</strong> <strong>section</strong>, colour effects are caused if the spectral composition <strong>of</strong> originally<br />
white light is changed as light passes minerals, either by depletion <strong>of</strong> specific wavelengths<br />
(absorption), or by dispersion <strong>of</strong> white light as a result <strong>of</strong> refraction or diffraction <strong>of</strong> light at<br />
grain boundaries, inclusions and rough surfaces.<br />
Intensity: The intensity <strong>of</strong> light, <strong>of</strong> a specific colour, for example, is determined by the<br />
amplitude <strong>of</strong> the light wave. It can be modified by absorption.<br />
Raith, Raase & Reinhardt – February 2012<br />
Polarization: Sunlight or the light emitted from the light source in the microscope consists <strong>of</strong><br />
waves which vibrate in random directions. In plane-polarized light, the light waves vibrate in<br />
a defined direction. Plane-polarized light is generated in modern microscopes by a<br />
polarization filter which reduces light <strong>of</strong> random vibration directions from natural or artificial<br />
sources <strong>to</strong> light <strong>of</strong> a single vibration direction (Fig. 4-1). The bundle <strong>of</strong> light waves entering<br />
the <strong>thin</strong> <strong>section</strong> consists entirely <strong>of</strong> E-W vibrating light waves if the polarizer is adjusted<br />
precisely.<br />
Interference: Two coherent light waves generated by the same light source can overlap (i.e.,<br />
interfere) if they vibrate in the same plane and have the same velocity. This is realised in<br />
optically anisotropic minerals when the two orthogonally vibrating light rays, generated<br />
through double refraction in the crystal plate, are brought <strong>to</strong> interference in the analyzer after<br />
leaving the <strong>thin</strong> <strong>section</strong> (see Ch. 4.2.3). The degree <strong>of</strong> phase shift (Φ) determines whether the<br />
interfering waves are eliminated or produce a resultant wave <strong>of</strong> decreased or increased<br />
intensity (Fig. 4-1). If certain <strong>section</strong>s <strong>of</strong> the white light spectrum are eliminated, diminished<br />
or amplified, interference colours are generated (see Ch. 4.2.3).<br />
60
Guide <strong>to</strong> Thin Section Microscopy<br />
Optical properties: basic principles<br />
Raith, Raase & Reinhardt – February 2012<br />
Figure 4-1. Properties if light (wave model)<br />
61
Guide <strong>to</strong> Thin Section Microscopy<br />
Optical properties: basic principles<br />
Refraction <strong>of</strong> light: The velocity <strong>of</strong> light (as measured in air) is reduced if it enters<br />
substances <strong>of</strong> higher density (liquids, glasses, minerals). If the angle between the incident<br />
light rays and the phase boundary (e.g., air/glass) is different from 90˚, the light rays change<br />
the propagation direction; they are refracted. Snell's Law <strong>of</strong> refraction applies (Fig. 4-2) as<br />
long as the materials involved are isotropic (cf. Ch. 4.1.2). In a <strong>thin</strong> <strong>section</strong>, the object (d = 25<br />
μm) lies embedded between epoxy resin and glass. As light velocity is almost identical in<br />
glass and epoxy resin, refraction occurs mainly at boundary surfaces between the object and<br />
epoxy resin, but also at phase boundaries wi<strong>thin</strong> the object (Fig. 4-2).<br />
The light velocity v <strong>of</strong> a specified material is an important parameter for its identification. For<br />
technical convenience, the refractive index n is used instead <strong>of</strong> velocity. The refractive index<br />
is defined as the ratio between light velocity v 0 in vacuum (about the same as in air) and light<br />
velocity in the material studied. In isotropic materials, it can be determined experimentally by<br />
measuring the angles <strong>of</strong> refraction α and β, whereby Snell's Law n 2 /n 1 = sinα/sinβ applies. As<br />
light velocities in all solid and liquid substances are smaller than v 0 (n 1 = n air = 1), refractive<br />
indices are generally larger than 1.<br />
Raith, Raase & Reinhardt – February 2012<br />
Figure 4-2. Refraction <strong>of</strong> light, dispersion<br />
When passing through a glass prism, rays <strong>of</strong><br />
white light are “split up” in<strong>to</strong> their spectral<br />
colours due <strong>to</strong> differential refraction at the<br />
two prism surfaces. This demonstrates that<br />
ray velocity is dependent on wavelength<br />
(causing dispersion). Therefore, monochromatic<br />
light must be used when determining<br />
refractive indices.<br />
62
Guide <strong>to</strong> Thin Section Microscopy<br />
Optical properties: basic principles<br />
4.1.2 Isotropy and anisotropy<br />
Isotropic materials<br />
Optically isotropic substances such as gases, liquids, glasses and the highly symmetric cubic<br />
minerals show optical behaviour that is independent <strong>of</strong> the direction <strong>of</strong> light propagation.<br />
This means, their optical properties (light velocity, refractive index and colour) are identical<br />
in all directions.<br />
The three-dimensional propagation <strong>of</strong> light in an isotropic material can be presented<br />
graphically as 3-D models for wave or ray velocity and for refractive index, both <strong>of</strong> which are<br />
spheres (Fig. 4-3). The model preferred by mineralogists is the optical indicatrix, which<br />
describes the refractive index as a direction-dependent variable.<br />
Figure 4-3. Isotropic substances; 3D surfaces <strong>of</strong> v and n<br />
Raith, Raase & Reinhardt – February 2012<br />
A. Ray velocity surface: For each ray direction, the velocity value is represented by a specific distance<br />
from a chosen origin (v = 0). The geometric form representing all directions <strong>of</strong> ray propagation is a<br />
sphere with radius v.<br />
B. Indicatrix: For each ray direction, the refractive index is represented by a specific distance from a<br />
chosen origin and is marked <strong>of</strong>f parallel <strong>to</strong> the vibration direction and perpendicular <strong>to</strong> the ray<br />
propagation direction. The geometric form representing the refractive index for all ray propagation<br />
directions is a sphere with radius n. Each ray propagation direction has an infinite number <strong>of</strong> potential<br />
vibration directions.<br />
In <strong>thin</strong> <strong>section</strong> <strong>microscopy</strong>, glasses and cubic minerals generally show a single specific<br />
refractive index and colour independent <strong>of</strong> orientation (Fig. 4-4). An indication <strong>of</strong> crystal<br />
orientation in <strong>thin</strong> <strong>section</strong> can therefore only be derived from morphological properties, for<br />
example, crystal outlines or cleavage (Fig. 3-9). Another important characteristic <strong>of</strong> optically<br />
isotropic materials is that light waves do not experience any change in vibration direction.<br />
This means that E-W vibrating plane-polarized light waves maintain their E-W orientation<br />
after passing through the isotropic materials (glass, mineral). Therefore, they are blocked by<br />
the analyzer, which is a N-S oriented polarizer (Fig. 4-4 A,E).<br />
63
Guide <strong>to</strong> Thin Section Microscopy<br />
Optical properties: basic principles<br />
Raith, Raase & Reinhardt – February 2012<br />
Figure 4-4. Isotropic substances<br />
Behaviour <strong>of</strong> light when passing through an isotropic substance (glass or cubic mineral):<br />
In plane-polarized light chemically homogeneous glasses or crystals <strong>of</strong> cubic minerals show<br />
the same colour independent <strong>of</strong> orientation and rotation <strong>of</strong> the stage (images B,C: MgFespinel;<br />
image D: almandine).<br />
Under crossed polarizers (image A), glass and cubic mineral grains appear black independent<br />
<strong>of</strong> orientation and rotation <strong>of</strong> the stage (image E: almandine).<br />
64
Guide <strong>to</strong> Thin Section Microscopy<br />
Optical properties: basic principles<br />
Anisotropic materials<br />
Light propagation in optically anisotropic materials is direction-dependent. All non-cubic<br />
crystalline substances (Fig. 3-1) are optically anisotropic. Light entering an anisotropic<br />
crystal is "split" in<strong>to</strong> two light waves that vibrate orthogonal <strong>to</strong> each other (with exceptions<br />
applying <strong>to</strong> specific directions in the crystal). The two light waves propagate through the<br />
crystal with different velocities. This phenomenon is called double refraction (Fig. 4-5).<br />
Figure 4-5. Double refraction in a calcite rhombohedron (Huygenian construction)<br />
Raith, Raase & Reinhardt – February 2012<br />
Crystals <strong>of</strong> hexagonal, trigonal and tetragonal symmetry<br />
The 3-D models for ray velocities (expressed as v or 1/n) in crystals <strong>of</strong> hexagonal, trigonal<br />
and tetragonal symmetry are therefore double surfaces (Fig. 4-6 A). They illustrate that one <strong>of</strong><br />
the two light waves (O-wave) propagates like light in an isotropic substance, with the same<br />
velocity in all directions, while the other wave (E-wave) changes its velocity dependent on<br />
the direction in the crystal. The E-wave has either the highest or lowest value (v e ) in the<br />
direction normal <strong>to</strong> the crystallographic c-axis. Any rotation away from this direction,<br />
<strong>to</strong>wards the c-axis, will shift v e <strong>to</strong>wards the v o value (decreasing if v e > v o , or increasing if v e<br />
< v o ). In an orientation parallel c, v e has reached the same value as v o . Thus, in this particular<br />
direction, the condition <strong>of</strong> optical isotropy is realised. This specific direction is referred <strong>to</strong> as<br />
the optic axis. Minerals belonging <strong>to</strong> the group <strong>of</strong> hexagonal, trigonal and tetragonal<br />
symmetry are optically uniaxial. The vibration directions <strong>of</strong> the waves are fixed wi<strong>thin</strong> the<br />
crystal: the E-wave vibrates wi<strong>thin</strong> the plane defined by the ray direction and the c-axis; the<br />
O-wave vibrates orthogonal <strong>to</strong> the E-wave.<br />
Mineralogists prefer the single-surface indicatrix model for explaining optical phenomena<br />
over the double-surface model <strong>of</strong> light propagation. The construction principle is illustrated in<br />
Fig. 4-6 B: considering the centre <strong>of</strong> a crystal as the origin, the refractive indices <strong>of</strong> two light<br />
waves belonging <strong>to</strong> one wave normal and vibrating orthogonal <strong>to</strong> each other are marked <strong>of</strong>f in<br />
proportional distances from the origin. Thus, a "refraction cross" is created which shows the<br />
short and long axes <strong>of</strong> an ellipse. A construction <strong>of</strong> the ellipses for all possible wave-normal<br />
directions in crystal space results in an ellipsoid which is the indicatrix.<br />
The optical indicatrix <strong>of</strong> the crystal systems discussed here is an ellipsoid <strong>of</strong> revolution. It has<br />
either a prolate form (n e > n o ; optically uniaxial positive) or an oblate form (n e < n o ; optically<br />
uniaxial negative) (Fig. 4-6 C,D). The rotation axis (= optical axis) is identical <strong>to</strong> the c-axis.<br />
65
Guide <strong>to</strong> Thin Section Microscopy<br />
Optical properties: basic principles<br />
Raith, Raase & Reinhardt – February 2012<br />
Figure 4-6. Optically uniaxial crystals; 3D surfaces <strong>of</strong> v and n<br />
A: 3D-surfaces <strong>of</strong> v and n; B: Construction <strong>of</strong> the indicatrix; C-D: Indicatrices <strong>of</strong> optically uniaxial<br />
positive and negative crystals.<br />
66
Guide <strong>to</strong> Thin Section Microscopy<br />
Optical properties: basic principles<br />
Crystals <strong>of</strong> orthorhombic, monoclinic and triclinic symmetry<br />
The propagation <strong>of</strong> both waves in crystals <strong>of</strong> such symmetry is direction-dependent. The<br />
resulting 3D two-surface models <strong>of</strong> ray velocities are complicated and have not had any<br />
impact on practical work. Microscopists prefer the single-surface indicatrix model for the<br />
explanation <strong>of</strong> optical phenomena (Fig. 4-7).<br />
Figure 4-7. Optically biaxial crystals, crystal symmetry and indicatrix<br />
The indicatrix <strong>of</strong> crystals with orthorhombic, monoclinic and triclinic symmetry is respresented<br />
in a coordinate system with axes X, Y, Z that are orthogonal <strong>to</strong> each other. The geometry<br />
<strong>of</strong> the triaxial ellipsoid is defined by the proportional lengths <strong>of</strong> the refractive indices n x , n y ,<br />
n z on X, Y and Z. Thus, the symmetry <strong>of</strong> the ellipsoid is generally orthorhombic. The<br />
refractive indices are defined as n z > n y > n x (or n γ > n β > n α ).<br />
There are two circular <strong>section</strong>s with the radius n y . Orthogonal <strong>to</strong> these circular <strong>section</strong>s, light<br />
propagates with the same velocity as in an isotropic substance. These two directions correspond<br />
<strong>to</strong> the two optic axes A. The low-symmetry crystals are therefore optically anisotropicbiaxial.<br />
Raith, Raase & Reinhardt – February 2012<br />
The optic axes lie in the ZX plane (= optic axial plane OAP). Y is orthogonal <strong>to</strong> the OAP. The<br />
angle between the optic axes (2V) is mineral-specific and can attain values between 0˚ and<br />
90˚. If Z dissects the acute angle (2V z < 90˚), the crystal is biaxial-positive; if X dissects the<br />
acute angle (2V x < 90˚), the crystal is biaxial-negative. If the axial angle is 90˚, the crystal is<br />
optically neutral.<br />
The spatial orientation <strong>of</strong> the indicatrix in a crystal is defined by the crystal's symmetry:<br />
• In crystals <strong>of</strong> orthorhombic symmetry, the ellipsoid axes (X, Y, Z) correspond <strong>to</strong> the<br />
crystallographic axes (a,b,c). Which indicatrix axis is parallel <strong>to</strong> which crystallographic<br />
axis depends on the specific mineral.<br />
• In crystals <strong>of</strong> monoclinic symmetry, it is only the crystallographic b axis and one <strong>of</strong> the<br />
indicatrix axes that are parallel (commonly Y). The other two axes lie in the symmetry<br />
plane (010) and form angles with the crystallographic axes a and c.<br />
• In triclinic crystals, none <strong>of</strong> the axes <strong>of</strong> the orthorhombic indicatrix is parallel <strong>to</strong> any <strong>of</strong> the<br />
crystallographic axes. The indicatrix axes form mineral-specific angles with the crystallographic<br />
axes.<br />
67
Guide <strong>to</strong> Thin Section Microscopy<br />
Colour and pleochroism<br />
4.2 Optical characteristics used for mineral determination<br />
4.2.1 Colour and pleochroism<br />
The intensity <strong>of</strong> white light can be variably decreased due <strong>to</strong> absorption as it passes through<br />
the <strong>thin</strong> <strong>section</strong>. If absorption wavelengths are outside the visible spectrum, glass phase and<br />
minerals appear colourless (white <strong>to</strong> greyish). Colours are generated if selective absorption<br />
affects certain parts <strong>of</strong> the spectrum more than others. Colour and colour intensity are<br />
important mineral-specific properties.<br />
Practical hints: Colour intensity increases with sample thickness. In a standard <strong>thin</strong> <strong>section</strong><br />
(25-30 μm thickness) wedge-shaped edges <strong>of</strong> grains or crystals <strong>thin</strong>ner than 25 μm show a<br />
distinctly paler colour. In minerals with a high refractive index (n > 1.6) weak colours may be<br />
masked by the minerals' chagrin (see 4.2.2). Chagrin effects can be minimised if absorption<br />
colours are observed at high magnification (objective magnification M > 20x), with the<br />
auxiliary condenser inserted and aperture diaphragm completely open. Furthermore, it should<br />
be noted that the colour hue depends <strong>to</strong> some degree on the temperature <strong>of</strong> the light source.<br />
This can be adjusted <strong>to</strong> correspond <strong>to</strong> the colour temperature <strong>of</strong> natural light by changing<br />
light intensity and using appropriate filters (e.g., a blue filter).<br />
In optically isotropic substances (glass phase, cubic minerals) light absorption is identical in<br />
all directions. Glasses and cubic crystals therefore show a single colour, no matter how the<br />
crystals are <strong>section</strong>ed, as long as they are chemically homogeneous. The colour does not<br />
change if the stage is turned (Fig. 4-8). Colour and colour intensity provide clues <strong>to</strong> type and<br />
concentration <strong>of</strong> colour-inducing cations. This can be demonstrated using glasses and spinel<br />
group minerals <strong>of</strong> different composition (Fig. 4-9).<br />
Raith, Raase & Reinhardt – February 2012<br />
Figure 4-8. Optically isotropic phases such as the cubic minerals shown here generally<br />
display a single colour, independent <strong>of</strong> orientation. A-C: MgFe-spinel, hercynite, magnesi<strong>of</strong>errite.<br />
D,E: melanite, almandine. F: hauyne.<br />
68
Guide <strong>to</strong> Thin Section Microscopy<br />
Colour and pleochroism<br />
Figure 4-9 A. Relationship between colour <strong>of</strong> the glass phase from slags <strong>of</strong> coal-fired boilers<br />
and the content in staining components TiO 2 and Fe 2 O 3 (wt.%)<br />
25<br />
47<br />
Raith, Raase & Reinhardt – February 2012<br />
Figure 4-9 B. Relationship between mineral colour and composition <strong>of</strong> spinels in the system<br />
magnetite-magnesi<strong>of</strong>errite-hercynite-spinel. Spinel samples are partly from slags and sinters<br />
in coal-fired boilers (numbered samples) and partly from natural rocks.<br />
69
Guide <strong>to</strong> Thin Section Microscopy<br />
Colour and pleochroism<br />
In optically anisotropic substances (non-cubic minerals), absorption is a directional<br />
property. Thus, crystals <strong>of</strong> a single mineral species can display different colours dependent on<br />
their orientation and corresponding light vibration directions. Colours and pleochroism are<br />
mineral-specific properties.<br />
The majority <strong>of</strong> minerals do not show any, or only weak, pleochroism. Exceptions displaying<br />
strong pleochroism are <strong>to</strong>urmaline, members <strong>of</strong> the amphibole group, Fe-Ti-rich biotites, and<br />
less common minerals such as piemontite, sapphirine, dumortierite and yoderite. Fig. 4-10<br />
shows examples <strong>of</strong> distinct <strong>to</strong> strong pleochroism.<br />
Raith, Raase & Reinhardt – February 2012<br />
Figure 4-10. Examples <strong>of</strong> distinct <strong>to</strong> strong pleochroism.<br />
A: Piemontite. B: Glaucophane. C: Sapphirine. D: Viridine. E: Thulite. F: Yoderite (by courtesy <strong>of</strong> Dr. N. Jöns,<br />
Universität Bremen). G: Chlori<strong>to</strong>id. H: Biotite. I: Ti-rich biotite. J: Lazulite. K: Aegirine augite. L: Fe 3+ -rich<br />
epidote (pistacite).<br />
70
Guide <strong>to</strong> Thin Section Microscopy<br />
Colour and pleochroism<br />
Pleochroic minerals <strong>of</strong> tetragonal, hexagonal and trigonal symmetry show two specific<br />
absorption colours (dichroism), parallel <strong>to</strong> the vibration directions <strong>of</strong> the E- and O-waves.<br />
Sections orthogonal <strong>to</strong> the crystallographic c-axis (= optic axis) generally show the absorption<br />
colour <strong>of</strong> the O-wave as the microscope stage is rotated. Sections parallel <strong>to</strong> the c-axis show<br />
an alternation between the absorption colour <strong>of</strong> the E-wave (E-W orientation <strong>of</strong> the c-axis)<br />
and the O-wave (N-S orientation <strong>of</strong> the c-axis) for every 90° rotation <strong>of</strong> the stage (Fig. 4-11<br />
and Fig. 4-12: example <strong>to</strong>urmaline).<br />
Figure 4-11. Change <strong>of</strong> absorption colour <strong>of</strong> <strong>to</strong>urmaline during a 360° rotation <strong>of</strong> the<br />
microscope stage. Shown are the four positions <strong>of</strong> a crystal <strong>section</strong> in which the vibration<br />
directions <strong>of</strong> the two waves coincide exactly with the directions <strong>of</strong> the polarizers. In these<br />
orientations, only the E-W vibrating wave passes the crystal; the N-S wave is not activated.<br />
Pleochroic minerals <strong>of</strong> orthorhombic, monoclinic and triclinic symmetry possess three<br />
characteristic absorption colours (trichroism) related <strong>to</strong> vibration directions parallel <strong>to</strong> the<br />
principal indicatrix axes X, Y and Z. The determination <strong>of</strong> these colours must be performed<br />
on selected crystal <strong>section</strong>s that are parallel <strong>to</strong> two <strong>of</strong> these axes (Fig. 4-14 A-C). The relation<br />
between crystal orientation, vibration direction and absorption (pleochroism) for members <strong>of</strong><br />
the amphibole group is explained in Figs. 4-15,16,17. As the example <strong>of</strong> the amphiboles<br />
demonstrates beautifully, there is a correlation between absorption colour and chemical<br />
composition (Fig. 4-13).<br />
Raith, Raase & Reinhardt – February 2012<br />
Figure 4-13. Colours <strong>of</strong> amphiboles <strong>of</strong> different composition, in relation <strong>to</strong> the principal<br />
vibration direction parallel b. The amphibole grains are oriented such that the b-axis is in<br />
alignment with the lower polarizer. In these minerals, b is parallel <strong>to</strong> the indicatrix axis Y.<br />
Hence, the colours displayed correlate with Y (cf. Fig. 4-15).<br />
71
Guide <strong>to</strong> Thin Section Microscopy<br />
Colour and pleochroism<br />
Raith, Raase & Reinhardt – February 2012<br />
Figure 4-12. Determination <strong>of</strong> the colours relating <strong>to</strong> the vibration directions <strong>of</strong> the E- and O-<br />
waves <strong>of</strong> an optically uniaxial mineral, using <strong>to</strong>urmaline as an example.<br />
72
Guide <strong>to</strong> Thin Section Microscopy<br />
Colour and pleochroism<br />
Figure 4-14 A-C. Change <strong>of</strong> absorption colour in crystal <strong>section</strong>s <strong>of</strong> biotite, actinolite and<br />
aegirine-augite as the stage is rotated 360°. Shown are the four positions in which the<br />
vibration directions <strong>of</strong> the two waves coincide exactly with the directions <strong>of</strong> the polarizers. In<br />
these orientations only the E-W vibrating wave passes the crystal; the N-S wave is not<br />
activated. Therefore, these crystal <strong>section</strong>s change their colour every 90° <strong>of</strong> rotation. In the<br />
actinolite and aegirine-augite <strong>section</strong>s, these are the colours relating <strong>to</strong> the n y and n x’ waves,<br />
and in biotite, the colours relating <strong>to</strong> the n z~y and n x waves.<br />
As far as clinoamphiboles are concerned, the absorption colours parallel <strong>to</strong> X, Y and Z are<br />
determined in two specific <strong>section</strong>s (Figs. 4-15,16,17):<br />
(1) In crystal <strong>section</strong>s parallel <strong>to</strong> (010), the vibration directions Z and X are in the viewing<br />
plane, except for some rare alkaline amphiboles. Such <strong>section</strong>s are commonly prismatic in<br />
shape and can be recognised by their high interference colours (∆n = n z -n x ) (see Ch. 4.2.3).<br />
Raith, Raase & Reinhardt – February 2012<br />
(2) In crystal <strong>section</strong>s perpendicular <strong>to</strong> c, the vibration directions Y (parallel <strong>to</strong> b) and X’ are<br />
in the viewing plane. These crystal <strong>section</strong>s are recognised by the characteristic inter<strong>section</strong><br />
<strong>of</strong> the {110} cleavage planes.<br />
Crystal <strong>section</strong>s perpendicular <strong>to</strong> one <strong>of</strong> the two optic axes appear in a single colour<br />
corresponding <strong>to</strong> Y as the stage is turned (n y wave only).<br />
73
Guide <strong>to</strong> Thin Section Microscopy<br />
Colour and pleochroism<br />
Figure 4-15. Determination <strong>of</strong> the colours for the principal vibration directions Z, Y and X <strong>of</strong><br />
an optically biaxial mineral, using actinolite, Ca 2 (Mg,Fe 2+ ) 5 [Si 8 O 22 ](OH) 2 , as an example.<br />
Raith, Raase & Reinhardt – February 2012<br />
74
Guide <strong>to</strong> Thin Section Microscopy<br />
Colour and pleochroism<br />
Raith, Raase & Reinhardt – February 2012<br />
Figure 4-16. Determination <strong>of</strong> the colours in the principal vibration directions Z, Y and X <strong>of</strong><br />
an optically biaxial mineral, using kaersutite, NaCa 2 Mg 3 Fe 2+ (Ti,Fe 3+ )[Al 2 Si 6 O 22 ](OH) 2 , as an<br />
example.<br />
75
Guide <strong>to</strong> Thin Section Microscopy<br />
Colour and pleochroism<br />
Raith, Raase & Reinhardt – February 2012<br />
Figure 4-17. Determination <strong>of</strong> the colours in the principal vibration directions Z, Y and X <strong>of</strong><br />
an optically biaxial mineral, using glaucophane, Na 2 (Mg,Fe 2+ ) 3 (Al,Fe 3+ ) 2 [Si 8 O 22 ](OH) 2 , as an<br />
example.<br />
76
Guide <strong>to</strong> Thin Section Microscopy<br />
Light refraction: relief<br />
4.2.2 Light refraction (relief, chagrin, Becke line)<br />
Refractive indices are important characteristics for identifying minerals. Their values cannot<br />
be determined directly in <strong>thin</strong> <strong>section</strong>, but must be estimated from a comparison with the<br />
embedding medium (epoxy resin; n about 1.54) or with minerals <strong>of</strong> known refractive indices,<br />
using light refraction effects. Criteria for doing this are relief, chagrin and the Becke line.<br />
Relief<br />
Mineral grains that have higher or lower refractive indices than their immediate surroundings<br />
show distinct con<strong>to</strong>urs and appear <strong>to</strong> lie higher or lower than the adjacent materials. The<br />
relief is a result <strong>of</strong> refraction and internal <strong>to</strong>tal reflection <strong>of</strong> light rays at the interface between<br />
the mineral grain and its surroundings. The higher the difference between the respective<br />
refractive indices, the more pronounced are grain outline and relief. Both disappear if the<br />
refractive indices <strong>of</strong> adjacent materials are identical (Fig. 4-18).<br />
Raith, Raase & Reinhardt – February 2012<br />
Figure 4-18. Generation <strong>of</strong> relief by refraction <strong>of</strong> light rays at grain boundaries. The lower<br />
sequence shows, from left <strong>to</strong> right, grains <strong>of</strong> fluorite (Fl), K-feldspar (Kfs), albite (Ab),<br />
muscovite (Ms), clinozoisite (Cz), garnet (Grt) and zircon (Zrn) in quartz (n qz = 1.544-1.553).<br />
77
Guide <strong>to</strong> Thin Section Microscopy<br />
Light refraction: chagrin<br />
Chagrin (surface roughness)<br />
The upper and lower surfaces <strong>of</strong> minerals in <strong>thin</strong> <strong>section</strong> (in polished <strong>section</strong>s only the lower<br />
surface) show relief due <strong>to</strong> minute roughness, unevenness and cracks. If the minerals have<br />
higher or lower refractive indices than the embedding medium (epoxy resin, n = 1.54),<br />
refraction and reflection <strong>of</strong> light rays will occur at this micro-relief. As a result, the grain<br />
surfaces display a finely pitted structure in the microscope, which is referred <strong>to</strong> as chagrin<br />
(French for grained leather). The larger the difference <strong>of</strong> the refractive indices between<br />
mineral and epoxy resin, the more pronounced is the chagrin as the proportion <strong>of</strong> <strong>to</strong>tally<br />
reflected and scattered light increases (Fig. 4-19).<br />
Figure 4-19 Chagrin in relation <strong>to</strong> the refractive index <strong>of</strong> a mineral.<br />
Raith, Raase & Reinhardt – February 2012<br />
Practical hints: The chagrin contrast may be modified by changing the illumination<br />
conditions: (1) putting the auxiliary condenser lens in<strong>to</strong> the light path and opening the aperture<br />
diaphragm decrease the chagrin effect; (2) closing the aperture diaphragm and swinging<br />
out the condenser lens increases the effect. For an estimation <strong>of</strong> the light refraction <strong>of</strong> an<br />
unknown mineral using the chagrin contrast, the illumination conditions and magnification<br />
should be kept constant (i.e., small aperture by closing the aperture diaphragm; 20x<br />
objective).<br />
Furthermore, it should be noted that the chagrin contrast is generally low in polished<br />
microprobe <strong>section</strong>s, as light scattering is only occurring at the rougher lower surface <strong>of</strong> the<br />
minerals.<br />
Note also that a clouding due <strong>to</strong> finely disseminated mineral and fluid inclusions can give an<br />
impression <strong>of</strong> higher chagrin than the host material actually has.<br />
78
Guide <strong>to</strong> Thin Section Microscopy<br />
Light refraction: Becke Line<br />
Becke Line<br />
At the boundary between two substances <strong>of</strong> different refractive index (crystal–epoxy resin,<br />
crystal–glass, crystal–crystal) a bright fringe, the Becke Line, is observed at high magnification.<br />
When closing the aperture diaphragm, this fringe may show colours, particularly if the<br />
minerals show a small difference in refractive index but a large difference in dispersion. The<br />
Becke Line is named after Friedrich Becke (1855-1931).<br />
If this phase boundary is defocused by raising or lowering the stage slightly, the light fringe<br />
moves from one phase in<strong>to</strong> the adjacent one: When lowering the stage it moves in<strong>to</strong> the<br />
higher refractive substance, and when raising the stage in<strong>to</strong> the lower-refractive substance. An<br />
explanation <strong>of</strong> this phenomenon is given in Fig. 4-20, left-hand side.<br />
The intensity <strong>of</strong> the Becke Line decreases as the difference in refractive indices between the<br />
adjacent substances decreases. It disappears completely if the indices are identical.<br />
Differences in the refractive indices in the order <strong>of</strong> 0.001 <strong>to</strong> 0.002 can still be recognised. On<br />
the other hand, the Becke Line is obscured at high differences in refractive index by the<br />
strong chagrin.<br />
Raith, Raase & Reinhardt – February 2012<br />
Figure 4-20. Generation <strong>of</strong> the Becke Line (left); movement <strong>of</strong> the Becke Line at the quartzglass<br />
interface as a result <strong>of</strong> raising or lowering the stage.<br />
Practical hints: For observation <strong>of</strong> the Becke Line, a steeply inclined, but not vertical, clean<br />
boundary between two phases must be chosen. Suitable are also broken-<strong>of</strong>f grain boundaries<br />
bordering on epoxy resin (in break-outs or at the <strong>thin</strong> <strong>section</strong> edge). The phase boundary is<br />
then viewed with sufficiently high magnification (20x objective), the contrast is optimised by<br />
closing the aperture diaphragm, and the sense <strong>of</strong> movement <strong>of</strong> the Becke Line is studied by<br />
raising and lowering the stage slightly (Fig 4-20, right-hand side).<br />
79
Guide <strong>to</strong> Thin Section Microscopy<br />
Double refraction<br />
4.2.3 Double refraction<br />
In non-cubic, optically anisotropic crystals, light propagates in all directions as two sets <strong>of</strong><br />
orthogonally vibrating plane-polarized waves, except for directions parallel <strong>to</strong> an optic axis.<br />
The two waves have different velocities (and correspondingly different refractive indices n z '<br />
and n x ').<br />
The specific relation between crystal symmetry and indicatrix in each mineral species defines<br />
the orientation <strong>of</strong> the polarization plane and the refractive index <strong>of</strong> the two waves (Ch. 4.1.2;<br />
Figs. 4-6,7). For every crystal <strong>section</strong> seen in <strong>thin</strong> <strong>section</strong>, these parameters can be derived<br />
from the ellipse created by the inter<strong>section</strong> <strong>of</strong> the indicatrix and the <strong>thin</strong> <strong>section</strong> plane (Fig. 4-<br />
21).<br />
Raith, Raase & Reinhardt – February 2012<br />
Figure 4-21. Relationship between crystal <strong>section</strong>, crystal orientation and indicatrix<br />
orientation using melilite as an example.<br />
80
Guide <strong>to</strong> Thin Section Microscopy<br />
Double refraction<br />
4.2.3.1 Observation without analyzer (plane-polarized light mode)<br />
In plane-polarized light, anisotropic minerals can only be distinguished from isotropic<br />
minerals if characteristic grain shapes are observed (e.g., elongate or platy habit), if the grains<br />
display relief changes such as chagrin contrast as the stage is turned (only in minerals with<br />
large differences in n z ' and n x '), or if the absorption colour changes with changing orientation<br />
(pleochroism).<br />
The birefringence (∆n) <strong>of</strong> minerals is commonly not large enough <strong>to</strong> create distinct chagrin<br />
effects, with the exception <strong>of</strong> carbonates. Fig. 4-22 shows the striking change <strong>of</strong> chagrin in<br />
calcite and dolomite due <strong>to</strong> their extreme birefringence (∆n = 0.172 Cal resp. 0.177 Dol ).<br />
Figure 4-22. Change <strong>of</strong> chagrin in calcite and dolomite during a 360˚ rotation <strong>of</strong> the stage.<br />
Crystal <strong>section</strong>s are oriented parallel <strong>to</strong> the c axis. Shown are the four positions where the vibration<br />
directions <strong>of</strong> the two waves in the crystal coincide exactly with the polarizer directions. In these<br />
positions, only the E-W vibrating wave is passing through the crystal. The large difference between the<br />
refractive indices <strong>of</strong> the O- and E-waves causes the change in chagrin (∆n = 0.172 Cal resp. 0.177 Dol ).<br />
The majority <strong>of</strong> minerals show no or very little pleochroism. Exceptions include <strong>to</strong>urmaline,<br />
members <strong>of</strong> the amphibole group, Fe-Ti-rich biotites as well as less common minerals such as<br />
piemontite, sapphirine, dumortierite, yoderite and lazulite (Fig. 4-10).<br />
Raith, Raase & Reinhardt – February 2012<br />
Pleochroic minerals <strong>of</strong> tetragonal, hexagonal and trigonal symmetry show two characteristic<br />
absorption colours parallel <strong>to</strong> the vibration directions <strong>of</strong> the E- and O-waves (dichroism).<br />
Crystal <strong>section</strong>s normal <strong>to</strong> the crystallographic c-axis (= optic axis) only show the absorption<br />
colour <strong>of</strong> the O-wave as the stage is rotated. Crystal <strong>section</strong>s parallel <strong>to</strong> the c-axis show an<br />
alternation between the absorption colour <strong>of</strong> the E-wave (E-W orientation <strong>of</strong> c) and the O-<br />
wave (N-S orientation <strong>of</strong> c) every 90˚ during stage rotation (Ch. 4.2.1, Figs. 4-11,12).<br />
Pleochroic minerals <strong>of</strong> orthorhombic, monoclinic and triclinic symmetry show three<br />
characteristic absorption colours parallel <strong>to</strong> the principal indicatrix axes X, Y and Z<br />
(trichroism). Crystal <strong>section</strong>s normal <strong>to</strong> one <strong>of</strong> the two optic axes show the absorption colour<br />
<strong>of</strong> the Y vibration direction as the stage is rotated. An identification <strong>of</strong> the absorption colours<br />
in the X, Y and Z directions requires specific crystal <strong>section</strong>s (Ch. 4.2.1, Figs. 4-14−17).<br />
81
Guide <strong>to</strong> Thin Section Microscopy<br />
Double refraction<br />
4.2.3.2 Observation with analyzer inserted (crossed-polarizers mode)<br />
Extinction behaviour: The rotation <strong>of</strong> a birefringent crystal <strong>section</strong> between crossed<br />
polarizers involves a periodic change between a bright image and a dark image. A full<br />
rotation <strong>of</strong> the stage involves four extinction positions separated by 90˚ and four bright<br />
images in between (Fig. 4-23). The four orientations <strong>of</strong> maximum brightness are also referred<br />
<strong>to</strong> as diagonal positions.<br />
Figure 4-23. Extinction positions and diagonal positions <strong>of</strong> a quartz grain during a 360˚<br />
rotation <strong>of</strong> the stage.<br />
Raith, Raase & Reinhardt – February 2012<br />
In the extinction position the E-W vibrating waves leaving the polarizer are exactly parallel<br />
<strong>to</strong> one <strong>of</strong> the two possible vibration directions <strong>of</strong> the crystal (Fig. 4-23). Hence, the waves are<br />
not split up and pass the mineral without any change in vibration direction as E-W vibrating<br />
waves which propagate with the velocity specific <strong>to</strong> that direction in the crystal. Taking the<br />
optically uniaxial quartz as an example, either the E- or the O-waves with the refractive<br />
indices n e ' resp. n o are parallel <strong>to</strong> the polarizer. In the general case <strong>of</strong> an anisotropic mineral,<br />
the waves are those that relate <strong>to</strong> the refractive indices n z ' and n x '. After leaving the crystal,<br />
the E-W vibrating waves are blocked by the N-S-oriented analyzer, and the crystal appears<br />
black.<br />
If the crystal is rotated out <strong>of</strong> the extinction position, the plane <strong>of</strong> polarisation <strong>of</strong> the light<br />
entering the crystal is no longer parallel <strong>to</strong> any <strong>of</strong> the principal vibration directions in the<br />
crystal (n o , n e ', n z ', n x '). The E-W vibrating waves leaving the polarizer are therefore split up<br />
in the crystal in<strong>to</strong> two orthogonally vibrating waves with refractive indices n e ' and n o resp. n z '<br />
and n x ' in the general case <strong>of</strong> an anisotropic mineral (Fig. 4-23,24). As light enters the crystal,<br />
the relative amplitudes a 1 and a 2 <strong>of</strong> the two newly generated waves depend entirely on the<br />
orientation <strong>of</strong> n x ' and n z ' (or n o and n e ') with respect <strong>to</strong> the polarizer (Fig. 4-24, bot<strong>to</strong>m row).<br />
At small angles, one <strong>of</strong> the two waves very much dominates in terms <strong>of</strong> light intensity. In<br />
the 45° diagonal position the a 1 and a 2 amplitudes are identical. However, without the analyzer<br />
82
Guide <strong>to</strong> Thin Section Microscopy<br />
Double refraction<br />
there is no discernible change in light intensity as the stage is rotated (at least in colourless<br />
minerals), simply because the <strong>to</strong>tal light intensity from a 1 and a 2 remains constant.<br />
Anisotropic coloured minerals are, <strong>of</strong> course, expected <strong>to</strong> show a variation <strong>of</strong> absorption as<br />
the stage is turned (Ch. 4.2.1), and high-birefringent minerals may show variable refraction<br />
effects (Fig. 4-22).<br />
As both waves propagate in the crystal with different velocities (and correspondingly different<br />
refractive indices n z ' and n x '), a specific phase shift (= retardation gamma) is created by the<br />
time the light reaches the upper crystal surface (Fig. 4-24; in this example, the phase shift Γ is<br />
λ/2).<br />
Raith, Raase & Reinhardt – February 2012<br />
Figure 4-24. Vec<strong>to</strong>r construction for light intensities as the mineral is rotated from the<br />
extinction position in<strong>to</strong> a 45˚ diagonal position.<br />
83
Guide <strong>to</strong> Thin Section Microscopy<br />
Double refraction<br />
Retardation refers <strong>to</strong> the accumulated distance between the wave front <strong>of</strong> the fast wave<br />
(correlating with n x ') and that <strong>of</strong> the slow wave (correlating with n z ') by the time the slow<br />
wave reaches the crystal surface. As both waves revert back <strong>to</strong> identical wave velocity after<br />
leaving the crystal, retardation remains constant in the microscope from that point onwards,<br />
unless these light waves pass through another crystal (which they do if an accessory plate is<br />
inserted; see Ch. 4.2.4). In <strong>thin</strong> <strong>section</strong> <strong>microscopy</strong>, retardation is expressed in nm. In<br />
macroscopic crystals, retardation can be in the order <strong>of</strong> millimetres. Taking calcite as an<br />
example, O-wave and E-wave passing through a cleavage rhombohedron <strong>of</strong> 2 cm thickness<br />
have accumulated a retardation <strong>of</strong> 1.84 mm as they exit the crystal (light path orthogonal <strong>to</strong><br />
rhomb faces).<br />
The amount <strong>of</strong> retardation is determined by two fac<strong>to</strong>rs, (1) the difference between the two<br />
wave velocities, or expressed differently, by the birefringence value (∆n = n z ' – n x ') <strong>of</strong> the<br />
particular crystal <strong>section</strong> observed; and (2) by the thickness (d) <strong>of</strong> the crystal plate in the <strong>thin</strong><br />
<strong>section</strong>. Thus, Γ = d * (n z ' – n x ').<br />
The distance between bot<strong>to</strong>m and <strong>to</strong>p <strong>of</strong> the crystal plate (i.e., thickness d) can also be<br />
expressed as multiples <strong>of</strong> wavelengths (d = m*λ). As light <strong>of</strong> an initial wavelength λ i enters<br />
the crystal, two waves with different wavelengths are generated (slow wave: λ z' = λ i /n z' ; fast<br />
wave: λ x' = λ i /n x' ). If d is expressed as multiples <strong>of</strong> λ z' and λ x' , we get<br />
d = m 1 *λ z' = m 2 *λ x' or m 1 = d/λ z' and m 2 = d/λ x'<br />
Retardation is the difference between the multipliers m 1 and m 2 , multiplied by wavelength λ i :<br />
Γ = (m 1 – m 2 ) * λ i .<br />
Note that by the time the slow wave reaches the upper crystal surface, the fast wave has<br />
reverted <strong>to</strong> λ i and travelled the distance Γ outside the crystal.<br />
Thus, Γ = (d/λ z' – d/λ x' ) * λ i<br />
as λ z' = λ i /n z' and λ x' = λ i /n x' ,<br />
Γ = (d * n z' /λ i – d * n x' /λ i )∗λ i = d * (n z' - n x' ).<br />
Raith, Raase & Reinhardt – February 2012<br />
After leaving the crystal, the two waves with amplitudes a 1 and a 2 enter the analyzer with the<br />
retardation obtained wi<strong>thin</strong> the crystal plate. As shown by vec<strong>to</strong>r decomposition (Fig. 4-24)<br />
two waves <strong>of</strong> the same wavelength but reduced amplitudes (a 1 ' and a 2 ') come <strong>to</strong> lie in the<br />
analyzer's plane <strong>of</strong> polarization. The orthogonally oriented wave components are blocked by<br />
the analyzer. The relative amplitudes a 1 ' and a 2 ' <strong>of</strong> the transmitted waves depend entirely on<br />
the orientation <strong>of</strong> the vibration directions with respect <strong>to</strong> the polarizer and analyzer directions.<br />
They have their minimum (zero) in the dark image (= extinction) position and reach their<br />
maximum after rotation <strong>of</strong> 45° from the extinction position, in the diagonal position (Figs. 4-<br />
23, 4-24).<br />
84
Guide <strong>to</strong> Thin Section Microscopy<br />
Double refraction<br />
As the light waves enter the analyzer, they are reduced <strong>to</strong> their analyzer-parallel components,<br />
and are thus subject <strong>to</strong> interference. The amount <strong>of</strong> retardation controls whether two related<br />
waves obliterate each other completely, or whether they generate a resulting wave with an<br />
amplitude from any<strong>thin</strong>g above zero <strong>to</strong> maximum height (Fig. 4-25). It is important here <strong>to</strong><br />
appreciate the conditions for constructive and destructive interference <strong>of</strong> originally orthogonal<br />
waves which interfere in the analyzer (Figs. 4-24, 4-25) as opposed <strong>to</strong> the simple case<br />
<strong>of</strong> interference <strong>of</strong> two waves vibrating in a single plane (cf. Fig. 4-1).<br />
Considering interference <strong>of</strong> light waves in the N-S transmission direction <strong>of</strong> the analyzer, two<br />
extreme cases can be distinguished:<br />
Case A: If the retardation <strong>of</strong> the two waves corresponds <strong>to</strong> a phase shift <strong>of</strong> zero or wholenumber<br />
multiples <strong>of</strong> λ, the condition <strong>of</strong> complete destructive interference is realized. The<br />
analyzer-parallel wave components <strong>of</strong> this particular wavelength vibrate in opposite directions<br />
and hence obliterate each other. No light is passing the analyzer (Fig. 4-25A).<br />
Case B: If the retardation <strong>of</strong> the two waves corresponds <strong>to</strong> a phase shift <strong>of</strong> λ/2 or odd-number<br />
multiples <strong>of</strong> λ/2, the condition <strong>of</strong> maximum constructive interference is realized. The<br />
analyzer-parallel wave components <strong>of</strong> this particular wavelength vibrate parallel (“in phase”)<br />
and thus are superimposed <strong>to</strong> form an interference wave <strong>of</strong> maximum amplitude (i.e.,<br />
maximum light intensity). The light is completely transmitted by the analyzer (Fig. 4-25B), if<br />
absorption effects <strong>of</strong> the polarizing filter are disregarded.<br />
For any retardation between these extremes the intensity <strong>of</strong> the light transmitted by the<br />
analyzer is reduced <strong>to</strong> a certain degree, depending on the exact phase shift (e.g., 50% for ¼ λ<br />
and ¾ λ). If monochromatic light was used, mineral grains <strong>of</strong> variable orientation in a <strong>thin</strong><br />
<strong>section</strong> would show different levels <strong>of</strong> brightness, between black and maximum brightness, as<br />
∆n depends on crystal orientation, and retardation is a function <strong>of</strong> ∆n (Γ = d*∆n; d = const).<br />
Mineral grains with wedging-out edges would show a bright-and-dark-striped pattern corresponding<br />
<strong>to</strong> a continuous variation in Γ relating <strong>to</strong> the change in d (∆n = const).<br />
Crystal <strong>section</strong>s observed in white light under crossed polarizers appear in characteristic<br />
interference colours that vary only in intensity as the microscope stage is turned, as long as<br />
the mineral is in an <strong>of</strong>f-extinction position (Fig. 4-26).<br />
Raith, Raase & Reinhardt – February 2012<br />
Figure 4-26. Interference colour <strong>of</strong> a forsterite crystal as the stage is rotated from the extinction<br />
position in<strong>to</strong> a 45° diagonal position. The interference colour does not change during<br />
rotation, but its intensity does. In the crystal <strong>section</strong> parallel (100) birefringence is (n y –n x ) =<br />
0.015 and retardation thus amounts <strong>to</strong> 25*10 3 nm * 0.015 = 375 nm.<br />
85
Guide <strong>to</strong> Thin Section Microscopy<br />
Double refraction<br />
Raith, Raase & Reinhardt – February 2012<br />
Figure 4-25A. Schematic presentation <strong>of</strong> the behaviour <strong>of</strong> light passing through a birefringent<br />
crystal which is in a diagonal position. Polarizers are crossed. For simplicity, only monochromatic<br />
light is shown. Retardation is 1λ. For explanations see p. 88.<br />
86
Guide <strong>to</strong> Thin Section Microscopy<br />
Double refraction<br />
Raith, Raase & Reinhardt – February 2012<br />
Figure 4-25B. Schematic presentation <strong>of</strong> the behaviour <strong>of</strong> light passing through a birefringent<br />
crystal which is in a diagonal position. Polarizers are crossed. For simplicity, only monochromatic<br />
light is shown. Retardation is ½ λ. For explanations see p. 88.<br />
87
Guide <strong>to</strong> Thin Section Microscopy<br />
Double refraction<br />
Explanations for Figures 4-25A and 4-25B<br />
Case A: Maximum destructive interference (0% transmission by the analyzer) if the<br />
retardation accumulated in the crystal is 1λ. The same applies if the retardation is zero or a<br />
whole-number multiple <strong>of</strong> λ [Γ = n*λ; n = 0,1,2,3,…].<br />
A light wave emitted from a light source experiences the following modifications (3-D<br />
model): E-W polarization in the lower polarizer; splitting up in<strong>to</strong> two light waves with<br />
mutually perpendicular vibration directions as the light enters a birefringent crystal. Inside the<br />
crystal the two waves travel at different velocity and have different wavelengths. As the two<br />
waves exit the crystal they maintain their vibration directions but revert back <strong>to</strong> the<br />
wavelength and velocity <strong>of</strong> light below the crystal. From the point <strong>of</strong> exit the retardation<br />
accumulated wi<strong>thin</strong> the crystal remains constant. The analyzer-parallel (N-S) components <strong>of</strong><br />
the two waves entering the analyzer vibrate in opposite directions and thus eliminate each<br />
other by interference.<br />
Case B: Maximum constructive interference (transmission by the analyzer at maximum<br />
amplitude) if the retardation accumulated in the crystal is λ/2. The same applies if the<br />
retardation is an odd-number multiple <strong>of</strong> λ/2 [Γ = (2n+1)*λ/2; n = 0,1,2,3,…].<br />
A light wave emitted from a light source experiences the following modifications (3-D<br />
model): E-W polarization in the lower polarizer; splitting up in<strong>to</strong> two light waves with<br />
mutually perpendicular vibration directions as the light enters a birefringent crystal. Inside the<br />
crystal the two waves travel at different velocity and have different wavelengths. As the two<br />
waves exit the crystal they maintain their vibration directions but revert back <strong>to</strong> the<br />
wavelength and velocity <strong>of</strong> light below the crystal. From the point <strong>of</strong> exit the retardation<br />
accumulated wi<strong>thin</strong> the crystal remains constant. The analyzer-parallel (N-S) components <strong>of</strong><br />
the two waves entering the analyzer vibrate in parallel arrangement and thus produce a<br />
resulting wave <strong>of</strong> maximum amplitude.<br />
Raith, Raase & Reinhardt – February 2012<br />
Green: Plane-polarized light exiting the polarizer. Red: fast wave inside the crystal (correlates<br />
with n x ') and its corresponding wave outside the crystal; blue: slow wave inside the crystal<br />
(correlates with n z ') and its corresponding wave outside the crystal.<br />
The left-hand side <strong>of</strong> Figs. A and B (column 1) displays schematic 3-D presentations <strong>of</strong> the<br />
crystal, the polarizers and the light waves. The vec<strong>to</strong>r decomposition <strong>of</strong> the original light<br />
wave as it enters the crystal as well as the vec<strong>to</strong>r relationships in the analyzer are shown in a<br />
view from the <strong>to</strong>p (i.e., in the direction <strong>of</strong> the microscope axis; column 2). The same viewing<br />
direction applies <strong>to</strong> the vibration directions at the various positions <strong>of</strong> light transmission in the<br />
microscope (column 4). Column 3 represents a projection <strong>of</strong> the light waves in<strong>to</strong> an E-W<br />
plane containing the microscope axis. It should be noted that the red and blue light waves<br />
vibrate at 45° <strong>to</strong> the drawing plane and perpendicular <strong>to</strong> each other (as seen in the 3-D<br />
models). The light exiting the analyzer in the case <strong>of</strong> constructive interference (case B)<br />
vibrates N-S und hence perpendicular <strong>to</strong> the projection plane.<br />
88
Guide <strong>to</strong> Thin Section Microscopy<br />
Double refraction<br />
Interference colours:<br />
In contrast <strong>to</strong> monochromatic light, the use <strong>of</strong> white light provides a full spectrum <strong>of</strong> wavelengths<br />
(spectral colours) which, for a given retardation, is modified in the analyzer through<br />
interference such that certain wavelengths are transmitted at full intensity; others are reduced<br />
<strong>to</strong> a variable degree or are obliterated entirely. White light exiting a colourless anisotropic<br />
crystal comprises an infinite number <strong>of</strong> wave couples corresponding <strong>to</strong> all spectral colours,<br />
each wavelength represented by a wave couple with mutually orthogonal vibration directions<br />
that are fixed by the crystal's orientation (cf. Figs. 4-25A and B which show such single wave<br />
couples). Interference in the analyzer between the two waves <strong>of</strong> each couple across the light<br />
spectrum is a way <strong>of</strong> making retardation visible and also quantifiable. Any specific<br />
retardation modifies the full white-light spectrum, generating a characteristic wavelength<br />
spectrum and wave amplitude pattern, which in combination produce a unique interference<br />
colour. Evidently, interference colours can only be generated from polychromatic light. They<br />
correlate directly with retardation. The sequence <strong>of</strong> interference colours in relation <strong>to</strong><br />
increasing retardation is explained graphically in Figs. 4-27 and 4-28.<br />
Raith, Raase & Reinhardt – February 2012<br />
Figure 4-27. Constructive and destructive interference as a function <strong>of</strong> wavelength λ and<br />
retardation Γ in the spectral range <strong>of</strong> visible light (see also Fig. 4-28). The variation <strong>of</strong> the<br />
intensity <strong>of</strong> the light being transmitted by the analyzer is described by the equation I =<br />
100[sin 2 (Γ/λ)180°].<br />
To give a few examples: In the lower range <strong>of</strong> retardation (Γ = 0 ↔ 200 nm) black and grey<br />
colour <strong>to</strong>nes dominate as the complete colour spectrum <strong>of</strong> white light is affected by a<br />
reduction <strong>of</strong> intensities. At around Γ = 250 nm only wavelengths from both ends <strong>of</strong> the<br />
spectrum are slightly diminished which is perceived as close <strong>to</strong> white ("first-order white").<br />
The range Γ = 400 ↔ 500 nm shows characteristic orange <strong>to</strong> light red interference colours, as<br />
blue and green wavelengths are suppressed, while longer wavelengths dominate the spectrum.<br />
This situation is reverse in the range Γ = 600 ↔ 650 nm. Here, the shorter wavelengths<br />
dominate, which results in a blue interference colour. The distinctive purple colour at Γ = 551<br />
nm ("first-order red") lies in a position where the intermediate wavelengths (green <strong>to</strong> orange)<br />
89
Guide <strong>to</strong> Thin Section Microscopy<br />
Double refraction<br />
Raith, Raase & Reinhardt – February 2012<br />
Figure 4-28. Graphical presentation explaining the sequence <strong>of</strong> interference colours. The<br />
interference colour for a specific value <strong>of</strong> Γ derives from the sum <strong>of</strong> all wavelength amplitudes<br />
in the visible spectrum that have been modified by interference in the analyzer (or, in<br />
other words, the sum <strong>of</strong> intensities <strong>of</strong> all wavelengths across the spectrum after interference in<br />
the analyzer). As can be derived from the figure, a specific interference colour in its precise<br />
spectral composition cannot occur more than once in the colour chart (cf. Fig. 4-27).<br />
90
Guide <strong>to</strong> Thin Section Microscopy<br />
Double refraction<br />
are "filtered out", while red and blue hues dominate. The range Γ = 500 ↔ 1500 nm is<br />
characterized by relatively intense colours due <strong>to</strong> elimination or reduction <strong>of</strong> one or two<br />
relatively narrow spectral intervals for each Γ value. For high retardation values (Γ > 1500<br />
nm) an increasing number <strong>of</strong> spectral domains distributed over the full wavelength spectrum<br />
is subtracted which produces increasingly pale colour <strong>to</strong>nes and, at very high Γ, an<br />
interference colour that is perceived as white. As can be derived from Fig. 4-27, at very high<br />
retardation the interference colour spectrum consists <strong>of</strong> a narrow-spaced and evenly<br />
distributed arrangement <strong>of</strong> domains <strong>of</strong> constructive and destructive interference, such that<br />
none <strong>of</strong> the major colour bands is cut out completely.<br />
Thus, the interference colour spectrum starts with black (Γ = 0) and progresses through grey,<br />
white, yellow, and orange <strong>to</strong> a succession <strong>of</strong> intense colours <strong>of</strong> red → blue → green → yellow<br />
→ orange → red, which repeats itself with increasing retardation, while getting more and<br />
more pale (Fig. 4-29; Michel-Lévy colour chart). The colour sequence is subdivided in<strong>to</strong><br />
colour orders using the distinctive purplish reds (in steps <strong>of</strong> 551 nm). From the 4 th order<br />
upwards, the interference colours are dominated by alternating greenish and reddish hues.<br />
With increasing retardation these fade more and more and eventually approach white (Fig. 4-<br />
33). This is referred <strong>to</strong> as high-order white (in contrast <strong>to</strong> first-order white).<br />
Raith, Raase & Reinhardt – February 2012<br />
The first graphical presentation between retardation, crystal thickness and birefringence [Γ =<br />
d*(n z '–n x ')] was published by Michel-Lévy (1888, Tableau des biréfringences in "Les<br />
Minéraux des Roches", Paris). This interference colour chart which shows just over four<br />
colour orders is used <strong>to</strong> this day as a useful standard <strong>to</strong>ol for mineral determination at the<br />
microscope. Improvements in printing technique over time ensured that modern colour charts<br />
are a reasonably close reproduction <strong>of</strong> the interference colour spectrum observed in polarizedlight<br />
microscopes (such as the colour charts <strong>of</strong> Zeiss and Leica). Nevertheless, some<br />
weaknesses in colour reproduction are evident like the second-order green which is far <strong>to</strong>o<br />
prominent in most colour charts. The Michel-Lévy colour chart <strong>of</strong> this <strong>guide</strong> provides an<br />
improved reproduction <strong>of</strong> the colour spectrum (Fig. 4-29). It has been calculated by Dr. Bjørn<br />
Eske Sørensen (Department <strong>of</strong> Geology and Mineral Resources Engineering, NTNU-Trondheim,<br />
Norway) using MATLAB. The spectrum has been calculated taking in<strong>to</strong> account human<br />
colour perception (CIE-calibrated curves <strong>of</strong> sensitivity for the primary colours red, green,<br />
blue) and the RGB colour space <strong>of</strong> the computer. Conformity between calculated and<br />
observed interference colours was further optimised using the gamma correction <strong>of</strong> the<br />
intensity values.<br />
When redesigning the Michel-Lévy colour chart for this <strong>guide</strong> we modified the presentation<br />
such that the application principle for mineral determination is easy <strong>to</strong> grasp, compared with<br />
the widely distributed standard charts <strong>of</strong> Zeiss or Leica (Figs. 4-29 and 4-32). Guided by our<br />
experience with <strong>microscopy</strong> courses we also developed an alternative concept for the<br />
interference colour chart. We believe this chart is easier <strong>to</strong> read where birefringence values or<br />
crystal thickness need <strong>to</strong> be determined, compared with the classic colour chart. The difference<br />
<strong>to</strong> the standard Michel-Lévy colour chart is that the colours representing retardation are<br />
91
Guide <strong>to</strong> Thin Section Microscopy<br />
Double refraction<br />
Raith, Raase & Reinhardt – February 2012<br />
Figure 4-29. Γ-d Interference colour chart after Michel-Lévy.<br />
The birefringence values <strong>of</strong> the radial lines in the colour chart are correlated with common rockforming<br />
minerals. The use <strong>of</strong> the colour chart for mineral identification and determination <strong>of</strong> crystal<br />
thickness is explained in the text and is further demonstrated in Fig. 4-32.<br />
92
Guide <strong>to</strong> Thin Section Microscopy<br />
Double refraction<br />
Raith, Raase & Reinhardt – February 2012<br />
Figure 4-30. ∆n-d Interference colour chart after Raith-Sørensen.<br />
The birefringence values <strong>of</strong> the colour chart are correlated with common rock-forming minerals. The<br />
use <strong>of</strong> the colour chart for mineral identification and determination <strong>of</strong> crystal thickness is explained in<br />
the text and is further demonstrated in Fig. 4-32.<br />
93
Guide <strong>to</strong> Thin Section Microscopy<br />
Double refraction<br />
arranged as a function <strong>of</strong> birefringence and crystal (or <strong>thin</strong> <strong>section</strong>) thickness (Fig. 4-30). The<br />
resulting, more complex hyperbolic colour arrangement has been calculated by Bjørn Eske<br />
Sørensen using MATLAB. The correlation between the birefringence value <strong>of</strong> an unknown<br />
mineral in a <strong>section</strong> <strong>of</strong> known thickness and the mineral's interference colour can be<br />
conceived intuitively (Fig. 4-32, right-hand side). Similarly, reading the <strong>thin</strong> <strong>section</strong> thickness<br />
from the reconfigured colour chart using the maximum interference colour <strong>of</strong> a known<br />
mineral is straightforward. The dependence <strong>of</strong> interference colour on <strong>thin</strong> <strong>section</strong> thickness is<br />
immediately evident. However, for getting the numerical correlation between retardation and<br />
∆n, or between retardation and d, the Michel-Lévy chart is the better choice.<br />
When using interference colours for the determination <strong>of</strong> minerals it has <strong>to</strong> be kept in mind<br />
that the retardation which accumulates as the waves pass through the crystal is not only<br />
dependent on ∆n <strong>of</strong> that particular crystal <strong>section</strong>, but also on the thickness <strong>of</strong> the sample. In<br />
order <strong>to</strong> correlate interference colours and birefringence values directly, the <strong>thin</strong> <strong>section</strong><br />
thickness has <strong>to</strong> be known. Therefore, <strong>thin</strong> <strong>section</strong>s are prepared with a defined standard<br />
thickness (commonly 25 or 30 μm). However, there may be reasons <strong>to</strong> deviate from these<br />
standard values, for example, if the contrast <strong>of</strong> interference colours between low-birefringent<br />
phases is <strong>to</strong> be increased; or, <strong>to</strong> improve the contrast between differently oriented grains <strong>of</strong><br />
extremely high-birefringent minerals, the interference colours can be reduced <strong>to</strong> a lower order<br />
(as in ultra-<strong>thin</strong> <strong>section</strong>s <strong>of</strong> carbonates).<br />
Raith, Raase & Reinhardt – February 2012<br />
Figure 4-31. Relation between interference colour and grain (crystal) orientation <strong>of</strong> anisotropic<br />
minerals, using quartz, diopside and anhydrite as examples.<br />
A: The euhedral quartz crystals from a vein show creamy-white <strong>to</strong> dark grey first-order interference<br />
colours. Creamy-white crystals: <strong>section</strong>s parallel <strong>to</strong> the c-axis [max. birefringence (n e – n o ) = 0.009];<br />
dark grey crystal: <strong>section</strong> nearly orthogonal <strong>to</strong> c [circular indicatrix <strong>section</strong> showing n o ; birefringence =<br />
0].<br />
B: The diopside grains in a calcsilicate rock show different interference colours, dependent on crystal<br />
orientation, ranging from second-order blue-green <strong>to</strong> first-order dark grey. Blue-green grain: <strong>section</strong><br />
parallel <strong>to</strong> (010) resp. optic axial plane [max. birefringence (n z – n x ) = 0.031]; dark grey grain: <strong>section</strong><br />
nearly orthogonal <strong>to</strong> one <strong>of</strong> the two optic axes [circular indicatrix <strong>section</strong> showing n y ; birefringence =<br />
0].<br />
C: The anhydrite grains show different interference colours, dependent on crystal orientation, ranging<br />
from third-order red <strong>to</strong> first-order (near-)black. Pale red grains: <strong>section</strong> parallel <strong>to</strong> (010) resp. optic<br />
axial plane [max. birefringence (n z – n x ) = 0.044]; black grain: <strong>section</strong> orthogonal <strong>to</strong> one <strong>of</strong> the two<br />
optic axes [circular indicatrix <strong>section</strong> showing n y ; birefringence = 0].<br />
94
Guide <strong>to</strong> Thin Section Microscopy<br />
Double refraction<br />
Figure 4-32. Determination <strong>of</strong> birefringence and <strong>thin</strong> <strong>section</strong> thickness using interference colour.<br />
Raith, Raase & Reinhardt – February 2012<br />
Left-hand side: (A) Variation <strong>of</strong> interference colours in differently oriented forsterite grains; (B) <strong>to</strong> (D)<br />
Decreasing interference colours at wedge-shaped grain edges <strong>of</strong> forsterite grains in different<br />
crystallographic orientation. The crystal <strong>section</strong> D shows the highest interference colour (2 nd order<br />
yellow-green) and is oriented orthogonal <strong>to</strong> c, i.e. parallel <strong>to</strong> (001) with principal vibration directions<br />
Z//a and X//b. (E) In this quartzite <strong>thin</strong> <strong>section</strong>, grains <strong>section</strong>ed parallel <strong>to</strong> c show the highest<br />
interference colour (1 st order creamy white); these are <strong>section</strong>s containing the principal vibration<br />
directions E = Z//c and O = X⊥c.<br />
Right-hand side, <strong>to</strong>p: Determination <strong>of</strong> birefringence (n z – n x ) <strong>of</strong> forsterite (<strong>section</strong> D) in a standard<br />
<strong>thin</strong> <strong>section</strong> <strong>of</strong> known thickness (25 μm) taking the maximum interference colour observed in <strong>thin</strong><br />
<strong>section</strong> [(Γ-d colour chart after Michel-Lévy].<br />
Right-hand side, bot<strong>to</strong>m: Determination <strong>of</strong> <strong>thin</strong> <strong>section</strong> thickness from the maximum interference<br />
colour observed for a mineral with known birefringence. Examples are shown for forsterite (∆n =<br />
0.032; grain <strong>section</strong> D) and quartz (∆n = 0.009; creamy white grains in <strong>section</strong> E) [∆n-d colour chart<br />
after Raith-Sørensen].<br />
The determination procedures as shown on the right-hand side may be applied in reverse, <strong>of</strong> course,<br />
with both types <strong>of</strong> colour charts.<br />
95
Guide <strong>to</strong> Thin Section Microscopy<br />
Double refraction<br />
Determination <strong>of</strong> birefringence using the interference colour: Birefringence is an<br />
important property <strong>of</strong> anisotropic minerals and is crucial for mineral determination. However,<br />
the amount <strong>of</strong> birefringence <strong>of</strong> a specific mineral depends on the orientation <strong>of</strong> the <strong>section</strong>. In<br />
optically uniaxial minerals it varies from zero in the <strong>section</strong> perpendicular <strong>to</strong> the optic axis<br />
(direction <strong>of</strong> optical isotropy), <strong>to</strong> a maximum value (|n e -n o |) in <strong>section</strong>s parallel <strong>to</strong> the optic<br />
axis. In optically biaxial minerals it varies from zero in <strong>section</strong>s perpendicular <strong>to</strong> one <strong>of</strong> the<br />
two optic axes, <strong>to</strong> a maximum value (n z -n x ) in the <strong>section</strong> parallel <strong>to</strong> the optic plane. For this<br />
reason, the grains <strong>of</strong> each anisotropic mineral show different interference colours in <strong>thin</strong><br />
<strong>section</strong> dependent on their crystallographic orientation (Figs. 4-31). For routine mineral<br />
identification, only the maximum birefringence (∆n = n z -n x ) values are critical (Fig. 4-32),<br />
and these values are commonly listed in mineral-optical tables or compilations.<br />
The determination <strong>of</strong> interference colours may be difficult in highly birefringent minerals<br />
(such as carbonates: so-called high-order white). Wedge-shaped grain boundaries provide a<br />
means <strong>to</strong> observe the colour spectrum, in relation <strong>to</strong> decreasing crystal thickness, down <strong>to</strong><br />
first-order black (Fig. 4-33).<br />
Raith, Raase & Reinhardt – February 2012<br />
Figure 4-33. A. Calcite grains in a <strong>thin</strong> <strong>section</strong> <strong>of</strong> marble appear in high-order white (+Pol).<br />
B. The wedge-shaped margin <strong>of</strong> a calcite grain shows a spectrum <strong>of</strong> decreasing interference<br />
colours from the interior plateau <strong>to</strong> the outer edge as the crystal thickness decreases from 25<br />
<strong>to</strong> 0 μm. Five colour orders can be recognised using the red bands as a reference. C. A calcite<br />
grain cut exactly parallel <strong>to</strong> the c axis would show an 8 th order white at a standard thickness<br />
<strong>of</strong> 25 μm.<br />
96
Guide <strong>to</strong> Thin Section Microscopy<br />
Double refraction<br />
Interference colour and zoning <strong>of</strong> minerals: In minerals with extensive solid solution, the<br />
optical properties vary with chemical composition, including birefringence. Chemical zoning<br />
in crystals can then be recognised from the conspicuous zoning <strong>of</strong> the interference colour.<br />
Particularly impressive examples are plagioclases and titanaugites with oscilla<strong>to</strong>ry zoning, as<br />
found in certain volcanic rocks, zoned melilite in slags, and epidote in metamorphic rocks<br />
(Fig. 4-34).<br />
Figure 4-34. Zoning <strong>of</strong> interference colour in plagioclase (A), titanaugite (B), sodic amphibole<br />
(C) and epidote (D).<br />
Growth zoning with oscilla<strong>to</strong>ry variations in composition characterises the volcanic plagioclase and<br />
augite. The sodic amphibole has a Fe 3+ -rich core (crossite) and a Fe 3+ -poor rim (glaucophane). The<br />
decrease <strong>of</strong> interference colours <strong>to</strong>wards the edge <strong>of</strong> the epidote grain indicates decreasing Fe 3+<br />
contents during grain growth.<br />
The interference colours <strong>of</strong> coloured minerals may be masked significantly as they overlap<br />
with the minerals' own colour (examples: hornblende, biotite). In strongly coloured minerals<br />
<strong>of</strong> high birefringence, the primary mineral colour will be dominant under crossed polarizers.<br />
A relatively pale interference colour or a high-order white can hardly impose a noticeable<br />
spectral shift on the mineral's own colour as the two overlie each other (example: rutile).<br />
Raith, Raase & Reinhardt – February 2012<br />
Anomalous interference colours: The interference colours <strong>of</strong> certain minerals deviate from<br />
the normal colour scheme. Instead <strong>of</strong> the grey <strong>to</strong> white colours in the first order <strong>of</strong> the<br />
interference colour spectrum, leather brown, ink blue <strong>to</strong> grey-blue colours are observed (Fig.<br />
4-35,36). Such "anomalous" interference colours are generated by a strong dispersion <strong>of</strong><br />
birefringence, which means that the latter attains distinctly different values for different<br />
wavelengths (colours). In the melilite example, the value <strong>of</strong> birefringence becomes zero for<br />
wavelengths in the range orange-yellow-green. Hence, these colours are not contributing <strong>to</strong><br />
the interference colour (cf. Fig. 4-28).<br />
Figure 4-35. Examples <strong>of</strong> anomalous interference colours: A. Titanaugite (sec<strong>to</strong>r structure<br />
and oscilla<strong>to</strong>ry zoning); B. Clinozoisite; C. Zoisite; D. Vesuvianite; E. Melilite (continuous<br />
zoning with åkermanite-rich core and gehlenite-rich rim).<br />
B C D<br />
97
Guide <strong>to</strong> Thin Section Microscopy<br />
Double refraction<br />
Raith, Raase & Reinhardt – February 2012<br />
Figure 4-36. Anomalous interference colours in chlorite and melilite. Anomalous blue or<br />
leather-brown interference colours occur in solid solutions with birefringence values close <strong>to</strong><br />
zero. The higher birefringent members <strong>of</strong> the solid solution series show normal light grey <strong>to</strong><br />
creamy white interference colours <strong>of</strong> the first order.<br />
98
Guide <strong>to</strong> Thin Section Microscopy<br />
Double refraction<br />
Raith, Raase & Reinhardt – February 2012<br />
Figure 4-37. Diagram showing refractive index versus birefringence for rock-forming<br />
minerals.<br />
Optic class and sign (uniaxial – biaxial; positive – negative), if unknown, must be determined<br />
with conoscopic methods. Bold circles mark the optically uniaxial minerals. Glasses and<br />
cubic minerals are optically isotropic (∆n = 0). For each anisotropic mineral in a <strong>thin</strong> <strong>section</strong><br />
<strong>of</strong> given thickness, the highest interference colour can be read from the ∆n-d interference<br />
colour chart <strong>of</strong> Raith-Sørensen.<br />
Mineral abbreviations after Whitney & Evans (<strong>America</strong>n Mineralogist, 95, 185-187, 2010).<br />
99
Guide <strong>to</strong> Thin Section Microscopy<br />
Extinction<br />
4.2.4 Extinction positions in birefringent crystal <strong>section</strong>s<br />
Vibration direction and extinction character<br />
In optically anisotropic crystals, crystal symmetry, and in low-symmetry solid solutions also<br />
composition, controls the form and spatial orientation <strong>of</strong> the indicatrix (Figs. 4-6,7). The<br />
regular spatial relationships imply that the orientation <strong>of</strong> vibration directions with respect <strong>to</strong><br />
morphological elements (crystal faces, crystal edges, cleavage planes, twin planes) is fixed in<br />
birefringent crystal <strong>section</strong>s. The resulting extinction behaviour allows a distinction between<br />
minerals <strong>of</strong> higher symmetry (hexagonal, trigonal, tetragonal and orthorhombic) and those <strong>of</strong><br />
lower symmetry (monoclinic, triclinic) (Fig. 4-38). Three general types <strong>of</strong> extinction can be<br />
distinguished:<br />
Straight extinction: the vibration directions lie parallel <strong>to</strong> the morphological reference<br />
directions (ε = 0˚).<br />
Symmetrical extinction: the vibration directions bisect the angles between two equivalent<br />
morphological reference directions (ε 1 = ε 2 ).<br />
Inclined extinction: the vibration directions form any angle (ε ≠ 0˚, ≠ 90˚) with morphological<br />
reference directions.<br />
Raith, Raase & Reinhardt – February 2012<br />
Figure 4-38. Crystal symmetry and extinction behaviour.<br />
The orientation <strong>of</strong> the crystals shown here corresponds <strong>to</strong> the extinction position. The cross in each<br />
figure indicates the two polarizer directions resp. the crosshairs.<br />
100
Guide <strong>to</strong> Thin Section Microscopy<br />
Extinction<br />
Extinction angle<br />
The angle between a vibration direction and the morphological reference element (crystal<br />
edge, cleavage, twin plane) in a crystal <strong>section</strong> is referred <strong>to</strong> as the extinction angle.<br />
Extinction angles are useful for the characterisation <strong>of</strong> monoclinic and triclinic minerals.<br />
Example clinopyroxene: The monoclinic members <strong>of</strong> the pyroxene group show a correlation<br />
between extinction angle ε, measured between vibration direction Z (n z ) and the trace <strong>of</strong><br />
(100) in a crystal <strong>section</strong> parallel <strong>to</strong> (010), and chemical composition, i.e. the type <strong>of</strong><br />
clinopyroxene (Fig. 4-39). The angle can be expressed as ε = Z Λ c.<br />
Figure 4-39. Extinction angle in clinopyroxenes<br />
A: Relation between composition and extinction angle ε = Z Λ c in crystal <strong>section</strong>s parallel <strong>to</strong> (010) for<br />
some important members <strong>of</strong> the clinopyroxene group. The c-direction corresponds <strong>to</strong> the traces <strong>of</strong><br />
(100) crystal faces or the traces <strong>of</strong> the {110} cleavage. B: Method <strong>of</strong> determining the extinction angle.<br />
Reading I: position <strong>of</strong> reference morphological element parallel <strong>to</strong> the N-S line <strong>of</strong> the crosshairs.<br />
Reading II: extinction position.<br />
Raith, Raase & Reinhardt – February 2012<br />
Practical hints: The precise determination <strong>of</strong> extinction angles requires specific crystal<br />
orientations. In the case <strong>of</strong> clinopyroxene, these are crystal <strong>section</strong>s with the highest<br />
interference colour (Fig. 4-39). The extinction angle is determined in the same way as<br />
measuring angles between morphological planes (e.g., cleavage planes), whereby the<br />
polarizers must be exactly oriented in E-W resp. N-S direction. The measurement is done in<br />
two steps (Figs. 4-39 B): (1) Rotation <strong>of</strong> the morphological reference direction (trace <strong>of</strong> a<br />
crystal face or cleavage) in<strong>to</strong> N-S direction (= N-S line <strong>of</strong> the crosshairs) and reading the<br />
angle value I from the vernier on the microscope stage; (2) rotation <strong>of</strong> the vibration direction<br />
in<strong>to</strong> N-S direction (which is equivalent <strong>to</strong> the extinction position <strong>of</strong> the crystal <strong>section</strong>) and<br />
reading the angle value II at the vernier. The difference between the values is the extinction<br />
angle ε.<br />
Example clinoamphibole: The monoclinic members <strong>of</strong> the amphibole group show a<br />
correlation between extinction angle ε, measured between vibration directions Z, Y or X and<br />
the trace <strong>of</strong> (100) in a crystal <strong>section</strong> parallel <strong>to</strong> (010), and chemical composition, i.e. the type<br />
<strong>of</strong> clinoamphibole (Fig. 4-40 A). The measurement <strong>of</strong> the extinction angle is shown in Fig. 4-<br />
40 B and is carried out in the same way as for clinopyroxene.<br />
101
Guide <strong>to</strong> Thin Section Microscopy<br />
Extinction<br />
Figure 4-40. Extinction angle in clinoamphiboles<br />
A: Relation between composition and extinction angle ε = X,Y,Z Λ c in crystal <strong>section</strong>s parallel <strong>to</strong><br />
(010) for some important members <strong>of</strong> the clinoamphibole group; B: Method <strong>of</strong> determining the<br />
extinction angle.<br />
Example plagioclase: In plagioclase solid solutions, the orientation <strong>of</strong> the indicatrix in<br />
relation <strong>to</strong> the axes a, b and c <strong>of</strong> the triclinic crystal varies, dependent on anorthite content<br />
and the degree <strong>of</strong> Al/Si ordering. The vibration directions <strong>of</strong> the pair <strong>of</strong> waves change<br />
accordingly in crystal <strong>section</strong>s <strong>of</strong> defined orientation. At a constant degree <strong>of</strong> ordering, the<br />
vibration directions depend on anorthite content alone (Fig. 4-41 A,B).<br />
Raith, Raase & Reinhardt – February 2012<br />
Figure 4-41 A. Relation between indicatrix orientation and anorthite content in plagioclase<br />
with maximum Al-Si order (from slowly cooled plu<strong>to</strong>nic and metamorphic rocks).<br />
The anorthite content <strong>of</strong> plagioclase solid solutions in such rocks can be determined reasonably well<br />
by measuring the extinction angle ε. ε is the angle between the vibration direction X' and the trace <strong>of</strong><br />
(010) in a <strong>section</strong> orthogonal <strong>to</strong> the direction [100] (Method <strong>of</strong> Rittmann, 1929).<br />
102
Guide <strong>to</strong> Thin Section Microscopy<br />
Extinction<br />
Figure 4-41 B,C. Extinction angle ε in plagioclase crystal <strong>section</strong>s ⊥ [100]<br />
Practical hints: The determination <strong>of</strong> anorthite content by measuring the extinction angle ε<br />
("zone method" <strong>of</strong> Rittmann 1929; Burri et al., 1967) requires crystal <strong>section</strong>s that are<br />
oriented exactly orthogonal <strong>to</strong> [100]. In such crystal <strong>section</strong>s, the (010) interfaces <strong>of</strong> albite<br />
twins as well as the (001) cleavage traces occur as sharply defined, <strong>thin</strong> lines (Fig. 4-41 A,C).<br />
They form an acute angle <strong>of</strong> 86˚. Wider (010) lamellae relating <strong>to</strong> the Carlsbad twin law do<br />
not show (001) cleavage traces. If the (010) traces are rotated in<strong>to</strong> N-S direction, the two sets<br />
<strong>of</strong> albite twin lamellae show identical interference colours if the grain is appropriately<br />
oriented (Fig. 4-41 C). Carlsbad twins display a different interference colour if placed in this<br />
position. In order <strong>to</strong> distinguish albite lamellae from the common pericline twin lamellae<br />
oriented nearly parallel <strong>to</strong> (001), one <strong>of</strong> the two twin lamellae sets is rotated out <strong>of</strong> the<br />
extinction position anticlockwise by 45˚, and the first-order red plate is inserted. Increase <strong>of</strong><br />
interference colours → albite twins; decrease <strong>of</strong> interference colours → pericline lamellae.<br />
Raith, Raase & Reinhardt – February 2012<br />
The measurement <strong>of</strong> the anorthite content involves two steps (Fig. 4-41 C): (1) Rotation <strong>of</strong><br />
the morphological reference direction ((010) twin plane) in<strong>to</strong> N-S orientation (= N-S line <strong>of</strong><br />
the ocular crosshairs) and reading <strong>of</strong> the angle value I from the vernier <strong>of</strong> the microscope<br />
stage; (2) rotation <strong>of</strong> the vibration direction X' in<strong>to</strong> N-S orientation (which corresponds <strong>to</strong> the<br />
extinction position <strong>of</strong> one set <strong>of</strong> twin lamellae) and reading <strong>of</strong> the angle value II at the<br />
vernier. The difference <strong>of</strong> both angle values equates <strong>to</strong> the extinction angle ε. (3) In order <strong>to</strong><br />
obtain the sign <strong>of</strong> the extinction angle ε, it must be checked whether X' lies in the acute or in<br />
the obtuse angle between the morphological reference directions (010) and (001) inside the<br />
respective twin lamellae. Since the observed twin set is in extinction, it is advisable <strong>to</strong> insert<br />
the first-order red plate. If X' lies in the obtuse angle (An 0-20 ), ε is negative; if X' lies in the<br />
acute angle (An 20-100 ), ε is positive (Fig. 4-41 B).<br />
For the example shown (plagioclase from Lindenfels Gabbro, Germany), the measured<br />
extinction angle <strong>of</strong> 31˚ indicates an anorthite content <strong>of</strong> 57 mole% (Fig. 4-41 B).<br />
103
Guide <strong>to</strong> Thin Section Microscopy<br />
Extinction<br />
Optical character <strong>of</strong> the extinction directions<br />
If a birefringent crystal <strong>section</strong> is in extinction position, the vibration directions Z' and X‘ are<br />
parallel <strong>to</strong> the N-S and E-W directions <strong>of</strong> the crosshairs (cf. Fig. 4-23). For a variety <strong>of</strong><br />
applications it may be important <strong>to</strong> know which direction corresponds <strong>to</strong> the higher,<br />
respectively lower, refractive index:<br />
• Determination <strong>of</strong> mineral colour in a specific vibration direction (cf. Ch. 4.2.1).<br />
• Determination <strong>of</strong> optical sign <strong>of</strong> optically uniaxial minerals which are elongate in c<br />
direction or platy having the basal plane ({001}, {0001}) as the dominant crystal face.<br />
• Determination <strong>of</strong> sign <strong>of</strong> elongation (l) <strong>of</strong> acicular <strong>to</strong> columnar, platy or flaky minerals in<br />
elongate crystal <strong>section</strong>s.<br />
For a distinction between vibration directions Z' and X‘, compensa<strong>to</strong>r plates are used. These<br />
are anisotropic crystal plates <strong>of</strong> constant or variable retardation with known orientation <strong>of</strong> the<br />
X and Z wave vibration directions (α = n x and γ = n z ). The vibration direction <strong>of</strong> the Z wave<br />
(γ = n z ) is engraved in the metal casing <strong>of</strong> the compensa<strong>to</strong>rs. Commonly used compensa<strong>to</strong>rs<br />
(Fig. 4-42):<br />
The first-order red plate (lambda plate, λ plate, sensitive tint plate) consists <strong>of</strong> a quartz or<br />
gypsum plate that is cut parallel <strong>to</strong> the optic axis, about 62 µm thick, which shows a firs<strong>to</strong>rder<br />
red interference colour in diagonal position (Γ = 551 nm).<br />
The lambda/4 (lambda quarter) plate consists <strong>of</strong> a <strong>thin</strong> quartz or mica plate which shows a<br />
grey interference colour in diagonal position (Γ = 130-150 nm, depending on manufacturer).<br />
The quartz wedge consists <strong>of</strong> a wedge-shaped quartz plate with the long axis parallel <strong>to</strong> the<br />
optic axis. In diagonal position, this quartz wedge shows interference colours ranging across<br />
four orders (Γ = 0 <strong>to</strong> 2200 nm).<br />
Most commonly, the compensa<strong>to</strong>rs are inserted diagonally in<strong>to</strong> the microscope tube below the<br />
analyzer. The wave corresponding <strong>to</strong> n z (γ or Z’) vibrates in NE-SW direction, the wave<br />
corresponding <strong>to</strong> n x (α or X’) in NW-SE direction.<br />
Raith, Raase & Reinhardt – February 2012<br />
Figure 4-42. Compensa<strong>to</strong>rs– first-order red plate (λ plate), lambda/4 plate and quartz wedge<br />
104
Guide <strong>to</strong> Thin Section Microscopy<br />
Extinction<br />
In order <strong>to</strong> distinguish between the extinction directions X' and Z' (with corresponding<br />
refractive indices n x ' and n z '), the mineral grain is put exactly in an extinction position and<br />
then rotated anticlockwise by 45°in<strong>to</strong> a diagonal position (Fig. 4-43). Some modern microscopes<br />
have a device attached <strong>to</strong> the stage that can be activated in extinction position such<br />
that every 45°rotation is indicated by a mechanical click.<br />
In diagonal position, the mineral displays its characteristic interference colour in maximum<br />
brightness. In this position, the originally E-W vibrating wave is now vibrating NE-SW (in<br />
quadrants I and III); the originally N-S vibrating wave is now oriented NW-SE (in quadrants<br />
II and IV).<br />
Two different optical orientations <strong>of</strong> the mineral are possible in diagonal position (Fig. 4-43):<br />
I. The NE-SW vibrating wave is the slower wave; its refractive index is n z '. The NW-SE<br />
vibrating wave is the faster wave; its refractive index is n x '.<br />
II. The NE-SW vibrating wave is the faster wave; its refractive index is n x '. The NW-SE<br />
vibrating wave is the slower wave; its refractive index is n z '.<br />
By inserting the first-order red plate or the lambda/4 plate in<strong>to</strong> the light path, with the<br />
compensa<strong>to</strong>r direction Z’ (γ) in diagonal NE-SW orientation, the two different positions I and<br />
II can be distinguished as follows:<br />
I. Z' (mineral) || Z (compensa<strong>to</strong>r); X' (mineral) || X (compensa<strong>to</strong>r)<br />
The interference colours <strong>of</strong> the mineral shift <strong>to</strong> colours <strong>of</strong> a higher order: this is called<br />
addition.<br />
Minerals with low birefringence (quartz and feldspars, for example) and white <strong>to</strong> grey firs<strong>to</strong>rder<br />
interference colours show blue <strong>to</strong> greenish-yellow second-order colours as the firs<strong>to</strong>rder<br />
red plate is inserted, and first-order yellow if the lambda/4 plate is inserted (Fig. 4-43).<br />
Raith, Raase & Reinhardt – February 2012<br />
The colour shift <strong>to</strong> a higher order is not always easily identified in minerals with high<br />
birefringence and interference colours <strong>of</strong> the 3 rd or higher order, particularly for the novice. In<br />
such cases the quartz wedge may be used instead <strong>of</strong> the first-order red plate. By inserting the<br />
quartz wedge, the continuous change <strong>of</strong> the interference colours <strong>to</strong>wards paler hues can be<br />
observed whereby the colours eventually reach a high-order white if the minerals have<br />
sufficiently high birefringence (such as carbonates).<br />
For the assessment <strong>of</strong> high interference colours, the observations at wedging-out edges <strong>of</strong><br />
crystal plates are particularly useful. From the grain interior <strong>to</strong> the outer edge the crystal plate<br />
thickness decreases. The interference colours change correspondingly displaying a continuous<br />
sequence <strong>of</strong> decreasing orders down <strong>to</strong> first-order black. If the quartz wedge is inserted, the<br />
colour bands shift <strong>to</strong>wards the grain edge, which is particularly well recognised in the reds <strong>of</strong><br />
first and second order (Fig. 4-44). The outer edge <strong>of</strong> the grain eventually shows a fourth-order<br />
red, the grain interior shows higher interference colours.<br />
105
Guide <strong>to</strong> Thin Section Microscopy<br />
Extinction<br />
Interpretation:<br />
In an anisotropic mineral, the n x ' wave advances faster in the crystal plate than the n z ' wave.<br />
Both waves have different wavelengths. After leaving the mineral, both waves have the same<br />
velocity and wavelength, but with an accumulated retardation <strong>of</strong> Γ Min = d * (n z ' – n x ').<br />
With this retardation, the waves enter the crystal plate <strong>of</strong> the compensa<strong>to</strong>r, whereby the<br />
mineral's n x ' wave is again the faster wave n xComp , the original n z ' wave transforms <strong>to</strong> the<br />
slower wave n zComp . Therefore, the retardation accumulated in the mineral is now further<br />
increased by the retardation <strong>of</strong> the compensa<strong>to</strong>r. There is an increase <strong>of</strong> interference colours:<br />
Γ Min + Γ Comp = Γ <strong>to</strong>tal<br />
When inserting the first-order red plate or the quartz wedge with the mineral in this position it<br />
should be noted that the colours are always increasing <strong>to</strong>wards a higher order.<br />
Figure 4-43. Addition and subtraction in the two diagonal positions <strong>of</strong> a quartz grain cut<br />
oblique <strong>to</strong> its c axis. The E-wave vibrates parallel <strong>to</strong> c, whereby n e ' = n z '; the O-wave vibrates<br />
orthogonal <strong>to</strong> c, with n o = n x .<br />
Raith, Raase & Reinhardt – February 2012<br />
II. Z' (mineral) || X (compensa<strong>to</strong>r); X' (mineral) || Z (compensa<strong>to</strong>r)<br />
The interference colours <strong>of</strong> the mineral <strong>section</strong> shift <strong>to</strong> colours <strong>of</strong> a lower order: this is<br />
referred <strong>to</strong> as subtraction.<br />
Minerals with low birefringence (quartz and feldspars, for example) and white <strong>to</strong> grey firs<strong>to</strong>rder<br />
interference colours show orange <strong>to</strong> grey first-order colours as the first-order red plate is<br />
inserted, and first-order dark grey if the lambda/4 plate is inserted (Fig. 4-43).<br />
106
Guide <strong>to</strong> Thin Section Microscopy<br />
Extinction<br />
The colour shift <strong>to</strong> a lower order is not always easily identified in minerals with high<br />
birefringence and interference colours <strong>of</strong> the 3 rd or higher order, particularly for the novice. In<br />
such cases, the quartz wedge may be used instead <strong>of</strong> the first-order red plate. By inserting the<br />
quartz wedge, the continuous change <strong>of</strong> the interference colours <strong>to</strong>wards more saturated hues<br />
can be observed while the colours shift <strong>to</strong> lower orders. In minerals with low birefringence<br />
first-order black is reached initially. With further insertion <strong>of</strong> the quartz wedge, the colour<br />
sequence reverts <strong>to</strong> increasing interference colours (e.g., olivine and white mica). At <strong>thin</strong>ningout<br />
crystal plate edges, the colour bands move <strong>to</strong>wards the grain interior as the quartz wedge<br />
is inserted (Fig. 4-44). This effect is particularly evident from the red <strong>to</strong>nes <strong>of</strong> the first, second<br />
and third order. The dark grey colour band <strong>of</strong> the first order at the outermost edge <strong>of</strong> the<br />
mineral migrates in<strong>to</strong> the grain interior and is replaced by colours <strong>of</strong> the first <strong>to</strong> third order, if<br />
the interference colours <strong>of</strong> the mineral lie in the first <strong>to</strong> second order (e.g., olivine, white<br />
mica, pyroxenes).<br />
Interpretation:<br />
In an anisotropic mineral, the n x ' wave advances faster in the crystal plate than the n z ' wave.<br />
Both waves have different wavelengths. After exciting the mineral, both waves have the same<br />
velocity and wavelength, but with an accumulated retardation <strong>of</strong> Γ Min = d * (n z ' – n x ').<br />
With this retardation, the waves enter the crystal plate in the compensa<strong>to</strong>r in which the fast<br />
and slow wave directions are at 90˚ <strong>to</strong> those <strong>of</strong> the mineral. The mineral's n x ' wave now<br />
becomes the slower wave n zComp , the original n z ' wave transforms <strong>to</strong> the faster wave n xComp .<br />
Therefore, the retardation accumulated in the mineral is now reduced by the retardation <strong>of</strong> the<br />
compensa<strong>to</strong>r. There is a decrease <strong>of</strong> interference colours:<br />
Γ Min – Γ Comp = Γ <strong>to</strong>tal .<br />
When inserting the first-order red plate or the quartz wedge, the following is <strong>to</strong> be noted:<br />
1. If the retardation <strong>of</strong> the mineral is larger than that <strong>of</strong> the compensa<strong>to</strong>r, only decreasing<br />
colours <strong>of</strong> a lower order are observed.<br />
2. If the retardation <strong>of</strong> the mineral is the same as that <strong>of</strong> the compensa<strong>to</strong>r, the mineral appears<br />
in first-order black (Γ <strong>to</strong>tal = 0). The retardation <strong>of</strong> the mineral is fully compensated.<br />
Raith, Raase & Reinhardt – February 2012<br />
3. If the retardation <strong>of</strong> the mineral is smaller than that <strong>of</strong> the compensa<strong>to</strong>r, the interference<br />
colour are reduced <strong>to</strong> a value corresponding <strong>to</strong> the difference Γ Comp – Γ Min . When inserting the<br />
quartz wedge, decreasing colours will be observed initially, down <strong>to</strong> first-order black, after<br />
which colours will increase again.<br />
107
Guide <strong>to</strong> Thin Section Microscopy<br />
Extinction<br />
Figure 4-44. Anhydrite grain showing a colour sequence covering seven orders.<br />
Raith, Raase & Reinhardt – February 2012<br />
Addition and subtraction can be easily recognised by observing the changes in the colour sequence<br />
along the wedge-shaped edge <strong>of</strong> the grain. Compensation with first-order red shifts the colour<br />
sequence in<strong>to</strong> the grain interior by one order (subtraction), or <strong>to</strong>wards the grain edge by one order<br />
(addition). When using the quartz wedge for compensation, the colour sequence moves either in<strong>to</strong> the<br />
grain interior by four orders (subtraction) or out <strong>of</strong> the grain (addition).<br />
The interference colours <strong>of</strong> minerals that are strongly coloured in plane-polarized light may<br />
be masked significantly such that addition and subtraction positions with inserted frist-order<br />
red plate are not easily distinguished by a novice. In such cases, it is recommended <strong>to</strong> use the<br />
quartz wedge and <strong>to</strong> observe the movement <strong>of</strong> colour bands at the wedging-out edges <strong>of</strong> the<br />
mineral grains.<br />
108
Guide <strong>to</strong> Thin Section Microscopy<br />
Extinction<br />
Sign <strong>of</strong> elongation l<br />
Crystals with columnar <strong>to</strong> acicular or platy <strong>to</strong> flaky habits show elongate <strong>section</strong>s if cut<br />
parallel <strong>to</strong> their long morphological axis or perpendicular <strong>to</strong> a dominantly developed basal<br />
plane. If such elongate <strong>section</strong>s are rotated in<strong>to</strong> a diagonal position (i.e., long axis l parallel <strong>to</strong><br />
NE-SW) they show under crossed polarizers and compensa<strong>to</strong>r-in (first-order red plate or λ/4<br />
plate) either addition (Γ Comp + Γ Min = Γ <strong>to</strong>tal ) or subtraction (Γ Comp - Γ Min = Γ <strong>to</strong>tal ), depending on<br />
their optic sign (Fig. 4-45).<br />
Addition is observed if the wave with the larger refractive index (n z ') vibrates parallel or at a<br />
small angle <strong>to</strong> the long dimension <strong>of</strong> the crystal <strong>section</strong>: l (+) = positive sign <strong>of</strong> elongation or<br />
"length-slow". Examples: acicular-columnar crystals– sillimanite, gedrite, anthophyllite; platy<br />
crystals– gehlenite, micas, antigorite, pennine.<br />
Subtraction is observed if the wave with the smaller refractive index (n x ') vibrates parallel or<br />
at a small angle <strong>to</strong> the long dimension <strong>of</strong> the crystal <strong>section</strong>: l (–) = negative sign <strong>of</strong><br />
elongation or "length-fast". Examples: acicular-columnar crystals– <strong>to</strong>urmaline, apatite; platy<br />
crystals– åkermanite, brucite, clinochlore.<br />
For optically uniaxial mineral species with acicular-columnar habit, the sign <strong>of</strong> elongation<br />
corresponds <strong>to</strong> the optic sign. For platy uniaxial minerals, the two signs are opposite.<br />
Elongate <strong>section</strong>s in which n y is parallel (or at a small angle) <strong>to</strong> the morphological long axis<br />
<strong>of</strong> the crystal or perpendicular <strong>to</strong> the planar dimension <strong>of</strong> platy crystals show a variable sign<br />
<strong>of</strong> elongation, l(+) or l(–), depending on the exact orientation <strong>of</strong> the crystal in <strong>thin</strong> <strong>section</strong>.<br />
Examples <strong>of</strong> such elongate crystals– wollas<strong>to</strong>nite, epidote.<br />
Raith, Raase & Reinhardt – February 2012<br />
Figure 4-45 A. Platy muscovite showing positive sign <strong>of</strong> elongation. In muscovite and firs<strong>to</strong>rder<br />
red plate, fast (n x ) and slow (n y ↔n z ) waves vibrate in identical orientation. Therefore,<br />
the retardation adds up and increased interference colours result (Γ res = Γ Red1 + Γ Ms = 1231 nm;<br />
second-order blue-green).<br />
109
Guide <strong>to</strong> Thin Section Microscopy<br />
Extinction<br />
Figure 4-45 B. Prismatic apatite showing negative sign <strong>of</strong> elongation. In apatite, the fast<br />
wave vibrates parallel <strong>to</strong> the slow wave <strong>of</strong> the first-order red plate, and the slow wave in<br />
apatite parallel <strong>to</strong> the fast wave <strong>of</strong> the first-order red plate. Hence, retardation is reduced and<br />
subtraction results (Γ res = Γ Red1 + Γ Ap = 476 nm; first-order orange-yellow).<br />
If the extinction direction deviates significantly from the long axis <strong>of</strong> the crystal <strong>section</strong>, it is<br />
convention <strong>to</strong> use the extinction position that forms an angle smaller than 45˚ with the long<br />
axis, and <strong>to</strong> rotate it in<strong>to</strong> the diagonal position before the first-order red plate or lambda/4<br />
plate is inserted for determining the sign <strong>of</strong> elongation. However, if extinction angles are<br />
close <strong>to</strong> 40-50˚, the use <strong>of</strong> l(+) and l(-) becomes impractical.<br />
Determination <strong>of</strong> the optic sign <strong>of</strong> optically uniaxial minerals<br />
Optically uniaxial minerals that are elongate in c direction (e.g., quartz, apatite, <strong>to</strong>urmaline)<br />
and are present in <strong>thin</strong> <strong>section</strong> in a cut that is roughly parallel <strong>to</strong> that long axis, will have the<br />
E-wave (n e ) vibrating parallel <strong>to</strong> c and the O-wave (n o ) orthogonal <strong>to</strong> c. If the habit <strong>of</strong><br />
optically uniaxial minerals is platy (e.g., melilite), the same applies, but the O-wave now<br />
vibrates parallel <strong>to</strong> the elongate <strong>section</strong>.<br />
Raith, Raase & Reinhardt – February 2012<br />
For both crystal habits, the optic sign can be determined easily by compensation, that is,<br />
whether n e > n o (= optically uniaxial positive) or n e < n o (= optically uniaxial negative) (Fig.<br />
4-46). The long axis <strong>of</strong> the crystal <strong>section</strong> is rotated in<strong>to</strong> diagonal position (NE-SW<br />
orientation), and the first-order red plate or lambda/4 plate is inserted. For crystals elongate in<br />
c, n e is now parallel <strong>to</strong> n zComp and n o is parallel <strong>to</strong> n xComp . For platy minerals, the relation is<br />
reverse as c is perpendicular <strong>to</strong> the long dimension <strong>of</strong> the crystal <strong>section</strong>s. The retardation<br />
between the waves which are created in the optically uniaxial mineral (Γ Min ) and in the<br />
compensa<strong>to</strong>r plate will be increased through addition or decreased through subtraction,<br />
depending on optical sign. Correspondingly, the crystal <strong>section</strong> shows higher or lower<br />
interference colours if the compensa<strong>to</strong>r is inserted.<br />
110
Guide <strong>to</strong> Thin Section Microscopy<br />
Extinction<br />
Elongate <strong>section</strong> through an elongate-prismatic crystal: n e is aligned with the long axis <strong>of</strong> the<br />
<strong>section</strong>; n o is orthogonal <strong>to</strong> it. Addition occurs if n e > n o ; the mineral is optically uniaxialpositive.<br />
Subtraction occurs if n e < n o ; the mineral is optically uniaxial-negative.<br />
Pr<strong>of</strong>ile <strong>section</strong> through a platy mineral: n o lies parallel <strong>to</strong> the long axis <strong>of</strong> the elongate cross<strong>section</strong>;<br />
n e is orthogonal <strong>to</strong> it. Addition occurs if n e < n o ; the mineral is optically uniaxialnegative.<br />
Subtraction occurs if n e > n o ; the mineral is optically uniaxial-positive.<br />
Figure 4-46 A. Hexagonal apatite forms elongate crystals that show subtraction with the firs<strong>to</strong>rder<br />
red plate inserted, when placed in diagonal position. Hence, the optic sign is negative<br />
(n e < n o ).<br />
Raith, Raase & Reinhardt – February 2012<br />
Figure 4-46 B. Tetragonal melilite forms platy crystals that show either addition or<br />
subtraction with the first-order red plate inserted, depending on composition. In this example,<br />
the core domain is optically positive (high åkermanite content), whereas the rim is optically<br />
negative (high Na-melilite + gehlenite components).<br />
111
Guide <strong>to</strong> Thin Section Microscopy<br />
Conoscopy<br />
4.2.5 Conoscopic methods<br />
4.2.5.1 Some basic principles<br />
In "normal" orthoscopic view light enters the <strong>thin</strong> <strong>section</strong> orthogonally as a set <strong>of</strong> parallel,<br />
E-W vibrating light waves. The objective creates an enlarged, real, inverted image <strong>of</strong> the <strong>thin</strong><br />
<strong>section</strong>, which is then further enlarged and viewed through the ocular. The light rays entering<br />
the <strong>thin</strong> <strong>section</strong> travel through the mineral grains in defined crystallographic directions that<br />
depend on the respective orientation <strong>of</strong> the crystals. In order <strong>to</strong> record the optical behaviour<br />
<strong>of</strong> an anisotropic mineral species, crystal <strong>section</strong>s <strong>of</strong> different orientations must be studied, as<br />
outlined in previous chapters (e.g., crystal <strong>section</strong>s with maximum interference colour are<br />
needed <strong>to</strong> determine birefringence).<br />
Optic axial angle and optic sign cannot be determined directly in the orthoscopic mode <strong>of</strong><br />
operation, except in specific circumstances where the crystal symmetry is known <strong>to</strong> be high<br />
(hexagonal, trigonal, tetragonal) and where the crystal shape allows <strong>to</strong> identify the c-axis<br />
direction (cf. Ch. 4.2.4).<br />
As opposed <strong>to</strong> orthoscopy, the conoscopic view involves a convergent set <strong>of</strong> light rays, which<br />
means that a wide-angle cone <strong>of</strong> differently inclined light rays transmits the <strong>thin</strong> <strong>section</strong> (Fig.<br />
4-47). To achieve this, the illumination aperture is enlarged <strong>to</strong> a maximum by putting the<br />
auxiliary condenser lens in<strong>to</strong> the light path and opening the substage iris diaphragm.<br />
Raith, Raase & Reinhardt – February 2012<br />
Dependent on their propagation direction, the rays <strong>of</strong> this light cone will form an image in the<br />
focal plane above the objective, whereby the maximum opening angle <strong>of</strong> the cone <strong>of</strong> rays<br />
forming that image depends on the aperture <strong>of</strong> the objective used (Fig. 4-48). Since two<br />
orthogonally vibrating waves propagate generally in all directions wi<strong>thin</strong> optically anisotropic<br />
minerals, these wave couplets are brought in<strong>to</strong> interference in the analyzer, generating an<br />
interference figure. This interference figure can be viewed, either as an enlarged image by<br />
putting an auxiliary lens (Amici-Bertrand lens) in<strong>to</strong> the light path, or with the naked eye by<br />
removing an ocular and looking down the ocular tube. Light waves that travel in the direction<br />
<strong>of</strong> the microscope axis, and are thus oriented orthogonal <strong>to</strong> the <strong>thin</strong> <strong>section</strong> plane, form the<br />
centre <strong>of</strong> the interference figure. The larger the angle <strong>of</strong> the ray propagation direction <strong>to</strong> the<br />
microscope axis, the larger the distance <strong>of</strong> the image point from the centre <strong>of</strong> the interference<br />
figure. Thus, the conoscopic interference figure allows <strong>to</strong> study the propagation behaviour <strong>of</strong><br />
light in an anisotropic crystal quasi-simultaneously for a multitude <strong>of</strong> crystallographic<br />
directions wi<strong>thin</strong> that crystal.<br />
From the geometry <strong>of</strong> the interference figure and its modification through the use <strong>of</strong><br />
compensa<strong>to</strong>rs, the number <strong>of</strong> optic axes (uniaxial vs. biaxial), the optic axial angle (2V) and<br />
the optic sign (positive vs. negative) can be determined.<br />
112
Guide <strong>to</strong> Thin Section Microscopy<br />
Conoscopy<br />
Figure 4-47. Light paths in the polarized-light microscope<br />
Raith, Raase & Reinhardt – February 2012<br />
A: Orthoscopic illumination mode. In finite tube-length microscopes, the objective produces a real<br />
inverted image (intermediate image) <strong>of</strong> the specimen which then is viewed with further enlargement<br />
through the ocular (A-2). In infinity-corrected microscopes, the objective projects the image <strong>of</strong> the<br />
specimen <strong>to</strong> infinity, and a second lens placed in the tube (tube lens) forms the intermediate image<br />
which then is viewed through the ocular (A-1). This imaging design allows <strong>to</strong> insert accessory<br />
components such as analyzer, compensa<strong>to</strong>rs or beam splitters in<strong>to</strong> the light path <strong>of</strong> parallel rays<br />
between the objective and the tube lens with only minor effects on the image quality.<br />
B: Conoscopic illumination mode. Parallel rays <strong>of</strong> the light cone which illuminates the specimen<br />
create an image in the upper focal plane <strong>of</strong> the objective (B). In the case <strong>of</strong> anisotropic crystals, an<br />
interference image is generated which can be viewed as an enlargement by inserting an auxiliary lens<br />
(Amici-Bertrand lens). The interference image can also be directly observed in the tube through a<br />
pinhole which replaces the ocular.<br />
113
Guide <strong>to</strong> Thin Section Microscopy<br />
Conoscopy<br />
4.2.5.2 Conoscopy <strong>of</strong> optically anisotropic crystals<br />
In the conoscopic mode, waves deviating from vertical incidence by increasing tilt angles<br />
travel increasing distances wi<strong>thin</strong> the birefringent crystal. According <strong>to</strong> the relationship Γ = d<br />
* (n z ' – n x ') described in chapter 4.2.3, it has <strong>to</strong> be concluded that the retardation Γ <strong>of</strong> the<br />
waves increases with increasing angles due <strong>to</strong> the continuous increase <strong>of</strong> d' (= length <strong>of</strong> the<br />
light path in the crystal plate). Accordingly, the interference colours in a conoscopic<br />
interference figure should generally increase outwards. However, the interference figure is <strong>to</strong><br />
a much larger extent controlled by the orientation <strong>of</strong> the vibration directions and the<br />
birefringence values <strong>of</strong> the wave couplets wi<strong>thin</strong> the observed volume <strong>of</strong> the anisotropic<br />
crystal. As described previously, the birefringence for waves parallel <strong>to</strong> optic axes is zero.<br />
It increases as the angle between the optic axis and ray propagation direction (or wave<br />
normal, <strong>to</strong> be precise) increases.<br />
Raith, Raase & Reinhardt – February 2012<br />
Figure 4-48: Generation <strong>of</strong> an interference figure in the upper focal plane <strong>of</strong> the objective by<br />
imaging <strong>of</strong> parallel sets <strong>of</strong> rays that pass the crystal plate at different angles. The example<br />
shows these relationships for a uniaxial crystal (calcite) cut perpendicular <strong>to</strong> the optic axis.<br />
The geometry <strong>of</strong> interference figures obtained from anisotropic crystals can be illustrated<br />
with the model <strong>of</strong> the skiodrome sphere developed by Becke (1905). The crystal is considered<br />
<strong>to</strong> occupy the centre <strong>of</strong> a sphere. Each ray propagation direction <strong>of</strong> light waves wi<strong>thin</strong> the<br />
crystal has a corresponding point on the spherical surface where the ray pierces that surface.<br />
In each <strong>of</strong> these points, the vibration directions <strong>of</strong> the related waves can be shown as a<br />
tangent (e.g., O and E in case <strong>of</strong> optically uniaxial minerals). When connecting all the<br />
tangents <strong>of</strong> equal vibration direction, a geometric mesh <strong>of</strong> vibration directions is generated<br />
that depends on the optical symmetry <strong>of</strong> the crystal (Fig. 4-49,50).<br />
114
Guide <strong>to</strong> Thin Section Microscopy<br />
Conoscopy<br />
Skiodrome sphere<br />
For the optically uniaxial mineral species, a net <strong>of</strong> longitudinal and latitudinal circles, which<br />
has rotational symmetry, forms the surface <strong>of</strong> the sphere (Fig. 4-49). The meridians (longitudes)<br />
represent the vibration directions <strong>of</strong> the E-waves and the circles <strong>of</strong> latitude the O-<br />
waves. The optic axis A is the rotation axis <strong>of</strong> the net.<br />
For the optically biaxial mineral species, the spherical surface consists <strong>of</strong> an arrangement <strong>of</strong><br />
two sets <strong>of</strong> cross-cutting ellipses with orthorhombic symmetry (Fig. 4-50). The optic axes A 1<br />
and A 2 emerge at the common foci <strong>of</strong> the ellipses. The symmetry planes <strong>of</strong> the net correspond<br />
<strong>to</strong> the principal <strong>section</strong>s ZX, ZY and YX.<br />
Skiodrome net (projected)<br />
For practical reasons, the part <strong>of</strong> the surface <strong>of</strong> the skiodrome sphere that is captured in the<br />
conoscopic cone <strong>of</strong> light rays as it emerges from a crystal <strong>section</strong>s is projected on<strong>to</strong> the <strong>thin</strong><br />
<strong>section</strong> plane (Fig. 4-49,50). The skiodrome nets and the corresponding interference figures<br />
for diagnostically important orientations <strong>of</strong> optically uniaxial and biaxial minerals are<br />
presented in Figs. 4-51 <strong>to</strong> 4-54.<br />
Interference figure<br />
In the interference figure, those domains are in extinction in which the vibration directions <strong>of</strong><br />
the waves are parallel <strong>to</strong> the polarizer and analyzer directions. [Analogy <strong>to</strong> the orthoscopic<br />
extinction position: light entering the crystal in such directions will vibrate exclusively E-W<br />
and hence will be blocked by the analyzer; N-S vibrating waves are not generated!]. The<br />
domains <strong>of</strong> extinction are called "isogyres". Their geometry is dependent on the optical<br />
symmetry and the orientation <strong>of</strong> the crystal, and it may change as the microscope stage is<br />
turned (Figs. 4-51 <strong>to</strong> 4-54).<br />
Raith, Raase & Reinhardt – February 2012<br />
The domains in which the vibration directions <strong>of</strong> the waves deviate from the polarizer and<br />
analyzer directions appear in different brightness and different interference colours. [Analogy<br />
<strong>to</strong> the orthoscopic diagonal position: the light entering the birefringent crystal plate in such<br />
directions is split in<strong>to</strong> two sets <strong>of</strong> orthogonally vibrating waves, which interfere afterwards in<br />
the analyzer]. Curved lines <strong>of</strong> equal colour (or equal retardation Γ) are called "isochromes".<br />
Their geometry depends on the optical symmetry and the orientation <strong>of</strong> the crystal (Fig. 4-<br />
51,53). The range <strong>of</strong> the colour spectrum, i.e. the number <strong>of</strong> isochromes, is determined by the<br />
birefringence values, the thickness <strong>of</strong> the crystal plate [Γ = d * (n z ' – n x ')] and the aperture <strong>of</strong><br />
the objective (Figs. 4-52 <strong>to</strong> 4-54).<br />
115
Guide <strong>to</strong> Thin Section Microscopy<br />
Conoscopy<br />
Raith, Raase & Reinhardt – February 2012<br />
Figure 4-49. Skiodrome sphere and projections for optically uniaxial crystals.<br />
On the skiodrome sphere the vibration directions <strong>of</strong> the orthogonally vibrating O- and E-waves are<br />
fixed for all ray propagation directions. The O-waves (red) vibrate always latitudinally, the E-waves<br />
(blue) vibrate longitudinally. Projections <strong>of</strong> the 3-D skiodrome net on<strong>to</strong> the plane <strong>of</strong> view are most<br />
useful for the interpretation <strong>of</strong> interference figures which result from different orientations <strong>of</strong> the<br />
uniaxial crystal. The figure shows such projections for crystal <strong>section</strong>s orthogonal <strong>to</strong>, oblique <strong>to</strong>, and<br />
parallel <strong>to</strong> the optic axis (resp. c-axis) <strong>of</strong> the crystal.<br />
116
Guide <strong>to</strong> Thin Section Microscopy<br />
Conoscopy<br />
Raith, Raase & Reinhardt – February 2012<br />
Figure 4-50. Skiodrome sphere and projections for optically biaxial crystals.<br />
On the skiodrome sphere, the vibration directions <strong>of</strong> the orthogonally vibrating waves are fixed for all<br />
ray propagation directions. The net shows two sets <strong>of</strong> cross-cutting ellipses. The two optic axes A 1,2<br />
emerge at the common foci <strong>of</strong> the ellipses. Vibration directions with the principal refractive indices n z ,<br />
n y and n x lie wi<strong>thin</strong> the XY, ZX and ZY principal <strong>section</strong>s and are shown here in blue, red and green,<br />
respectively. For the investigation <strong>of</strong> optic sign and optic axial angle 2V, interference figures <strong>of</strong> crystal<br />
<strong>section</strong>s orthogonal <strong>to</strong> the acute bisectrix (Z or X, for 2V45˚) are most useful.<br />
117
Guide <strong>to</strong> Thin Section Microscopy<br />
Conoscopy<br />
4.2.5.3 Optically uniaxial minerals<br />
For the optically uniaxial mineral species a net <strong>of</strong> meridional and latitudinal circles, which<br />
has rotational symmetry, forms the spherical surface <strong>of</strong> the skiodrome (Fig. 4-49). The<br />
meridians represent the vibration directions <strong>of</strong> the E-waves and the circles <strong>of</strong> latitude the O-<br />
waves. The optic axis A is the rotation axis <strong>of</strong> the net.<br />
Crystal <strong>section</strong>s perpendicular <strong>to</strong> the optic axis A are recognised in orthoscopic view by<br />
their isotropic behaviour. In conoscopic view, these <strong>section</strong>s show a characteristic interference<br />
figure which is a black cross. The isogyres become broader <strong>to</strong>wards the margin <strong>of</strong> the<br />
field <strong>of</strong> view, and the four sec<strong>to</strong>rs are filled by concentric coloured circles. The optic axis<br />
forms the centre (mela<strong>to</strong>pe) <strong>of</strong> the cross (Figs. 4-49,51,52). If the microscope stage is turned,<br />
the interference figure does not change.<br />
Interpretation <strong>of</strong> the interference figure<br />
The vibration directions <strong>of</strong> the O- and E-waves are orthogonal <strong>to</strong> each other and are arranged<br />
concentrically around the optic axis. In the N-S and E-W directions <strong>of</strong> the interference figure,<br />
the vibration directions coincide with the polarizer and analyzer directions. In these directions<br />
only E-W vibrating waves pass the crystal plate (O-waves along the N-S isogyre; E-waves<br />
along the E-W isogyre), but these will be blocked by the analyzer. Due <strong>to</strong> the rotational<br />
symmetry <strong>of</strong> the indicatrix (and the skiodrome net) and the particular orientation <strong>of</strong> the<br />
crystal plate (viewing direction parallel <strong>to</strong> the optic axis), the interference figure does not<br />
move or change if the stage is rotated.<br />
Raith, Raase & Reinhardt – February 2012<br />
The increase <strong>of</strong> the interference colours <strong>to</strong>wards the edge <strong>of</strong> the field <strong>of</strong> view is caused by the<br />
increase <strong>of</strong> the retardation Γ <strong>of</strong> the O-waves and E-waves from the centre [∆n = 0 in the<br />
direction <strong>of</strong> the optic axis] <strong>to</strong> the periphery, whereby the potential range <strong>of</strong> visible colours is<br />
limited by the mineral-specific maximum birefringence perpendicular <strong>to</strong> the optic axis. [∆n =<br />
|n e – n o |]. The circular arrangement <strong>of</strong> isochromes is a result <strong>of</strong> the rotational symmetry <strong>of</strong> the<br />
indicatrix and the specific crystal orientation perpendicular <strong>to</strong> the optic axis. The range <strong>of</strong> the<br />
colour spectrum (i.e, the number <strong>of</strong> isochromes) depends on birefringence and crystal plate<br />
thickness [Γ = d * (n e ' – n o )] as well as on the numerical aperture <strong>of</strong> the objective. For<br />
example, in a <strong>thin</strong> <strong>section</strong> <strong>of</strong> 25μm thickness, the interference figure <strong>of</strong> highly birefringent<br />
calcite (∆n = 0.172) comprises about six orders <strong>of</strong> interference colour, while quartz (∆n =<br />
0.009) shows first-order colours only (Fig. 4-52).<br />
In crystal <strong>section</strong>s oblique <strong>to</strong> the optic axis A, the isogyre cross shifts <strong>to</strong>wards the periphery<br />
<strong>of</strong> the field <strong>of</strong> view and moves in a circular fashion if the microscope stage is rotated. The<br />
distance <strong>of</strong> the mela<strong>to</strong>pe <strong>to</strong> the centre <strong>of</strong> the field <strong>of</strong> view reflects the tilt angle between the<br />
optic axis and the microscope axis. The E-W and N-S portions <strong>of</strong> the isogyre cross move<br />
through the field <strong>of</strong> view without rotation (Fig. 4-51 B,C).<br />
Crystal <strong>section</strong>s parallel <strong>to</strong> the optic axis show maximum birefringence in orthoscopic view.<br />
The conoscopic interference figure shows a broad black cross which, at minimal rotation <strong>of</strong><br />
the stage, quickly opens up ("flash figure“, Fig. 4-51D). Due <strong>to</strong> their similarity with<br />
interference figures <strong>of</strong> optically biaxial minerals, interference figures <strong>of</strong> such orientations<br />
have no practical significance.<br />
118
Guide <strong>to</strong> Thin Section Microscopy<br />
Conoscopy<br />
Raith, Raase & Reinhardt – February 2012<br />
Figure 4-51. Interference figures <strong>of</strong> optically uniaxial minerals<br />
Upper <strong>section</strong>: Skiodrome presentations and isogyres for differently oriented crystal <strong>section</strong>s <strong>of</strong> a<br />
uniaxial crystal. The vibration directions are shown in red (O-wave) and blue (E-wave).<br />
Lower <strong>section</strong>: Shift <strong>of</strong> isogyres and isochromes for crystal orientations B, C and D during a 90˚<br />
rotation <strong>of</strong> the microscope stage.<br />
119
Guide <strong>to</strong> Thin Section Microscopy<br />
Conoscopy<br />
Determining the optic sign <strong>of</strong> uniaxial minerals<br />
For the determination <strong>of</strong> optic sign, crystal <strong>section</strong>s are required that are either isotropic or<br />
show very low interference colours in orthoscopic view. The conoscopic interference figure<br />
will then show a more or less centred, dark isogyre cross.<br />
If the first-order red plate is inserted, the cross will appear in 1 st -order red, while the four<br />
quadrants display two different sequences <strong>of</strong> interference colours, depending on the vibration<br />
direction <strong>of</strong> the E- and O-waves. Two cases have <strong>to</strong> be distinguished:<br />
Case A: In quadrants I and III the interference colours increase by one order (= addition),<br />
while in quadrants II and IV the interference colours decrease by one order (= subtraction).<br />
Thus, n e ' > n o , and hence the optic sign <strong>of</strong> the minerals is positive (Fig. 4-52; example<br />
quartz).<br />
Case B: In quadrants I and III the interference colours decrease by one order (= subtraction),<br />
while in quadrants II and IV the interference colours increase by one order (= addition).<br />
Thus, n e ' < n o , and hence the optic sign <strong>of</strong> the minerals is negative (Fig. 4-52; example<br />
calcite).<br />
The interference figure in high-birefringent minerals shows multiple isochromes. In order <strong>to</strong><br />
distinguish clearly between cases A and B, it is suggested <strong>to</strong> use the quartz wedge instead <strong>of</strong><br />
the first-order red plate. When inserting the quartz wedge, the isochromes in the four<br />
quadrants shift in a characteristic way (Fig. 4-52,55).<br />
Raith, Raase & Reinhardt – February 2012<br />
Figure 4-52. Determination <strong>of</strong> the optic sign <strong>of</strong> a uniaxial crystal.<br />
The distinction between positive and negative optic sign is made in <strong>section</strong>s perpendicular <strong>to</strong> the optic<br />
axis by observing the addition and subtraction phenomena caused by insertion <strong>of</strong> the first-order red<br />
plate.<br />
120
Guide <strong>to</strong> Thin Section Microscopy<br />
Conoscopy<br />
4.2.5.4 Optically biaxial minerals<br />
The skiodrome sphere <strong>of</strong> optically biaxial mineral species shows an arrangement <strong>of</strong><br />
overlapping ellipses that possesses an orthorhombic symmetry (Fig. 4-50). The optic axes A 1<br />
and A 2 emerge at the common foci <strong>of</strong> the ellipses. They enclose the axial angle 2V which can<br />
attain mineral-specific values between 0˚ and 90˚. The bisec<strong>to</strong>r (acute bisectrix) <strong>of</strong> 2V is<br />
either Z (2V z < 90˚ = optically positive) or X (2V x < 90˚ = optically negative). The symmetry<br />
plane <strong>of</strong> the net corresponds <strong>to</strong> the principal <strong>section</strong>s ZX (= optic axial plane), ZY and YX <strong>of</strong><br />
the indicatrix.<br />
Crystal <strong>section</strong>s orthogonal <strong>to</strong> the acute bisectrix (at small 2V) or orthogonal <strong>to</strong> one <strong>of</strong><br />
the optic axes provide the diagnostically least ambiguous interference figures. As opposed <strong>to</strong><br />
the interference figure <strong>of</strong> optically uniaxial crystals, the isogyres change their shape as the<br />
stage is rotated (Fig. 4-53 A,B).<br />
Interference figures <strong>of</strong> crystal <strong>section</strong>s oriented orthogonal <strong>to</strong> the acute bisectrix (2V <<br />
60˚).<br />
In extinction positions (orthoscopic view), the axial plane is oriented either N-S or E-W. In<br />
this position, the conoscopic image shows a black cross, with one isogyre being wider than<br />
the other. The <strong>thin</strong>ner one represents the optic axial plane and appears tighter at the emerging<br />
points <strong>of</strong> the optic axes (mela<strong>to</strong>pes). When examining highly birefringent minerals, multiple<br />
isochromes can seen <strong>to</strong> surround the two mela<strong>to</strong>pes (Fig. 4-53 A).<br />
When turning the stage 45˚ in<strong>to</strong> the diagonal position, the isogyre cross opens <strong>to</strong> form two<br />
hyperbolas which, depending on the sense <strong>of</strong> rotation, come <strong>to</strong> lie in quadrants I and III or in<br />
II and IV. The optic axes emerge in the inflection points <strong>of</strong> the hyperbolas. By rotating the<br />
stage 360˚, the isogyres separate and converge, corresponding <strong>to</strong> the change between brightimage<br />
and extinction position in the orthoscopic mode <strong>of</strong> view (Fig. 4-53). With an increase<br />
in optic axial angle, the distance between the two hyperbola-shaped isogyres increases, while<br />
their curvature decreases (Fig. 4-53, bot<strong>to</strong>m right).<br />
Raith, Raase & Reinhardt – February 2012<br />
Interference figures <strong>of</strong> crystal <strong>section</strong>s oriented orthogonal <strong>to</strong> an optic axis (2V > 60˚).<br />
The determination <strong>of</strong> the optic sign <strong>of</strong> minerals with a large optic axial angle requires crystal<br />
<strong>section</strong>s orthogonal <strong>to</strong> one <strong>of</strong> the two optic axes, or <strong>section</strong>s in which the viewing direction<br />
does not deviate significantly from the optic axis orientation. Such crystal <strong>section</strong>s appear in<br />
orthoscopic mode either isotropic or show low interference colours. The interference figure<br />
shows a more or less curving isogyre, with the optic axis emerging from the inflection point.<br />
As the stage is rotated, the isogyre rotates through the field <strong>of</strong> view (Fig.4-53 C). [Conversely,<br />
the isogyres <strong>of</strong> optically uniaxial minerals move parallel <strong>to</strong> the polarizer-analyzer directions<br />
(E-W and N-S), Fig. 4-51]. The blue and also red fringes <strong>of</strong> the isogyres, as seen in Figs. 4-54<br />
and 4-56 (mica), are caused by dispersion <strong>of</strong> the optic axes, which means that the position <strong>of</strong><br />
the optic axes varies with the wavelength <strong>of</strong> light. Such colour fringes must not be confused<br />
with isochromes.<br />
121
Guide <strong>to</strong> Thin Section Microscopy<br />
Conoscopy<br />
Raith, Raase & Reinhardt – February 2012<br />
Figure 4-53. Interference figures <strong>of</strong> optically biaxial minerals.<br />
Top: Modification <strong>of</strong> the interference figure <strong>of</strong> a crystal <strong>section</strong> orthogonal<br />
<strong>to</strong> the acute bisectrix during rotation <strong>of</strong> the microscope stage. Normal<br />
positions at 0˚ and 90˚; diagonal positions at 45˚ and 135˚.<br />
Middle: Variation in interference figures <strong>of</strong> optically biaxial crystals<br />
depending on orientation, 2V and rotation position <strong>of</strong> the microscope stage.<br />
Shown are sequences corresponding <strong>to</strong> a rotation <strong>of</strong> 0 <strong>to</strong> 90˚. Bxa– acute<br />
bisectrix, Bxo– obtuse bisectrix.<br />
Bot<strong>to</strong>m: Relation between 2V and isogyre curvature for crystal <strong>section</strong>s<br />
perpendicular <strong>to</strong> an optic axis.<br />
122
Guide <strong>to</strong> Thin Section Microscopy<br />
Conoscopy<br />
Determining the optic sign <strong>of</strong> biaxial minerals<br />
For the determination <strong>of</strong> the optic sign, crystal <strong>section</strong>s with lowest-possible interference<br />
colours should be selected. For minerals with low 2V, acute bisectrix figures are also suitable<br />
(Fig. 4-54). Appropriate grains will show low, but not zero birefringence in orthoscopic<br />
mode. In general, it is sufficient <strong>to</strong> see one optic axis (mela<strong>to</strong>pe) wi<strong>thin</strong> the field <strong>of</strong> view.<br />
Ideally, the point <strong>of</strong> maximum curvature (mela<strong>to</strong>pe) <strong>of</strong> the isogyre should lie in the centre <strong>of</strong><br />
the field <strong>of</strong> view, such that the direction <strong>of</strong> curvature can be seen clearly. The convex side <strong>of</strong><br />
the hyperbola points <strong>to</strong> the acute bisectrix, the concave side <strong>to</strong> the obtuse bisectrix.<br />
For the observation <strong>of</strong> the change <strong>of</strong> interference colour when a compensa<strong>to</strong>r is inserted, the<br />
isogyres should be positioned such that the optic axial plane is in diagonal, NE-SW<br />
orientation. In this orientation, the concave sides <strong>of</strong> the isogyres point NE and SW, or either<br />
direction, if only a single isogyre is in the field <strong>of</strong> view. After inserting the first-order red<br />
plate, the isogyres appear in 1 st -order red, while the interference colours in between the<br />
isogyres change in accordance with the optic sign <strong>of</strong> the mineral (Fig. 4-54):<br />
Case A: On the convex sides <strong>of</strong> the isogyres subtraction occurs (1 st -order orange-yellow<br />
close <strong>to</strong> the mela<strong>to</strong>pe), while the concave domains show addition (2 nd -order blue close <strong>to</strong> the<br />
mela<strong>to</strong>pe). The acute bisectrix is Z; the optic sign <strong>of</strong> the minerals is therefore positive (Fig.<br />
4-54; example aragonite).<br />
Case B: On the convex sides <strong>of</strong> the isogyres addition occurs (2 nd -order blue), while the<br />
concave domains show subtraction (1 st -order orange-yellow). The acute bisectrix is X; the<br />
optic sign <strong>of</strong> the minerals is therefore negative (Fig. 4-54; example muscovite).<br />
Raith, Raase & Reinhardt – February 2012<br />
Figure 4-54. Determination <strong>of</strong> the optic sign <strong>of</strong> a biaxial crystal.<br />
The optic sign can be determined in <strong>section</strong>s perpendicular <strong>to</strong> the acute bisectrix or perpendicular <strong>to</strong><br />
one <strong>of</strong> the two optic axes. The distinction between positive and negative optic sign is made by<br />
observing the addition and subtraction phenomena resulting from insertion <strong>of</strong> the first-order red plate.<br />
The isogyres <strong>of</strong> the mica show distinct blue fringes <strong>of</strong> their concave side due <strong>to</strong> dispersion <strong>of</strong> the optic<br />
axes.<br />
123
Guide <strong>to</strong> Thin Section Microscopy<br />
Conoscopy<br />
When studying high-birefringent minerals, it is suggested that the quartz wedge is used<br />
instead <strong>of</strong> the first-order red plate. When inserting the quartz wedge, the isochromes in the<br />
four quadrants migrate in a characteristic way (Fig. 4-55).<br />
Raith, Raase & Reinhardt – February 2012<br />
Figure 4-55. Determination <strong>of</strong> the optic sign <strong>of</strong> anisotropic minerals<br />
124
Guide <strong>to</strong> Thin Section Microscopy<br />
Conoscopy<br />
4.2.5.5 Practical hints for conoscopic observation<br />
Mineral grains that are <strong>to</strong> be investigated conoscopically should meet specific requirements:<br />
a. When using a strongly magnifying objective (M O = 40x, 50x, 63x or oil immersion 100x)<br />
with a large numerical aperture (>0.6), the mineral grain should cover the field <strong>of</strong> view<br />
completely.<br />
b. The mineral grain must not be twinned wi<strong>thin</strong> the observed frame, nor must it show<br />
alteration effects or exsolution phases.<br />
c. The mineral grain should have a suitable orientation.<br />
The procedure <strong>of</strong> obtaining the conoscopic interference figure is carried out as follows:<br />
a. Move the mineral grain in<strong>to</strong> the centre <strong>of</strong> the crosshairs, use a high-magnification objective<br />
(40x minimum) and focus.<br />
b. Open all diaphragms below the stage.<br />
c. Move the condenser in<strong>to</strong> the uppermost position and put the auxiliary condenser in<strong>to</strong> the<br />
light path.<br />
d. Put the analyzer in. Take out the ocular; use a pinhole if included with the microscope,<br />
observe the image in the ocular tube or use the Amici-Bertrand lens and observe the enlarged<br />
image through the ocular. In some microscopes, the Amici-Bertrand lens can be centred and<br />
focused separately, which is important for quantitative work.<br />
e. If the mineral grain is <strong>to</strong>o small <strong>to</strong> fully occupy the field <strong>of</strong> view, an upper diaphragm that<br />
is included in some microscopes can be used <strong>to</strong> reduce or eliminate the periphery around the<br />
grain. If there is no Amici-Bertrand lens with upper diaphragm, a sharp conoscopic interference<br />
figure may be obtained using a simple pinhole in place <strong>of</strong> the ocular.<br />
Raith, Raase & Reinhardt – February 2012<br />
Minerals that are strongly coloured may cause problems for the determination <strong>of</strong> their optic<br />
sign if the first-order red plate is used. Therefore, the quartz wedge is recommended for<br />
compensation, which allows observing the direction <strong>of</strong> movement <strong>of</strong> the isochromes.<br />
125
Guide <strong>to</strong> Thin Section Microscopy<br />
Conoscopy<br />
Raith, Raase & Reinhardt – February 2012<br />
Figure 4-56. Conoscopic interference figures <strong>of</strong> selected minerals, viewed in grain <strong>section</strong>s<br />
perpendicular <strong>to</strong> the optic axis or the acute bisectrix. Left-hand side: Interference figure<br />
without compensa<strong>to</strong>r; right-hand side: first-order red plate inserted.<br />
126
Guide <strong>to</strong> Thin Section Microscopy<br />
Scheme for mineral identification<br />
5. Routine mineral determination<br />
Mineral colour<br />
Observations in plane-polarized light mode<br />
Colour <strong>to</strong>ne and intensity,<br />
Colour distribution<br />
Pleochroism<br />
Ch. 4.2.1<br />
Light refraction<br />
Relief, chagrin,<br />
Becke-Line:<br />
Refractive index n<br />
Ch. 4.2.2<br />
Pleochroism, changing relief/chagrin = anisotropic<br />
non-cubic minerals<br />
Morphological<br />
characteristics<br />
Grain form, twins,<br />
fractures, cleavage,<br />
zoning, inclusions,<br />
decomposition, alteration<br />
Ch. 3.1 – 3.4<br />
Observations in crossed polarizers mode<br />
Mineral <strong>section</strong> remains black during rotation <strong>of</strong> stage<br />
a. isotropic<br />
no optic axis interference figure<br />
Glasses; cubic minerals<br />
b. anisotropic: Section ⊥ optic axis<br />
optic axis interference figure:<br />
uniaxial, biaxial; Ch. 4.2.5<br />
non-cubic minerals<br />
Mineral <strong>section</strong> changes from bright <strong>to</strong> dark during stage rotation = anisotropic<br />
Interference colour<br />
low, high<br />
normal, anomalous<br />
Ch. 4.2.3<br />
Sections <strong>of</strong> maximum<br />
interference colour<br />
Sections with low<br />
interference colour<br />
Morphological features<br />
Twins and intergrowths;<br />
Subgrains, undulose extinction;<br />
Zoning, unmixing;<br />
Brewster crosses in spherulites<br />
Ch. 3.3, 3.4, 4.2.3<br />
Raith, Raase & Reinhardt – February 2012<br />
birefringence<br />
Ch. 4.2.3<br />
orthorhombic<br />
monoclinic<br />
Extinction<br />
straight<br />
symmetrical<br />
inclined<br />
a. optically uniaxial, optic sign<br />
Sections ~ ⊥ opt. axis<br />
b. optically biaxial, optic sign<br />
Sections ~ ⊥ acute bisectrix, or ⊥ optic axis<br />
Ch. 4.2.5<br />
hexagonal<br />
trigonal<br />
tetragonal<br />
triclinic<br />
Sign <strong>of</strong> elongation: l (+), l (-)<br />
Ch. 4.2.4<br />
Extinction angle ε<br />
Ch. 4.2.4<br />
127