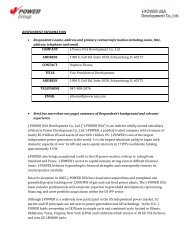
US SOLAR – WHITE PAPER 24 May 2012 1. INTRODUCTION <strong>Energy</strong> industry players, banks, and the federal government have met the majority of the solar sector’s project finance needs to date. But the landscape today is changing. 1 This evolution is being driven by two factors. First, traditional players are scaling back their participation. Constrained by regulatory requirements and by the continent's financial crisis, eurozone banks are offering loans of shorter duration and with slightly wider spreads over LIBOR. In the US, a key Department of <strong>Energy</strong> loan guarantee programme lapsed in 2011 making less low-priced capital available for large-scale projects. Second, thanks to the continuing low-interest rate environment, non-traditional investors are becoming more interested, lured by the risk/return profiles of solar projects that employ well proven PV technology. Motivated by attractive yields and the examples set by Chevron and Google, US corporations are eyeing forays into tax equity. Pension funds and insurance companies are willing to give solar projects a serious look in the wake of the successful bond issuance for a solar project owned by a Warren Buffett-backed utility. The past year has seen a crescendo of conversations around financing vehicles that draw on the capital markets, such as solar-backed securitisation, master limited partnerships, and structures resembling real estate investment trusts. In parallel, new business models for deployment of solar have flourished, including variations of third-party financing structures which enable customers to enjoy the benefit of local systems at little or no upfront cost. These models have the potential to broaden substantially the universe of solar investors. This report assesses the current landscape for US solar financing, examines some of the more intriguing new structures, and explores where things are likely to go from here. It was undertaken by Bloomberg New <strong>Energy</strong> Finance and commissioned by Reznick Group – a national accounting, tax, and business advisory firm. 2. US SOLAR FINANCING: HISTORY AND OUTLOOK 2.1. Historical financing trends Asset financing for US PV projects has grown at a 58% annual growth rate since 2004, with a record year in 2011 Asset financing for US PV projects has grown at a 58% compound annual growth rate since Bloomberg New <strong>Energy</strong> Finance began tracking this data in 2004. Activity surged to a record $21.1bn in 2011 (Figure 1), fuelled by the one-year extension of the US Department of Treasury’s 1603 'cash grant' programme, an incentive that entitled project developers to receive 30% of a project’s capital cost in the form of cash, and the Department of <strong>Energy</strong>’s (DOE) 1705 loan guarantee programme, which provides partial risk-sharing with lenders by guaranteeing up to 80% loans to qualified projects. The cash grant programme expired at the end of 2011, and the loan guarantee programme made its final commitments in September 2011. Historically, most of the financing, particularly for debt and tax equity, has come from a relatively small number of players, via three types of capital: • Sponsor equity: equity from large independent power producers (IPPs), smaller developers, utilities, and private equity players • Debt: construction financing and term debt, primarily from banks and the US Department of Treasury (via its lending arm, the Federal Financing Bank) (Figure 2) 1 References to solar throughout this Note generally apply to photovoltaic (PV) technology, especially when describing distributed solar applications. However, many of the investment strategies and financing structures described here could also be applicable for solar thermal and even other renewables. © Bloomberg New <strong>Energy</strong> Finance 2012 Strictly no copying, forwarding, shared passwords or redistribution allowed without prior written permission of Bloomberg New <strong>Energy</strong> Finance. For more information on terms of use, please contact sales.bnef@bloomberg.net. Copyright and Disclaimer notice on page 28 applies throughout. Page 2 of 28
US SOLAR – WHITE PAPER 24 May 2012 • Tax equity: upfront equity, in exchange for tax credits and other benefits, primarily from US banks and insurance companies (Figure 3) Figure 1: Asset financing for US PV projects ($bn) 25 Figure 2: Debt financing providers for US PV projects with disclosed deal terms, 2008-12 ($bn) 8 20 15 10 5 0 2004 2005 2006 2007 2008 2009 2010 2011 Small distributed capacity Utility scale Source: Bloomberg New <strong>Energy</strong> Finance Notes: Small distributed capacity is