2012 Annual Report - Hong Kong Monetary Authority
2012 Annual Report - Hong Kong Monetary Authority
2012 Annual Report - Hong Kong Monetary Authority

Create successful ePaper yourself
Turn your PDF publications into a flip-book with our unique Google optimized e-Paper software.
REMUNERATION REPORT (continued)<br />
8.5 STI – PERFORMANCE AND STI CORRELATION<br />
ANZ has had another successful year with performance assessed<br />
by the Board as largely being solid and on target across the full range<br />
of quantitative and qualitative measures. Metrics associated with<br />
shareholder returns have outperformed overall, metrics associated<br />
with finance, connectivity and people have been on target overall,<br />
and customer satisfaction was assessed as slightly below target<br />
overall. The Board has given full consideration to the performance of<br />
the Group and the Disclosed Executives in determining their rewards.<br />
For <strong>2012</strong> the average STI for the CEO and Disclosed Executives<br />
was 117% of target compared to 110% of target for the prior year.<br />
This increase (7%) broadly aligns with the year on year increase<br />
in underlying profit (6%).<br />
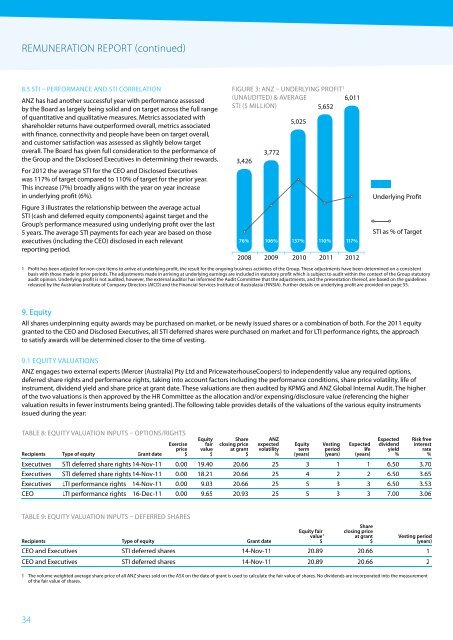
Figure 3 illustrates the relationship between the average actual<br />
STI (cash and deferred equity components) against target and the<br />
Group’s performance measured using underlying profit over the last<br />
5 years. The average STI payments for each year are based on those<br />
executives (including the CEO) disclosed in each relevant<br />
reporting period.<br />
FIGURE 3: ANZ – UNDERLYING PROFIT 1<br />
(UNAUDITED) & AVERAGE<br />
6,011<br />
STI ($ MILLION)<br />
5,652<br />
3,426<br />
2008<br />
3,772<br />
2009<br />
5,025<br />
137% 110 % 117%<br />
2010<br />
2011<br />
<strong>2012</strong><br />
Underlying Profit<br />
STI as % of Target<br />
1 Profit has been adjusted for non-core items to arrive at underlying profit, the result for the ongoing business activities of the Group. These adjustments have been determined on a consistent<br />
basis with those made in prior periods. The adjustments made in arriving at underlying earnings are included in statutory profit which is subject to audit within the context of the Group statutory<br />
audit opinion. Underlying profit is not audited, however, the external auditor has informed the Audit Committee that the adjustments, and the presentation thereof, are based on the guidelines<br />
released by the Australian Institute of Company Directors (AICD) and the Financial Services Institute of Australasia (FINSIA). Further details on underlying profit are provided on page 55.<br />
76%<br />
106%<br />
9. Equity<br />
All shares underpinning equity awards may be purchased on market, or be newly issued shares or a combination of both. For the 2011 equity<br />
granted to the CEO and Disclosed Executives, all STI deferred shares were purchased on market and for LTI performance rights, the approach<br />
to satisfy awards will be determined closer to the time of vesting.<br />
9.1 EQUITY VALUATIONS<br />
ANZ engages two external experts (Mercer (Australia) Pty Ltd and PricewaterhouseCoopers) to independently value any required options,<br />
deferred share rights and performance rights, taking into account factors including the performance conditions, share price volatility, life of<br />
instrument, dividend yield and share price at grant date. These valuations are then audited by KPMG and ANZ Global Internal Audit. The higher<br />
of the two valuations is then approved by the HR Committee as the allocation and/or expensing/disclosure value (referencing the higher<br />
valuation results in fewer instruments being granted). The following table provides details of the valuations of the various equity instruments<br />
issued during the year:<br />
TABLE 8: EQUITY VALUATION INPUTS – OPTIONS/RIGHTS<br />
Recipients Type of equity Grant date<br />
Exercise<br />
price<br />
$<br />
Equity<br />
fair<br />
value<br />
$<br />
Share<br />
closing price<br />
at grant<br />
$<br />
ANZ<br />
expected<br />
volatility<br />
%<br />
Equity<br />
term<br />
(years)<br />
Vesting<br />
period<br />
(years)<br />
Expected<br />
life<br />
(years)<br />
Expected<br />
dividend<br />
yield<br />
%<br />
Risk free<br />
interest<br />
rate<br />
%<br />
Executives STI deferred share rights 14-Nov-11 0.00 19.40 20.66 25 3 1 1 6.50 3.70<br />
Executives STI deferred share rights 14-Nov-11 0.00 18.21 20.66 25 4 2 2 6.50 3.65<br />
Executives LTI performance rights 14-Nov-11 0.00 9.03 20.66 25 5 3 3 6.50 3.53<br />
CEO LTI performance rights 16-Dec-11 0.00 9.65 20.93 25 5 3 3 7.00 3.06<br />
TABLE 9: EQUITY VALUATION INPUTS – DEFERRED SHARES<br />
Share<br />
Equity fair closing price<br />
value 1<br />
at grant<br />
Vesting period<br />
Recipients Type of equity Grant date<br />
$<br />
$<br />
(years)<br />
CEO and Executives STI deferred shares 14-Nov-11 20.89 20.66 1<br />
CEO and Executives STI deferred shares 14-Nov-11 20.89 20.66 2<br />
1 The volume weighted average share price of all ANZ shares sold on the ASX on the date of grant is used to calculate the fair value of shares. No dividends are incorporated into the measurement<br />
of the fair value of shares.<br />
34