download pdf - Oil and Gas Investor
download pdf - Oil and Gas Investor
download pdf - Oil and Gas Investor

You also want an ePaper? Increase the reach of your titles
YUMPU automatically turns print PDFs into web optimized ePapers that Google loves.
ate companies have been in the past.<br />
This has helped the juniors rediscover<br />
their niche as they have been<br />
picking up the slack. They have also<br />
become feedstock for the trusts that use<br />
their tremendous access to capital to<br />
buy up junior companies at a rate of<br />
five to 10 per quarter.<br />
As a group, the juniors seem to favor<br />
gas production over crude oil. <strong>Gas</strong> can<br />
be produced with comparably lower operating<br />
costs, while the prices received<br />
are often relatively higher than those<br />
received for oil. Some of the companies<br />
that had the highest proportion of their<br />
fourth-quarter 2003 production<br />
weighted to gas include Hawker Resources<br />
(Toronto: HKR) at 100%,<br />
Ketch Resources (Toronto: KER) at<br />
94% <strong>and</strong> Diaz Resources (Toronto:<br />
DZR.A) at 88%.<br />
One company that has found success<br />
while bucking this trend is Blackrock<br />
Resources (Toronto: BVI) with 100%<br />
of production made up of heavy oil.<br />
An extended period of high commodity<br />
prices has benefited the Canadian<br />
juniors <strong>and</strong> their investors. During<br />
2003, juniors showed an average return<br />
of 63.5%. Only 15% experienced a<br />
share-price decrease, while one in four<br />
saw its share price rise 100%.<br />
By comparison, the 17 Canadian energy<br />
trusts that make up the intermediate<br />
sector had total returns, including<br />
distributions, averaging 49% for 2003.<br />
That included an 18% average return<br />
from distributions paid during the year<br />
as well as a 31% average gain in unit<br />
prices.<br />
In the first four months of 2004, the<br />
market for juniors appeared to be catching<br />
its breath, with only a 2% average<br />
share-price increase during this period.<br />
Valuations, key metrics<br />
<strong>Investor</strong>s in junior companies, <strong>and</strong><br />
often the executives of these companies<br />
themselves, frequently compare companies’<br />
financial <strong>and</strong> operating results<br />
against each other to make more informed<br />
investment decisions.<br />
However, in a recent survey Iradesso<br />
Communications found that the quality<br />
of the management team is the most<br />
important factor for investment decisions.<br />
Of course, this is impossible to<br />
objectify, although a past record of success<br />
or failure is as close as one can<br />
come.<br />
Another key factor that cannot be<br />
found in the comparison of investment<br />
ratios or multiples is the quality of future<br />
growth prospects. This means some<br />
companies end up trading at much<br />
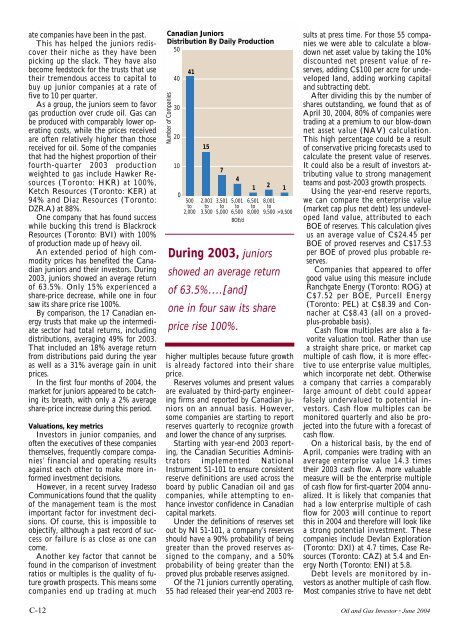
Canadian Juniors<br />
Distribution By Daily Production<br />
50<br />
Number of Companies<br />
40<br />
30<br />
20<br />
10<br />
0<br />
41<br />
500<br />
to<br />
2,000<br />
15<br />
2,001<br />
to<br />
3,500<br />
7<br />
3,501<br />
to<br />
5,000<br />
5,001<br />
to<br />
6,500<br />
BOE/d<br />
6,501<br />
to<br />
8,000<br />
8,001<br />
to<br />
9,500 >9,500<br />
During 2003, juniors<br />
showed an average return<br />
of 63.5%….[<strong>and</strong>]<br />
one in four saw its share<br />
price rise 100%.<br />
4<br />
1<br />
2<br />
1<br />
higher multiples because future growth<br />
is already factored into their share<br />
price.<br />
Reserves volumes <strong>and</strong> present values<br />
are evaluated by third-party engineering<br />
firms <strong>and</strong> reported by Canadian juniors<br />
on an annual basis. However,<br />
some companies are starting to report<br />
reserves quarterly to recognize growth<br />
<strong>and</strong> lower the chance of any surprises.<br />
Starting with year-end 2003 reporting,<br />
the Canadian Securities Administrators<br />
implemented National<br />
Instrument 51-101 to ensure consistent<br />
reserve definitions are used across the<br />
board by public Canadian oil <strong>and</strong> gas<br />
companies, while attempting to enhance<br />
investor confidence in Canadian<br />
capital markets.<br />
Under the definitions of reserves set<br />
out by NI 51-101, a company’s reserves<br />
should have a 90% probability of being<br />
greater than the proved reserves assigned<br />
to the company, <strong>and</strong> a 50%<br />
probability of being greater than the<br />
proved plus probable reserves assigned.<br />
Of the 71 juniors currently operating,<br />
55 had released their year-end 2003 results<br />
at press time. For those 55 companies<br />
we were able to calculate a blowdown<br />
net asset value by taking the 10%<br />
discounted net present value of reserves,<br />
adding C$100 per acre for undeveloped<br />
l<strong>and</strong>, adding working capital<br />
<strong>and</strong> subtracting debt.<br />
After dividing this by the number of<br />
shares outst<strong>and</strong>ing, we found that as of<br />
April 30, 2004, 80% of companies were<br />
trading at a premium to our blow-down<br />
net asset value (NAV) calculation.<br />
This high percentage could be a result<br />
of conservative pricing forecasts used to<br />
calculate the present value of reserves.<br />
It could also be a result of investors attributing<br />
value to strong management<br />
teams <strong>and</strong> post-2003 growth prospects.<br />
Using the year-end reserve reports,<br />
we can compare the enterprise value<br />
(market cap plus net debt) less undeveloped<br />
l<strong>and</strong> value, attributed to each<br />
BOE of reserves. This calculation gives<br />
us an average value of C$24.45 per<br />
BOE of proved reserves <strong>and</strong> C$17.53<br />
per BOE of proved plus probable reserves.<br />
Companies that appeared to offer<br />
good value using this measure include<br />
Ranchgate Energy (Toronto: ROG) at<br />
C$7.52 per BOE, Purcell Energy<br />
(Toronto: PEL) at C$8.39 <strong>and</strong> Connacher<br />
at C$8.43 (all on a provedplus-probable<br />
basis).<br />
Cash flow multiples are also a favorite<br />
valuation tool. Rather than use<br />
a straight share price, or market cap<br />
multiple of cash flow, it is more effective<br />
to use enterprise value multiples,<br />
which incorporate net debt. Otherwise<br />
a company that carries a comparably<br />
large amount of debt could appear<br />
falsely undervalued to potential investors.<br />
Cash flow multiples can be<br />
monitored quarterly <strong>and</strong> also be projected<br />
into the future with a forecast of<br />
cash flow.<br />
On a historical basis, by the end of<br />
April, companies were trading with an<br />
average enterprise value 14.3 times<br />
their 2003 cash flow. A more valuable<br />
measure will be the enterprise multiple<br />
of cash flow for first-quarter 2004 annualized.<br />
It is likely that companies that<br />
had a low enterprise multiple of cash<br />
flow for 2003 will continue to report<br />
this in 2004 <strong>and</strong> therefore will look like<br />
a strong potential investment. These<br />
companies include Devlan Exploration<br />
(Toronto: DXI) at 4.7 times, Case Resources<br />
(Toronto: CAZ) at 5.4 <strong>and</strong> Energy<br />
North (Toronto: ENI) at 5.8.<br />
Debt levels are monitored by investors<br />
as another multiple of cash flow.<br />
Most companies strive to have net debt<br />
C-12 <strong>Oil</strong> <strong>and</strong> <strong>Gas</strong> <strong>Investor</strong> ▪ June 2004