JSB Market Research: HNWI Asset Allocation in Japan 2014
The "HNWI Asset Allocation in Japan 2014" report is the result of extensive research covering the high net worth individual (HNWI) population and wealth management market in Japan.
The "HNWI Asset Allocation in Japan 2014" report is the result of extensive research covering the high net worth individual (HNWI) population and wealth management market in Japan.

You also want an ePaper? Increase the reach of your titles
YUMPU automatically turns print PDFs into web optimized ePapers that Google loves.
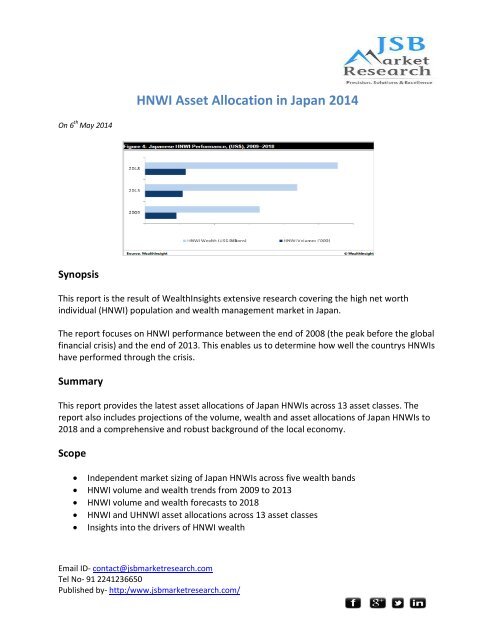
<strong>HNWI</strong> <strong>Asset</strong> <strong>Allocation</strong> <strong>in</strong> <strong>Japan</strong> <strong>2014</strong><br />
On 6 th May <strong>2014</strong><br />
Synopsis<br />
This report is the result of WealthInsights extensive research cover<strong>in</strong>g the high net worth<br />
<strong>in</strong>dividual (<strong>HNWI</strong>) population and wealth management market <strong>in</strong> <strong>Japan</strong>.<br />
The report focuses on <strong>HNWI</strong> performance between the end of 2008 (the peak before the global<br />
f<strong>in</strong>ancial crisis) and the end of 2013. This enables us to determ<strong>in</strong>e how well the countrys <strong>HNWI</strong>s<br />
have performed through the crisis.<br />
Summary<br />
This report provides the latest asset allocations of <strong>Japan</strong> <strong>HNWI</strong>s across 13 asset classes. The<br />
report also <strong>in</strong>cludes projections of the volume, wealth and asset allocations of <strong>Japan</strong> <strong>HNWI</strong>s to<br />
2018 and a comprehensive and robust background of the local economy.<br />
Scope<br />
Independent market siz<strong>in</strong>g of <strong>Japan</strong> <strong>HNWI</strong>s across five wealth bands<br />
<strong>HNWI</strong> volume and wealth trends from 2009 to 2013<br />
<strong>HNWI</strong> volume and wealth forecasts to 2018<br />
<strong>HNWI</strong> and U<strong>HNWI</strong> asset allocations across 13 asset classes<br />
Insights <strong>in</strong>to the drivers of <strong>HNWI</strong> wealth<br />
Email ID- contact@jsbmarketresearch.com<br />
Tel No- 91 2241236650<br />
Published by- http:/www.jsbmarketresearch.com/
Reasons To Buy<br />
The WealthInsight Intelligence Center Database is an unparalleled resource and the lead<strong>in</strong>g<br />
resource of its k<strong>in</strong>d. Compiled and curated by a team of expert research specialists, the<br />
database comprises dossiers on over 60,000 <strong>HNWI</strong>s from around the world.<br />
The Intelligence Center also <strong>in</strong>cludes track<strong>in</strong>g of wealth and liquidity events as they happen and<br />
detailed profiles of major private banks, wealth managers and family offices <strong>in</strong> each market.<br />
With the Database as the foundation for our research and analysis, we are able obta<strong>in</strong> an<br />
unsurpassed level of granularity, <strong>in</strong>sight and authority on the <strong>HNWI</strong> and wealth management<br />
universe <strong>in</strong> each of the countries and regions we cover.<br />
Report <strong>in</strong>cludes comprehensive forecasts to 2018.<br />
Key Highlights<br />
In 2013, bus<strong>in</strong>ess <strong>in</strong>terests was the largest asset class for <strong>Japan</strong>ese <strong>HNWI</strong>s, with 30.0% of total<br />
<strong>HNWI</strong> assets, followed by equities with 26.0%, real estate with 19.0%, fixed-<strong>in</strong>come with 10.0%,<br />
cash and deposits with 8.0% and alternatives with 7.0%.<br />
Equities, alternatives and bus<strong>in</strong>ess <strong>in</strong>terests recorded growth dur<strong>in</strong>g the review period at<br />
respective rates of 53.0%, 46.0% and 36.0%.<br />
Alternative assets held by <strong>Japan</strong>ese <strong>HNWI</strong>s <strong>in</strong>creased dur<strong>in</strong>g the review period, from 6.3% of<br />
the total <strong>HNWI</strong> assets <strong>in</strong> 2009 to 7.0% <strong>in</strong> 2013; <strong>HNWI</strong> allocations to commodities <strong>in</strong>creased<br />
from 1.2% of total assets <strong>in</strong> 2009 to 1.6% <strong>in</strong> 2013.<br />
Over the forecast period, WealthInsight expects allocations <strong>in</strong> commodities to decl<strong>in</strong>e to 1.3%<br />
of total <strong>HNWI</strong> assets by 2018, as global liquidity tightens due to a forecast near-term drop <strong>in</strong><br />
demand from Ch<strong>in</strong>a for raw materials. This is expected to cause global commodity prices to<br />
flatten out.<br />
As of 2013, <strong>Japan</strong>ese <strong>HNWI</strong> liquid assets amounted to US$3.9 trillion, represent<strong>in</strong>g 44.0% of<br />
wealth hold<strong>in</strong>gs.<br />
Email ID- contact@jsbmarketresearch.com<br />
Tel No- 91 2241236650<br />
Published by- http:/www.jsbmarketresearch.com/
Other <strong>in</strong>dustries we cover:<br />
<br />
<br />
<br />
<br />
<br />
<br />
<br />
<br />
<br />
Advertis<strong>in</strong>g and Media<br />
Automotive and Parts<br />
Consumer Goods<br />
Healthcare and Medical<br />
F<strong>in</strong>ance and Bank<strong>in</strong>g<br />
Food and Beverages<br />
Travel and Tourism<br />
Textiles and Cloth<strong>in</strong>g<br />
SWOT Analysis<br />
Additional report highlights:<br />
<br />
<br />
Over the forecast period, WealthInsight expects allocations <strong>in</strong> commodities to decl<strong>in</strong>e to<br />
just over 1% of total <strong>HNWI</strong> assets by 2018, as global liquidity tightens due to a forecast<br />
near-term drop <strong>in</strong> demand from Ch<strong>in</strong>a for raw materials.<br />
Growth rates for <strong>HNWI</strong> wealth and volumes are expected to improve over the forecast<br />
period.<br />
The number of <strong>Japan</strong>ese <strong>HNWI</strong>s is forecast to grow by 7% to reach 2,340,459 <strong>in</strong> 2018.<br />
<strong>HNWI</strong> wealth is projected to <strong>in</strong>crease by 21% to reach just over US$11 trillion by 2018.<br />
Buy now to f<strong>in</strong>d out more!<br />
Table of Content<br />
1 Introduction<br />
1.1 Details of this Report<br />
1.2 Def<strong>in</strong>itions<br />
2 Summary<br />
3 Wealth Sector Fundamentals<br />
3.1 Political Background<br />
3.2 Economic Background<br />
Email ID- contact@jsbmarketresearch.com<br />
Tel No- 91 2241236650<br />
Published by- http:/www.jsbmarketresearch.com/
3.3 Benchmark<strong>in</strong>g <strong>Japan</strong>s Wealth <strong>in</strong> Context<br />
3.3.1 Distribution of wealth <strong>in</strong> <strong>Japan</strong><br />
3.4 <strong>HNWI</strong> Volume and Wealth Trends<br />
4 Analysis of <strong>Japan</strong>ese <strong>HNWI</strong> Investments<br />
4.1 Analysis by <strong>Asset</strong> Class<br />
4.1.1 Trends <strong>in</strong> alternative assets<br />
4.1.2 Trends <strong>in</strong> art, w<strong>in</strong>e and wheels<br />
4.1.3 Trends of <strong>in</strong>vestment <strong>in</strong> real estate<br />
4.1.4 Trends of <strong>in</strong>vestment <strong>in</strong> cash and deposits<br />
4.1.5 Trends of <strong>in</strong>vestment <strong>in</strong> fixed-<strong>in</strong>come<br />
4.1.6 Trends of <strong>in</strong>vestment <strong>in</strong> equity<br />
4.1.7 Trends of <strong>in</strong>vestment <strong>in</strong> bus<strong>in</strong>ess <strong>in</strong>terests<br />
4.2 Analysis of Foreign Investments<br />
4.2.1 Investments <strong>in</strong> Europe<br />
4.2.2 Investments <strong>in</strong> North America (<strong>in</strong>clud<strong>in</strong>g the US, Mexico and the Caribbean)<br />
4.2.3 Investments <strong>in</strong> Asia-Pacific<br />
4.2.4 Investments <strong>in</strong> Central and South America<br />
4.2.5 Investments <strong>in</strong> the Middle East<br />
4.2.6 Investments <strong>in</strong> Africa<br />
4.3 Alternative Breakdown: Liquid vs Investable <strong>Asset</strong>s<br />
Email ID- contact@jsbmarketresearch.com<br />
Tel No- 91 2241236650<br />
Published by- http:/www.jsbmarketresearch.com/
4.4 Analysis of <strong>Japan</strong>ese U<strong>HNWI</strong> Investments<br />
5 Appendix<br />
5.1 Additional Components of the Wealth Sector <strong>in</strong> <strong>Japan</strong><br />
5.1.1 Philanthropy<br />
5.1.2 Demand for <strong>in</strong>tergenerational wealth transfer<br />
5.1.3 Human resource availability for the wealth management <strong>in</strong>dustry<br />
5.2 Regulations on Taxes<br />
5.3 Regulations Related to Immigration, Investment and Employment<br />
5.4 Key Drivers<br />
5.4.1 JPY to US$ exchange rate<br />
5.4.2 Real GDP growth<br />
5.4.3 Per capita GDP<br />
5.4.4 Domestic market capitalization<br />
5.4.5 Commodity <strong>in</strong>dex<br />
5.4.6 Foreign direct <strong>in</strong>vestments (FDI) <strong>in</strong>flows and outflows<br />
5.4.7 Inflation rate<br />
5.4.8 Interest rate<br />
5.4.9 Balance of payments<br />
5.4.10 Government debt<br />
5.4.11 Stock market performance<br />
Email ID- contact@jsbmarketresearch.com<br />
Tel No- 91 2241236650<br />
Published by- http:/www.jsbmarketresearch.com/
5.5 Wealth Breakdowns<br />
6 About WealthInsight<br />
List of Tables<br />
Table 1: <strong>HNWI</strong> Wealth Band and Group Def<strong>in</strong>itions<br />
Table 2: <strong>Japan</strong>ese Population Volume of Key Cities (Million), 2013<br />
Table 3: <strong>Japan</strong>ese <strong>Allocation</strong>s of <strong>HNWI</strong> <strong>Asset</strong>s (%), 20092018<br />
Table 4: <strong>Japan</strong>ese <strong>HNWI</strong>s Hold<strong>in</strong>gs Growth (%), 20092018<br />
Table 5: <strong>Japan</strong>ese <strong>HNWI</strong>s Alternative <strong>Asset</strong> Composition (%), 20092018<br />
Table 6: <strong>Japan</strong>ese <strong>HNWI</strong>s Trends of Investments <strong>in</strong> Alternative <strong>Asset</strong>s (%), 20092018<br />
Table 7: <strong>Japan</strong>ese Trends <strong>in</strong> Art, W<strong>in</strong>e and Wheels, 20092013<br />
Table 8: Global Prime Real Estate Prices per m2 (US$), <strong>2014</strong><br />
Table 9: <strong>Japan</strong>ese <strong>HNWI</strong>s Percentage of Foreign Investment <strong>Allocation</strong>s (%), 20092018<br />
Table 10: <strong>Japan</strong>ese <strong>HNWI</strong>s Liquidity Breakdown (US$ Billion), 20092018<br />
Table 11: <strong>Japan</strong>ese <strong>HNWI</strong>s Liquidity Breakdown (%), 20092018<br />
Table 12: <strong>Japan</strong>ese U<strong>HNWI</strong>s <strong>Allocation</strong>s and Share of <strong>HNWI</strong> <strong>Asset</strong>s, 2013<br />
Table 13: <strong>Japan</strong>ese Income Tax Bands (JPY), 20122013<br />
Table 14: <strong>Japan</strong>ese Exchange Rate JPY to US$, 20092018<br />
Table 15: <strong>Japan</strong>ese Real GDP Growth (%), 20092018<br />
Table 16: <strong>Japan</strong>ese GDP Per Capita (US$), 20092018<br />
Table 17: <strong>Japan</strong>ese Domestic <strong>Market</strong> Capitalization (US$ Billion), 20092013<br />
Email ID- contact@jsbmarketresearch.com<br />
Tel No- 91 2241236650<br />
Published by- http:/www.jsbmarketresearch.com/
Table 18: <strong>Japan</strong>ese Commodity Indices, 20092018<br />
Table 19: <strong>Japan</strong>ese Foreign Direct Investments (US$ Billion), 20092018<br />
Table 20: <strong>Japan</strong>ese Inflation Rate (%), 20092018<br />
Table 21: <strong>Japan</strong>ese Money <strong>Market</strong> Rate (%), 20092018<br />
Table 22: <strong>Japan</strong>ese Balance of Payments (US$ Billion), 20092013<br />
Table 23: <strong>Japan</strong>ese Government Debt as a Percentage of GDP (%), 20092018<br />
Table 24: <strong>Japan</strong>ese Stock <strong>Market</strong> Performance (Index), 20092013<br />
Table 25: <strong>Japan</strong>ese <strong>HNWI</strong> Wealth vs GDP Ratio (%), 20092018<br />
Table 26: <strong>Japan</strong> Appendix One<br />
Table 27: <strong>Japan</strong> Appendix Two<br />
List of Figures<br />
Figure 1: <strong>HNWI</strong> Wealth Band Def<strong>in</strong>itions<br />
Figure 2: Map of <strong>Japan</strong><br />
Figure 3: <strong>Japan</strong>ese <strong>Asset</strong> Price Performance (US$), 20092013<br />
Figure 4: <strong>Japan</strong>ese <strong>HNWI</strong> Performance, (US$), 20092018<br />
Figure 5: <strong>Japan</strong>ese vs Global <strong>HNWI</strong>s <strong>in</strong> Terms of Volume and GDP per Capita Growth (US$),<br />
20092013<br />
Figure 6: <strong>Japan</strong>ese <strong>HNWI</strong>s <strong>Asset</strong> Class Composition (%), 20092018<br />
Figure 7: <strong>Japan</strong>ese <strong>HNWI</strong>s Trends <strong>in</strong> Alternative <strong>Asset</strong>s (US$ Billion), 20092018<br />
Figure 8: <strong>Japan</strong>ese Trends <strong>in</strong> Art, W<strong>in</strong>e and Wheels, 20092013<br />
Figure 9: <strong>Japan</strong>ese <strong>HNWI</strong>s Foreign Investment <strong>Allocation</strong> and Growth (%), 2013<br />
Email ID- contact@jsbmarketresearch.com<br />
Tel No- 91 2241236650<br />
Published by- http:/www.jsbmarketresearch.com/
Figure 10: <strong>Japan</strong>ese <strong>HNWI</strong>s Global Distribution of Foreign Investments (%), 20092018<br />
Figure 11: <strong>Japan</strong>ese <strong>HNWI</strong>s Liquidity Breakdown (%), 20092018<br />
Figure 12: <strong>Japan</strong>ese U<strong>HNWI</strong>s <strong>Asset</strong> Class Composition (%), 20092018<br />
Figure 13: <strong>Japan</strong>ese Exchange Rate JPY to US$, 20092018<br />
Figure 14: <strong>Japan</strong>ese Real GDP Growth (%), 20092018<br />
Figure 15: <strong>Japan</strong>ese GDP Per Capita (US$), 20092018<br />
Figure 16: <strong>Japan</strong>ese Domestic <strong>Market</strong> Capitalization (US$ Billion), 20092013<br />
Figure 17: <strong>Japan</strong>ese Commodity Indices, 20092018<br />
Figure 18: <strong>Japan</strong>ese Foreign Direct Investments (US$ Billion), 20092018<br />
Figure 19: <strong>Japan</strong>ese Inflation Rate (%), 20092018<br />
Figure 20: <strong>Japan</strong>ese Money <strong>Market</strong> Rate (%), 20092018<br />
Figure 21: <strong>Japan</strong>ese Balance of Payments (US$ Billion), 20092013<br />
Figure 22: <strong>Japan</strong>ese Government Debt as a Percentage of GDP (%), 20092018<br />
Figure 23: <strong>Japan</strong>ese Stock <strong>Market</strong> Performance (Index), 20092013<br />
Figure 24: <strong>Japan</strong>ese <strong>HNWI</strong> Wealth vs GDP Ratio (%), 20092018<br />
Figure 25: <strong>Japan</strong>ese <strong>HNWI</strong>s Volume by Wealth Band, 20092018<br />
Figure 26: <strong>Japan</strong>ese <strong>HNWI</strong>s Wealth by Wealth Band (US$ Billion), 20092018<br />
Figure 27: <strong>Japan</strong>ese <strong>HNWI</strong>s Wealth per Capita (US$ Million), 20092018<br />
Email ID- contact@jsbmarketresearch.com<br />
Tel No- 91 2241236650<br />
Published by- http:/www.jsbmarketresearch.com/
Related reports:<br />
Personal Accident and Health Insurance Investments <strong>in</strong> the US to 2017: <strong>Market</strong> Databook<br />
Julius Baer Group Ltd. (BAER) : Company Profile and SWOT Analysis<br />
About <strong>JSB</strong> <strong>Market</strong> <strong>Research</strong>:-<br />
<strong>JSB</strong> market research is a lead<strong>in</strong>g player <strong>in</strong> the market of research report distribution. It is<br />
one-stop-shop for all <strong>in</strong>formation related to market research for any sector of the <strong>in</strong>dustry.<br />
Along with provid<strong>in</strong>g <strong>in</strong>-depth analysis though reports, <strong>JSB</strong> market research also provides<br />
regular updates of the market though newsletters. Our reports are a well-researched work of<br />
market researchers with an extensive knowledge and a good level of market experience.<br />
To know more on <strong>HNWI</strong> <strong>Asset</strong> <strong>Allocation</strong> <strong>in</strong> <strong>Japan</strong> <strong>2014</strong><br />
http://www.jsbmarketresearch.com/f<strong>in</strong>ance-bank<strong>in</strong>g/r-<strong>HNWI</strong>-<strong>Asset</strong>-<strong>Allocation</strong>-<strong>in</strong>-<strong>Japan</strong>-<br />
<strong>2014</strong>-108434<br />
Email ID- contact@jsbmarketresearch.com<br />
Tel No- 91 2241236650<br />
Published by- http:/www.jsbmarketresearch.com/