National Hydrology Seminar 2007 - The Office of Public Works
National Hydrology Seminar 2007 - The Office of Public Works
National Hydrology Seminar 2007 - The Office of Public Works

Create successful ePaper yourself
Turn your PDF publications into a flip-book with our unique Google optimized e-Paper software.
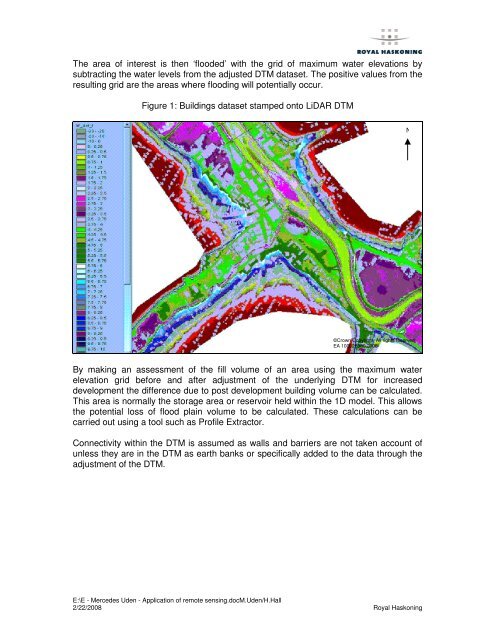
<strong>The</strong> area <strong>of</strong> interest is then ‘flooded’ with the grid <strong>of</strong> maximum water elevations by<br />
subtracting the water levels from the adjusted DTM dataset. <strong>The</strong> positive values from the<br />
resulting grid are the areas where flooding will potentially occur.<br />
Figure 1: Buildings dataset stamped onto LiDAR DTM<br />
N<br />
©Crown Copyright. All rights reserved<br />
EA 100026380 2006<br />
By making an assessment <strong>of</strong> the fill volume <strong>of</strong> an area using the maximum water<br />
elevation grid before and after adjustment <strong>of</strong> the underlying DTM for increased<br />
development the difference due to post development building volume can be calculated.<br />
This area is normally the storage area or reservoir held within the 1D model. This allows<br />
the potential loss <strong>of</strong> flood plain volume to be calculated. <strong>The</strong>se calculations can be<br />
carried out using a tool such as Pr<strong>of</strong>ile Extractor.<br />
Connectivity within the DTM is assumed as walls and barriers are not taken account <strong>of</strong><br />
unless they are in the DTM as earth banks or specifically added to the data through the<br />
adjustment <strong>of</strong> the DTM.<br />
E:\E - Mercedes Uden - Application <strong>of</strong> remote sensing.docM.Uden/H.Hall<br />
2/22/2008 Royal Haskoning