

nureg/cr-6700 - Oak Ridge National Laboratory
nureg/cr-6700 - Oak Ridge National Laboratory
nureg/cr-6700 - Oak Ridge National Laboratory

Create successful ePaper yourself
Turn your PDF publications into a flip-book with our unique Google optimized e-Paper software.
Section 2<br />
Analysis Approach<br />
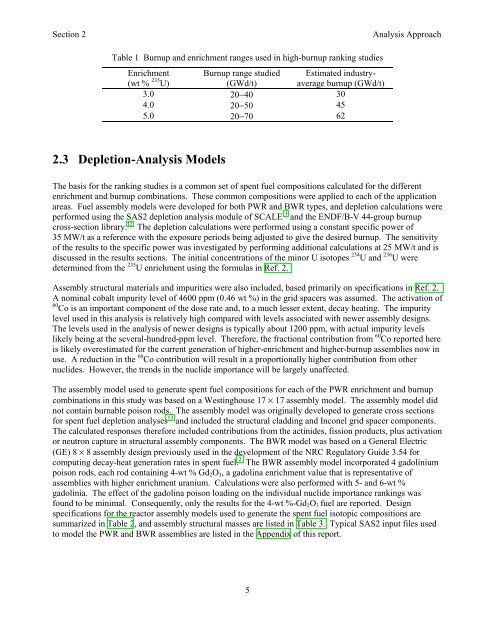
Table 1 Burnup and enrichment ranges used in high-burnup ranking studies<br />
Enrichment<br />
(wt % 235 U)<br />
Burnup range studied<br />
(GWd/t)<br />
Estimated industryaverage<br />
burnup (GWd/t)<br />
3.0 20−40 30<br />
4.0 20−50 45<br />
5.0 20−70 62<br />
2.3 Depletion-Analysis Models<br />
The basis for the ranking studies is a common set of spent fuel compositions calculated for the different<br />
enrichment and burnup combinations. These common compositions were applied to each of the application<br />
areas. Fuel assembly models were developed for both PWR and BWR types, and depletion calculations were<br />
performed using the SAS2 depletion analysis module of SCALE 11 and the ENDF/B-V 44-group burnup<br />
<strong>cr</strong>oss-section library. 12 The depletion calculations were performed using a constant specific power of<br />
35 MW/t as a reference with the exposure periods being adjusted to give the desired burnup. The sensitivity<br />
of the results to the specific power was investigated by performing additional calculations at 25 MW/t and is<br />
discussed in the results sections. The initial concentrations of the minor U isotopes 234 U and 236 U were<br />
determined from the 235 U enrichment using the formulas in Ref. 2.<br />
Assembly structural materials and impurities were also included, based primarily on specifications in Ref. 2.<br />
A nominal cobalt impurity level of 4600 ppm (0.46 wt %) in the grid spacers was assumed. The activation of<br />
60 Co is an important component of the dose rate and, to a much lesser extent, decay heating. The impurity<br />
level used in this analysis is relatively high compared with levels associated with newer assembly designs.<br />
The levels used in the analysis of newer designs is typically about 1200 ppm, with actual impurity levels<br />
likely being at the several-hundred-ppm level. Therefore, the fractional contribution from 60 Co reported here<br />
is likely overestimated for the current generation of higher-enrichment and higher-burnup assemblies now in<br />
use. A reduction in the 60 Co contribution will result in a proportionally higher contribution from other<br />
nuclides. However, the trends in the nuclide importance will be largely unaffected.<br />
The assembly model used to generate spent fuel compositions for each of the PWR enrichment and burnup<br />
combinations in this study was based on a Westinghouse 17 × 17 assembly model. The assembly model did<br />
not contain burnable poison rods. The assembly model was originally developed to generate <strong>cr</strong>oss sections<br />
for spent fuel depletion analyses 13 and included the structural cladding and Inconel grid spacer components.<br />
The calculated responses therefore included contributions from the actinides, fission products, plus activation<br />
or neutron capture in structural assembly components. The BWR model was based on a General Electric<br />
(GE) 8 × 8 assembly design previously used in the development of the NRC Regulatory Guide 3.54 for<br />
computing decay-heat generation rates in spent fuel. 2 The BWR assembly model incorporated 4 gadolinium<br />
poison rods, each rod containing 4-wt % Gd 2 O 3 , a gadolina enrichment value that is representative of<br />
assemblies with higher enrichment uranium. Calculations were also performed with 5- and 6-wt %<br />
gadolinia. The effect of the gadolina poison loading on the individual nuclide importance rankings was<br />
found to be minimal. Consequently, only the results for the 4-wt %-Gd 2 O 3 fuel are reported. Design<br />
specifications for the reactor assembly models used to generate the spent fuel isotopic compositions are<br />
summarized in Table 2, and assembly structural masses are listed in Table 3. Typical SAS2 input files used<br />
to model the PWR and BWR assemblies are listed in the Appendix of this report.<br />
5


