Hospital Outcomes Reports using Administrative Data - Office of ...
Hospital Outcomes Reports using Administrative Data - Office of ...
Hospital Outcomes Reports using Administrative Data - Office of ...
Create successful ePaper yourself
Turn your PDF publications into a flip-book with our unique Google optimized e-Paper software.
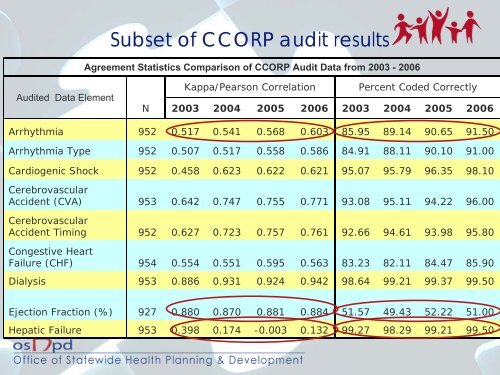
Subset <strong>of</strong> CCORP audit results<br />
Agreement Statistics Comparison <strong>of</strong> CCORP Audit <strong>Data</strong> from 2003 - 2006<br />
Audited <strong>Data</strong> Element<br />
Kappa/Pearson Correlation<br />
Percent Coded Correctly<br />
N 2003 2004 2005 2006 2003 2004 2005 2006<br />
Arrhythmia 952 0.517 0.541 0.568 0.603 85.95 89.14 90.65 91.50<br />
Arrhythmia Type 952 0.507 0.517 0.558 0.586 84.91 88.11 90.10 91.00<br />
Cardiogenic Shock 952 0.458 0.623 0.622 0.621 95.07 95.79 96.35 98.10<br />
Cerebrovascular<br />
Accident (CVA) 953 0.642 0.747 0.755 0.771 93.08 95.11 94.22 96.00<br />
Cerebrovascular<br />
Accident Timing 952 0.627 0.723 0.757 0.761 92.66 94.61 93.98 95.80<br />
Congestive Heart<br />
Failure (CHF) 954 0.554 0.551 0.595 0.563 83.23 82.11 84.47 85.90<br />
Dialysis 953 0.886 0.931 0.924 0.942 98.64 99.21 99.37 99.50<br />
Ejection Fraction (%) 927 0.880 0.870 0.881 0.884 51.57 49.43 52.22 51.00<br />
Hepatic Failure 953 0.398 0.174 -0.003 0.132 99.27 98.29 99.21 99.50


