Hospital Outcomes Reports using Administrative Data - Office of ...
Hospital Outcomes Reports using Administrative Data - Office of ...
Hospital Outcomes Reports using Administrative Data - Office of ...

Create successful ePaper yourself
Turn your PDF publications into a flip-book with our unique Google optimized e-Paper software.
<strong>Hospital</strong> <strong>Outcomes</strong> <strong>Reports</strong> <strong>using</strong><br />
<strong>Administrative</strong> <strong>Data</strong><br />
Presenter:<br />
Brian Paciotti, PhD
Main Points<br />
Measuring healthcare quality<br />
Summary <strong>of</strong> administrative data reports<br />
Risk-adjustment and quality ratings<br />
<strong>Hospital</strong> comment letters<br />
Adding laboratory values to the discharge data<br />
Challenges <strong>of</strong> public reporting
Healthcare Quality<br />
Robert Brook, Elizabeth McGlynn, and Paul Shekelle<br />
(2000) Defining and Measuring Quality <strong>of</strong> Care: A<br />
Perspective from US Researchers<br />
“In the last 30 years, research has demonstrated<br />
that 1) quality can be measured, 2) that quality<br />
varies enormously, 3) that where you go for care<br />
affects its quality far more than who you are,<br />
and 4) that improving quality <strong>of</strong> care, while<br />
possible, is difficult and painful.”
Organizational Factors and Clinical<br />
Processes Influence Patient <strong>Outcomes</strong><br />
Organizational<br />
factors<br />
(e.g., nursing ratios,<br />
hospital size)<br />
Clinical Processes<br />
(e.g., tests performed,<br />
beta-blockers)<br />
Patient <strong>Outcomes</strong><br />
(e.g., 30-day mortality,<br />
hospital readmission,<br />
complications)
Public Reporting <strong>of</strong> Healthcare<br />
<strong>Outcomes</strong><br />
Two pathways for improvement. Public reporting:<br />
1. Motivates internal quality improvement<br />
2. Steers patients and payers towards high performing<br />
hospitals or surgeons<br />
Evidence suggests that public reporting <strong>of</strong><br />
outcomes is effective
<strong>Administrative</strong> <strong>Data</strong> <strong>Reports</strong><br />
Heart Attack: 1992-94, 1994-96, 1996-98<br />
Community-Acquired Pneumonia: 1999-2001, 2002-2004, 2003-2005<br />
Agency for Healthcare Research and Quality (AHRQ) Inpatient<br />
Mortality Indicators: 2006-2007<br />
AHRQ volume and utilization indicators: 2005-2007<br />
Studies in preparation<br />
Maternal <strong>Outcomes</strong><br />
Congestive Heart Failure<br />
Abdominal Aortic Aneurysm (AAA) Repair<br />
Hip Fracture<br />
Stroke <strong>Outcomes</strong>
Risk-Adjustment and Quality<br />
Ratings<br />
<strong>Hospital</strong>-level risk-adjusted death rate (RADR)<br />
Apply regression coefficients to patient data to obtain<br />
expected number <strong>of</strong> deaths for each hospital<br />
RADR = observed death rate * statewide death rate<br />
expected death rate<br />
Confidence Intervals – 98%<br />
Low volume hospitals generally will have wider confidence<br />
intervals<br />
Quality rating:<br />
“Better” = RADR < state rate<br />
“Worse” = RADR > state rate
Working with the <strong>Hospital</strong>s:<br />
Pneumonia report:<br />
Comment Letters<br />
“We believe strongly that the Community-Acquired<br />
outcomes report does not reflect the reality <strong>of</strong> hospital<br />
quality care, nor the true risk <strong>of</strong> death following communityacquired<br />
pneumonia because <strong>of</strong> inaccuracies in data on<br />
the source <strong>of</strong> admission. “<br />
AHRQ Inpatient Mortality Indicators:<br />
“The data does not appear to be adjusted for multiple comorbid<br />
conditions that could contribute to death <strong>of</strong> an<br />
inpatient and does not account for a patient who has<br />
determined they do not want to be resuscitated if their<br />
condition deteriorates while in the hospital.
Improving <strong>Administrative</strong> <strong>Data</strong><br />
<strong>Administrative</strong> data are created for billing, not<br />
predicting mortality<br />
<strong>Administrative</strong> data is improved substantially with<br />
“Present-on-Admission” (POA) fields<br />
Reward hospitals for sicker patients, not for making<br />
them sick<br />
Important that hospitals code POA accurately<br />
In 2011, OSHPD will add laboratory values to the<br />
patient discharge data<br />
In combination with POA fields, hybrid dataset will<br />
come closer to the clinical data “gold standard”
<strong>Data</strong> Elements: Final List<br />
Lab Values<br />
AST<br />
Potassium<br />
Sodium<br />
pH<br />
PT/INR<br />
Albumin<br />
Creatinine<br />
BUN<br />
Platelets<br />
White Blood Cells<br />
Hematocrit/Hemoglobin<br />
Vital Signs<br />
Oxygen Saturation<br />
Pulse<br />
Blood Pressure<br />
Respiration Rate<br />
Temperature<br />
Operating Physician ID<br />
Patient Address<br />
Items in bold have been approved for the final list
Challenges<br />
Poor quality data can impact hospital ratings<br />
(validation is effective, but resource intensive)<br />
30-day mortality is a better measure than in-hospital<br />
mortality (hospital discharge practices may vary),<br />
but there is a delay in obtaining vital statistics data<br />
Risk-adjustment allows fair comparisons between<br />
hospitals, but the process can be time consuming<br />
Clinical consultation and literature review<br />
Risk-factor data validation<br />
Technical Advisory Committee consensus
Challenges, cont.<br />
How do we present statistical results?<br />
Consumers prefer simple reports<br />
Providers want to illustrate the uncertainty <strong>of</strong> the results<br />
Stakeholders have different perspectives<br />
Perfection is the enemy <strong>of</strong> the good<br />
Do not risk our reputation with unreliable or invalid<br />
reports
<strong>Hospital</strong> Ratings for Pneumonia<br />
Report
Questions?<br />
Contact Information<br />
Brian Paciotti, PhD<br />
Healthcare <strong>Outcomes</strong> Center<br />
Research Scientist<br />
916-326-3864<br />
bpaciott@oshpd.ca.gov<br />
www.oshpd.ca.gov
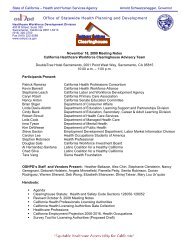
IQI 17: Stroke Mortality<br />
In-Hosp. Mortality: Risk-Adjusted State Rate = 10.4%<br />
Not significant 95% CI, Denominator < 30<br />
95% CI Statewide Risk-Adj. Rate<br />
Risk-Adjusted Mortality Rate%<br />
0 5101520253035<br />
50 100 150 200 250 300 350<br />
<strong>Hospital</strong> Number
Evaluating <strong>Hospital</strong> and Physician<br />
<strong>Outcomes</strong> Using Clinical <strong>Data</strong><br />
Presenter<br />
Joseph Parker, PhD
Clinical <strong>Data</strong> <strong>Outcomes</strong> <strong>Reports</strong><br />
Why use clinical registry data?<br />
Greater acceptance (face validity) by providers<br />
It is the language <strong>of</strong> treatment (not ICD codes)<br />
Used in hospital quality improvement activities<br />
Collected from clinical unit at hospitals<br />
Superior for risk modeling<br />
Viewed as essential for physician-level quality reporting<br />
What topics?<br />
Intensive Care <strong>Outcomes</strong><br />
Coronary Artery Bypass Graft Surgery (CABG)
Clinical <strong>Data</strong> <strong>Outcomes</strong> <strong>Reports</strong><br />
Intensive Care Unit (ICU) <strong>Outcomes</strong><br />
Voluntary program began 1999 – OSHPD contract with<br />
UCSF (33 hospitals)<br />
Studied feasibility <strong>of</strong> public reporting ICU mortality rates<br />
at California hospitals<br />
Participating hospitals collected extensive clinical data<br />
on a subset <strong>of</strong> their adult ICU patients<br />
Products:<br />
Feedback on data quality and processes <strong>of</strong> care to<br />
participants<br />
Risk-adjusted mortality rates calculated & shared<br />
Two reports with blinded hospital information<br />
<strong>Hospital</strong> ICU outcomes currently reported by California<br />
<strong>Hospital</strong> Assessment and Reporting Taskforce (CHART):<br />
Approx. 200 hospitals
Clinical <strong>Data</strong> <strong>Outcomes</strong> <strong>Reports</strong><br />
Coronary Artery Bypass Graft Surgery (CABG)<br />
<strong>Outcomes</strong> … and more<br />
Why CABG?<br />
CABG is one <strong>of</strong> the most expensive hospital surgeries<br />
In early 2000s ranked among the top 10 major procedures for<br />
volume and rate <strong>of</strong> mortality<br />
History <strong>of</strong> public reporting (New York, 1989)<br />
Key Dates<br />
Voluntary program – 1996 (1 st public report July, 2001)<br />
Legislation - 2001<br />
Mandatory program - 2003
California CABG Mortality<br />
Reporting Program (CCMRP)<br />
Voluntary statewide reporting system was established in 1996<br />
Public/private sector partnership between OSHPD and the<br />
Pacific Business Group on Health<br />
Based on Society <strong>of</strong> Thoracic Surgeons (STS) database<br />
Outcome measure: in-hospital mortality for isolated CABG<br />
Risk-adjustment for differences in patient case mix<br />
Three reports were produced: 1997-1998, 1999, 2000-2002
CCMRP: Limitations<br />
Voluntary participation (approx. 70% <strong>of</strong> hospitals)<br />
Lack <strong>of</strong> data on non-participants<br />
Relationship between participation status and outcomes<br />
<strong>Hospital</strong>s allowed to withdraw after seeing preliminary<br />
results<br />
Stakeholder Insistence on statewide reporting<br />
Consumer choice<br />
Healthcare purchasing (businesses, health plans)<br />
Quality improvement by physicians and hospitals
Legislation: Senate Bill 680 (2001)<br />
Created mandatory data reporting program,<br />
California CABG <strong>Outcomes</strong> Reporting Program<br />
(CCORP) for all California licensed hospitals that<br />
perform heart bypass surgery<br />
Risk-adjusted results to be reported by hospital (every<br />
year) and by surgeon (every two years)<br />
<strong>Hospital</strong> and surgeon review process<br />
Surgeon statement submission (appeals) process<br />
Created 9-member Clinical Advisory Panel (CAP)<br />
Periodic hospital data audits
Coronary CABG <strong>Outcomes</strong> Reporting Program<br />
(CCORP)<br />
First year <strong>of</strong> data collection 2003<br />
<strong>Data</strong> collected on ALL CABG surgeries, but<br />
performance reporting only on isolated CABG<br />
<strong>Hospital</strong> data certification by CEO/administrator or<br />
designee<br />
Surgeon certification upon data submission<br />
<strong>Hospital</strong> penalty for late filings<br />
<strong>Data</strong> quality activities
Ensuring <strong>Data</strong> Quality and Integrity<br />
<strong>Hospital</strong> data abstractor training<br />
Clinical consultation on coding issues<br />
Expert cardiologist, Clinical Panel, UC Davis Contract<br />
CCORP data collection tool provided free<br />
Automated data edits, quality comparison reports,<br />
and requests for supporting documentation<br />
Linkages to Patient Discharge <strong>Data</strong> and Death File<br />
Yearly hospital medical chart audits<br />
Surgeon “appeals” process
<strong>Hospital</strong> Medical Chart Audits<br />
Audit Sample<br />
Preliminary hospital and surgeon outliers<br />
Near hospital and surgeon outliers<br />
<strong>Hospital</strong>s with probable over-reporting or underreporting<br />
<strong>of</strong> risk factors<br />
<strong>Hospital</strong>s from a random pool<br />
Number <strong>of</strong> records proportional to hospital size<br />
All deaths and highest-risk patients<br />
Blinded on-site audits<br />
Detailed audit results provided to hospitals to<br />
improve coding<br />
Audit data replaces submitted data
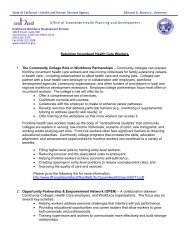
Subset <strong>of</strong> CCORP audit results<br />
Agreement Statistics Comparison <strong>of</strong> CCORP Audit <strong>Data</strong> from 2003 - 2006<br />
Audited <strong>Data</strong> Element<br />
Kappa/Pearson Correlation<br />
Percent Coded Correctly<br />
N 2003 2004 2005 2006 2003 2004 2005 2006<br />
Arrhythmia 952 0.517 0.541 0.568 0.603 85.95 89.14 90.65 91.50<br />
Arrhythmia Type 952 0.507 0.517 0.558 0.586 84.91 88.11 90.10 91.00<br />
Cardiogenic Shock 952 0.458 0.623 0.622 0.621 95.07 95.79 96.35 98.10<br />
Cerebrovascular<br />
Accident (CVA) 953 0.642 0.747 0.755 0.771 93.08 95.11 94.22 96.00<br />
Cerebrovascular<br />
Accident Timing 952 0.627 0.723 0.757 0.761 92.66 94.61 93.98 95.80<br />
Congestive Heart<br />
Failure (CHF) 954 0.554 0.551 0.595 0.563 83.23 82.11 84.47 85.90<br />
Dialysis 953 0.886 0.931 0.924 0.942 98.64 99.21 99.37 99.50<br />
Ejection Fraction (%) 927 0.880 0.870 0.881 0.884 51.57 49.43 52.22 51.00<br />
Hepatic Failure 953 0.398 0.174 -0.003 0.132 99.27 98.29 99.21 99.50
Preliminary Results<br />
<strong>Hospital</strong>s (60 day review)<br />
Preliminary risk-adjusted mortality rates for all hospitals<br />
Performance ratings – worse-, better-, or not differentthan<br />
state average<br />
Instructions on how to submit a comment letter for final<br />
report<br />
Surgeons (30 days to appeal)<br />
Preliminary risk-adjusted results for that surgeon<br />
Performance rating – worse-, better-, or not differentthan<br />
state average<br />
Instructions on how to appeal if “results do not<br />
accurately reflect the quality <strong>of</strong> care provided”
Surgeon “Appeal” Process<br />
Surgeons submit statements<br />
OSHPD reviews statements and agrees or disagrees<br />
with surgeon request<br />
Surgeons not satisfied with OSHPD decision may<br />
forward statement to Clinical Advisory Panel for review<br />
Panel will:<br />
Uphold the CCORP decision OR<br />
Reach one <strong>of</strong> the other conclusions set forth by the law<br />
Flaw in the risk model so report is flawed<br />
Flaw in surgeon data so corrections required<br />
Panel’s determination is final
2003-2004 Report<br />
31 Statements - 15 forwarded to Panel<br />
Panel did not agree with OSHPD on 8 cases, allowed<br />
resubmission <strong>of</strong> data for 6<br />
3 surgeons’ performance ratings changed as a result <strong>of</strong><br />
review process<br />
2005-2006 Report<br />
11 Statements – 5 forwarded to Panel<br />
Panel concurred with OSHPD on all but one statement<br />
Issues<br />
Surgeon Statement Process<br />
Assignment <strong>of</strong> responsibility<br />
Very high-risk patients (risk model inadequate)<br />
Non-isolated vs. isolated CABG procedure
CCORP <strong>Reports</strong><br />
•Three Three prior reports: 2003, 2003-2004, 2004, 2005
Risk Model<br />
Report Contents<br />
Risk-adjusted operative* mortality rates and<br />
performance ratings for hospitals and surgeons on<br />
isolated CABG surgeries<br />
Performance ratings – hospitals and surgeons rated<br />
as worse than, better than, or same as state average<br />
<strong>Hospital</strong> performance ratings for use <strong>of</strong> the Internal<br />
Mammary Artery (the preferred artery for bypass)<br />
Only low (poor) users given performance rating<br />
<strong>Hospital</strong>/Surgeon volume and outcomes associations<br />
<strong>Hospital</strong> comment letters<br />
* Operative mortality: death occurring in the hospital after surgery, regardless <strong>of</strong> length <strong>of</strong> stay, or death<br />
occurring anywhere after discharge, but within 30 days <strong>of</strong> CABG surgery
Impact <strong>of</strong> CABG Report<br />
<strong>Hospital</strong>s have instituted internal quality<br />
improvements<br />
Reported changes in hospital contracting/referrals<br />
Surgeons involved in the data quality review<br />
In-hospital and operative mortality rates have<br />
declined (36% decline in in-hospital mortality since<br />
start <strong>of</strong> mandatory program)<br />
UC Davis preliminary report on “Impact <strong>of</strong><br />
Mandatory Public Reporting”<br />
Marked and sustained drop in observed and risk-adjusted<br />
operative mortality<br />
Lower volume across hospitals and surgeons<br />
No detectable avoidance <strong>of</strong> high-risk patients
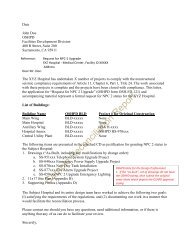
Volume <strong>of</strong> Isolated CABG, Non-Isolated CABG, and<br />
PCI Surgery in California 1997-2007<br />
70,000<br />
Isolated CABG Non‐ Isolated CABG PCI<br />
60,000<br />
50,000<br />
40,000<br />
48,661<br />
44,350<br />
50,526<br />
51,452<br />
54,522<br />
55,959<br />
59,167<br />
60,509 60,709 60,083<br />
54,268<br />
30,000<br />
20,000<br />
28,178<br />
27,986<br />
27,638 27,800<br />
25,899<br />
24,556<br />
21,414<br />
19,361<br />
17,164<br />
15,927 15,036<br />
10,000<br />
4,276<br />
4,583 4,595 4,622 4,611 4,489 4,391 4,259 4,142 4,024 3,856<br />
0<br />
1997 1998 1999 2000 2001 2002 2003 2004 2005 2006 2007
<strong>Hospital</strong> Volume and Related Statistics<br />
Over Time<br />
2003 2004 2005 2006 2007<br />
Total # CABG<br />
performing hospitals<br />
121 120 120 121<br />
121<br />
Mean isolated CABG<br />
volume<br />
176 159 141<br />
129<br />
122<br />
Mean non-isolated<br />
CABG volume<br />
37 38 37<br />
36<br />
35<br />
# hospitals < 100 cases 31 32 36<br />
# hospitals < 30 cases 3 5 6<br />
44<br />
9<br />
51<br />
8<br />
Lowest volume hospital 25 5 7 2<br />
1
In-<strong>Hospital</strong> Mortality Rates for Isolated, Non-Isolated<br />
CABG, and PCI Surgery in California 1997-2007<br />
Isolated CABG In‐hosp Mortality Rate<br />
12%<br />
Non‐Isolated CABG In‐hosp Mortality Rate<br />
PCI In‐hosp Mortality Rate<br />
10%<br />
9.66%<br />
9.45%<br />
9.28%<br />
8%<br />
8.55%<br />
8.28%<br />
8.51% 8.40%<br />
8.10% 7.99%<br />
6%<br />
6.88% 6.92%<br />
4%<br />
2%<br />
3.08%<br />
2.94%<br />
2.93% 2.84% 2.95%<br />
2.70%<br />
2.37%<br />
2.76%<br />
2.45%<br />
1.80% 1.90%<br />
1.70%<br />
1.60%<br />
1.54% 1.56% 1.57% 1.55% 1.46%<br />
1.64% 1.52%<br />
1.55% 1.75%<br />
0%<br />
1997 1998 1999 2000 2001 2002 2003 2004 2005 2006 2007
Unadjusted Isolated CABG Inpatient Mortality Rates<br />
3.5%<br />
for California and Other States (1996-2007)<br />
3.0%<br />
2.5%<br />
2.0%<br />
1.5%<br />
1.0%<br />
California New York Pennsylvania New Jersey Massachusetts<br />
1996 1997 1998 1999 2000 2001 2002 2003 2004 2005 2006 2007<br />
Note: rates may be defined slightly differently from state to state
What’s New<br />
2005-2006 <strong>Hospital</strong> and Surgeon Report release this<br />
week<br />
Reporting on new outcomes and patient groups<br />
<strong>Hospital</strong> post-operative stroke rates (in 2007 report)<br />
Non-isolated CABG mortality (future release)<br />
Online data reporting for hospitals<br />
2003-2005 CCORP researcher file available to<br />
qualified researchers<br />
Stand-alone patient-level CCORP data file<br />
Merged CCORP-Patient Discharge <strong>Data</strong> file
Questions<br />
Contact information:<br />
Holly Hoegh, PhD<br />
Healthcare <strong>Outcomes</strong> Center<br />
Manager, Clinical <strong>Data</strong> Programs<br />
(916) 323-3868<br />
hhoegh@oshpd.ca.gov<br />
www.oshpd.ca.gov<br />
OR<br />
Joseph Parker, PhD<br />
jparker@oshpd.ca.gov