2011 Bass Angler Information Team - Alabama Department of ...
2011 Bass Angler Information Team - Alabama Department of ...
2011 Bass Angler Information Team - Alabama Department of ...

Create successful ePaper yourself
Turn your PDF publications into a flip-book with our unique Google optimized e-Paper software.
<strong>2011</strong><br />
<strong>Bass</strong> <strong>Angler</strong> <strong>Information</strong> <strong>Team</strong><br />
Annual Report<br />
64 North Union Street, Suite 551, Montgomery, <strong>Alabama</strong> 36130
B.A.I.T.<br />
<strong>Bass</strong> <strong>Angler</strong>s <strong>Information</strong> <strong>Team</strong><br />
<strong>2011</strong><br />
Annual Report<br />
By<br />
Damon Lee Abernethy<br />
Fisheries Development Coordinator<br />
Division <strong>of</strong> Wildlife and Freshwater Fisheries<br />
<strong>Alabama</strong> <strong>Department</strong> <strong>of</strong> Conservation and Natural Resources<br />
Funded in part by the Federal Aid to Sport Fish Restoration Program<br />
<strong>Alabama</strong> DJ/WB Project F-38
FISHERIES SECTION OFFICES<br />
MONTGOMERY<br />
Stan Cook, Chief <strong>of</strong> Fisheries<br />
Nick Nichols, Asst. Chief <strong>of</strong> Fisheries<br />
Chris Greene, Asst. Chief <strong>of</strong> Fisheries<br />
Damon Abernethy, Fisheries Development<br />
(334) 242-3471<br />
DISTRICT I<br />
Pickwick, Wilson, Wheeler, Guntersville, the<br />
Bear Creek Lakes<br />
CONTENTS <strong>2011</strong> B.A.I.T. REPORT<br />
Statewide Club Tournament Results » p. 4-5, 12-25<br />
Results from nearly 400 tournaments held in <strong>Alabama</strong> during 2010<br />
Monthly Tournament Stats » p. 6, 12, 26-28<br />
Catches reported for all major reservoirs with at least 10 reports<br />
Standardized Electr<strong>of</strong>ishing Results » p. 7-11<br />
See the results <strong>of</strong> ADCNR’s bass population surveys<br />
Boating Access » p. 31<br />
Find out what’s going on in your area<br />
ADCNR Tournament Website » p. 30<br />
Find tournaments or post upcoming events for all 45 reservoirs in<br />
<strong>Alabama</strong><br />
ON THE INTERNET www.outdooralabama.com<br />
Reservoir Reports…<br />
www.outdooralabama.com/fishing/freshwater/where/reservoirs/<br />
B.A.I.T. Program…<br />
www.outdooralabama.com/fishing/freshwater/where/reservoirs/quality/<br />
Limits and Regulations…<br />
www.outdooralabama.com/fishing/freshwater/regulations/<br />
Boating Access…<br />
www.outdooralabama.com/boating/where/freshwater.cfm<br />
Tournament Listings…<br />
www.outdooralabama.com/tournaments/<br />
Keith Floyd, Supervisor<br />
Phil Ekema, Biologist<br />
21438 Harris Station Rd.<br />
Tanner, Ala. 35671<br />
(256) 353-2634<br />
DISTRICT II<br />
Weiss, Neely Henry, Logan Martin, Lay,<br />
Mitchell, Jordan, Harris, Martin, Yates,<br />
Thurlow, Jones Bluff<br />
Dan Catchings, Supervisor<br />
Michael Holley, Biologist<br />
Graves Lovell, Biologist<br />
Fish Hatchery Rd.<br />
P. O. Box 158<br />
Eastaboga, Ala. 36260<br />
(256) 831-6860<br />
DISTRICT III<br />
Aliceville, Gainesville, Smith, Bankhead, Holt,<br />
Oliver, Warrior, Demopolis, Tuscaloosa,<br />
Inland<br />
Jay Haffner, Supervisor<br />
Vacant, Biologist<br />
8211 McFarland Blvd.<br />
Northport, Ala. 35476<br />
(205) 339-5716<br />
DISTRICT IV<br />
West Point, Harding, Eufaula, Gantt, Point A,<br />
Frank Jackson<br />
Ken Weathers, Supervisor<br />
Rob Andress, Biologist<br />
3520 Plaza Dr.<br />
Enterprise Ala. 36331<br />
(334) 347-9467<br />
DISTRICT V<br />
Claiborne, C<strong>of</strong>feeville, Miller’s Ferry, Mobile<br />
Delta<br />
Dave Armstrong, Supervisor<br />
Tommy Purcell, Biologist<br />
30571 Five Rivers Blvd.<br />
P. O. Box 247<br />
Spanish Fort, Ala. 36527<br />
(251) 626-5153<br />
<strong>Alabama</strong> Wildlife & Freshwater Fisheries • Fisheries Section • 64 N. Union St., Montgomery, Ala. 36130 • (334) 242-3471
<strong>2011</strong> B.A.I.T. Summary<br />
<strong>Bass</strong> fishing in the State <strong>of</strong> <strong>Alabama</strong> has shown an overall trend <strong>of</strong> improvement during<br />
the past several years, and particularly during the previous four. However, during <strong>2011</strong>, this trend<br />
appeared to level <strong>of</strong>f with very similar numbers being reported, statewide. One exception was the<br />
length <strong>of</strong> time required to catch a bass larger than five pounds, which increased by over 40% in<br />
<strong>2011</strong>. Nevertheless, this figure equaled the 26 year statewide mean <strong>of</strong> 252 hours.<br />
The lake that has shown the most improvement in recent years is unquestionably Pickwick,<br />
which has shown drastic improvements since 2006. This reservoir had the highest percent<br />
success (97%) and accounted for nearly 50% <strong>of</strong> all bass over five pounds caught in <strong>Alabama</strong><br />
during <strong>2011</strong>. Of all bass over eight pounds caught in <strong>Alabama</strong> during <strong>2011</strong>, 86% <strong>of</strong> them came<br />
from Pickwick.<br />
<br />
<br />
<br />
<br />
Pickwick was the top lake in the overall quality indicator rankings<br />
Bankhead, Lay, Logan Martin, Mitchell, and Neely Henry moved into the upper 1/3 <strong>of</strong> the<br />
quality indicator rankings; Weiss Wilson, and the Mobile Delta improved also; while West<br />
Point, Jordan, Harris , and Harding moved up also, but remained in the bottom 1/3, statewide<br />
Pickwick, Bankhead, Lay, Logan Martin, and Mitchell were the top five lakes in the overall<br />
quality indicator rankings<br />
Guntersville, Pickwick, Lay, Eufaula, and West Point were the top five big bass lakes in<br />
<strong>Alabama</strong><br />
<strong>2011</strong> Statewide B.A.I.T. Statistics<br />
3.72 – Number <strong>of</strong> bass caught per angler-day<br />
7.54 – Pounds <strong>of</strong> bass caught per angler-day<br />
2.02 – Average weight <strong>of</strong> bass caught<br />
252 – Hours required to catch a 5 pound bass<br />
9.90 – Weight <strong>of</strong> the largest bass caught<br />
14 – Number <strong>of</strong> bass 8 pounds and larger<br />
291 – Number <strong>of</strong> bass 5 pounds and larger<br />
1
Introduction & Methods<br />
The printing <strong>of</strong> the <strong>2011</strong> B.A.I.T. Annual Report marks the<br />
twenty-sixth year <strong>of</strong> the B.A.I.T. Program. The objective <strong>of</strong> the program<br />
since its inception has been to gather information on bass populations<br />
by combining the efforts <strong>of</strong> bass club members and state fisheries<br />
biologists. The B.A.I.T. Program summarizes catch data on reservoir<br />
bass populations that are collected and provided to us by participating<br />
clubs. This information is used by state fisheries biologists in<br />
combination with data from other sources as a basis for fisheries<br />
management decisions. <strong>Bass</strong> anglers use the report to establish future<br />
tournament sites, or to locate a reservoir that provides a particular type<br />
<strong>of</strong> fishing.<br />
Through <strong>2011</strong>, we have summarized 12,505 tournament reports.<br />
<strong>Angler</strong>s have spent 2,740,985 hours collecting data for this program.<br />
They have contributed data from 670,104 bass that weighed 1,173,558<br />
pounds.<br />
This report also contains information related to the <strong>Alabama</strong><br />
Division <strong>of</strong> Wildlife & Freshwater Fisheries’ Boating Access<br />
Maintenance and Development Program which maintains nearly 120<br />
boating access areas statewide. The accomplishments made by this<br />
program during <strong>2011</strong> may be <strong>of</strong> particular interest to tournament bass<br />
anglers and their organizations. In addition, details <strong>of</strong> the <strong>Angler</strong><br />
Recognition Program administered by the <strong>Alabama</strong> Division <strong>of</strong> Wildlife<br />
& Freshwater Fisheries can be found here as well.<br />
Every year, we attempt to maintain the support <strong>of</strong> the previous<br />
year’s clubs and to enlist the support <strong>of</strong> new clubs through public<br />
meetings, news releases and letters. Participating club <strong>of</strong>ficers or<br />
tournament directors are sent the previous year’s annual report and<br />
tournament report postcards to be completed following each<br />
tournament. Clubs are assigned individual numbers to insure<br />
confidentiality. As tournament cards are received, they are checked<br />
for accuracy and entered into a computer database. Club <strong>of</strong>ficers are<br />
contacted when data are suspected to be erroneous. We compile and<br />
analyze the data following receipt <strong>of</strong> December tournament reports.<br />
Statewide tournament results are sorted by reservoir and by club.<br />
To rank reservoirs, five “fishing quality” indicators were used:<br />
percent <strong>of</strong> successful anglers (percent <strong>of</strong> anglers with one or more bass<br />
at weigh-in), average bass weight, number <strong>of</strong> bass per angler-day,<br />
pounds <strong>of</strong> bass per angler-day, and hours required to catch a bass five<br />
pounds or larger. Since the length <strong>of</strong> a fishing day varies between<br />
tournaments, an angler-day is defined as one angler fishing for ten<br />
hours. In this report, an angler-day may simply be referred to as a<br />
“day” <strong>of</strong> fishing. A minimum <strong>of</strong> five tournaments for an individual<br />
reservoir is considered necessary for minimum confidence in each<br />
reservoir dataset. Reservoirs with five or more tournament reports are<br />
ranked for each <strong>of</strong> the quality indicators. Values are assigned to each<br />
rank and an overall rank is determined for each reservoir by summing<br />
the values <strong>of</strong> the five quality indicators. This ranking system is intended<br />
to be a quick reference for club tournament site selection. It does not<br />
constitute a “best and worst” list <strong>of</strong> <strong>Alabama</strong> reservoirs and should not<br />
be interpreted that way.<br />
Tournament results were also broken down by month for each<br />
reservoir with 10 or more reports. This section was intended to aid<br />
clubs in scheduling tournaments since the quality <strong>of</strong> fishing can vary<br />
considerably from one season to the next on any given reservoir. It<br />
also allows anglers to better understand their chances <strong>of</strong> achieving a<br />
particular goal (i.e., catching a big bass) on a given lake by studying in<br />
detail how anglers performed during each month <strong>of</strong> the year. When<br />
studying this section <strong>of</strong> the report, be aware that some months are<br />
represented by only one tournament, which may not be a good<br />
indicator <strong>of</strong> the overall quality <strong>of</strong> fishing during that month.<br />
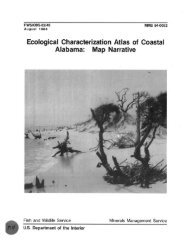
An impressive bag <strong>of</strong> spots from Holt Lake on the Black Warrior River.<br />
2
<strong>Alabama</strong>’s<br />
“Take a Kid Fishing”<br />
Distinctive License Plate<br />
Please take advantage <strong>of</strong> your<br />
opportunity to provide perpetual support<br />
for <strong>Alabama</strong>’s aquatic resources!<br />
The cost <strong>of</strong> these tags is $50 and they can be purchased wherever you have<br />
your tag renewed. Contact your county probate <strong>of</strong>fice or call the <strong>Alabama</strong><br />
Wildlife & Freshwater Fisheries Division at 334-242-3471 for more<br />
information.<br />
3
Statewide Tournament Results<br />
<strong>Bass</strong> clubs submitted 368 tournament reports during <strong>2011</strong>, down<br />
slightly from 387 in 2010 (Tables 1 and 3). Club representatives did an<br />
excellent job filling out the cards and few reports were rejected due to<br />
incomplete or erroneous information. We want to again, thank all <strong>of</strong> the<br />
participants <strong>of</strong> the B.A.I.T. Program and urge them to keep up the good<br />
work! Twenty-two <strong>Alabama</strong> clubs provided data in <strong>2011</strong>. One hundred<br />
Average catch rates in <strong>2011</strong> for both number (3.72) and pounds (7.54)<br />
<strong>of</strong> bass per angler-day slipped only slightly below the record numbers set<br />
the year before. Compared to 2010, 12 lakes improved in overall fishing<br />
success in <strong>2011</strong>. The most notable improvements were on Bankhead, Lay,<br />
and Logan Martin, which all moved into the top 5 in the overall rankings<br />
(Table 2). The average size bass caught on Bankhead and Lay increased by<br />
forty two reports from<br />
<strong>Alabama</strong> waters were<br />
received from Dr. Carl<br />
Quertermus <strong>of</strong> the<br />
University <strong>of</strong> West<br />
Georgia, who<br />
summarizes tournament<br />
data from the Georgia<br />
<strong>Bass</strong> Federation; and<br />
another 74 reports were<br />
received from Biologist<br />
Larry Pugh, with the<br />
Mississippi <strong>Department</strong> <strong>of</strong> Wildlife, Fisheries, and Parks. Without their<br />
support, several <strong>Alabama</strong> reservoirs would not have been well represented<br />
in the quality indicator rankings (Table 2). Once again, we must stress that<br />
reports from more locations increase the capability <strong>of</strong> the summaries to<br />
reflect actual fish population conditions and not just a good or poor day's<br />
fishing by one or two clubs.<br />
<strong>Alabama</strong>’s Top 10 Tournaments<br />
For Big <strong>Bass</strong> in <strong>2011</strong><br />
CLUB LAKE DATE No. >5lbs.<br />
Everstart Series Pickwick Jun. 9 th 9<br />
Everstart Series Pickwick Jun. 10 th 7<br />
<strong>Alabama</strong> BASS Federation Nation Eufaula Mar. 12 th 7<br />
BFL Pickwick Jun. 4 th 6<br />
FLW Tour Pickwick Jul. 22 nd 6<br />
FLW Tour Pickwick Jul. 21 st 6<br />
North <strong>Alabama</strong> Tournament <strong>Angler</strong>s Guntersville Feb. 12 th 6<br />
Morgan County <strong>Bass</strong> Club Guntersville Mar. 12 th 6<br />
National <strong>Bass</strong> Trail (GA/AL) Eufaula Jun. 15 th 6<br />
Peanut Craft Pickwick Apr. 23 rd 5<br />
12–13% compared to<br />
2010. Consequently,<br />
the number <strong>of</strong> pounds<br />
weighed-in per anglerday<br />
increased by 15-<br />
18%. The time<br />
required to catch a<br />
bass over five pounds<br />
on Bankhead has<br />
decreased by a<br />
whopping 55% since<br />
2010!<br />
Most tournament reports in <strong>2011</strong> were received from Pickwick (78), Eufaula<br />
(49), Guntersville (35), and Logan Martin (31). These four reservoirs<br />
accounted for 52% <strong>of</strong> the statewide tournament reports. Weiss, West Point,<br />
and Lay each had more than 15 reports (Table 1), which means that the<br />
other 29 reservoirs contributed only 33% <strong>of</strong> the annual total for <strong>2011</strong>. A<br />
good distribution <strong>of</strong> reports provides more representative catch statistics<br />
In <strong>2011</strong>,<br />
tournament reports<br />
were received from 29<br />
bodies <strong>of</strong> water that<br />
were fished 74,439<br />
hours. B.A.I.T. anglers<br />
caught 27,386 bass that<br />
weighed 56,134 pounds<br />
(Table 1). A total <strong>of</strong> 291<br />
bass five pounds and<br />
larger were reported for<br />
an overall catch rate <strong>of</strong><br />
<strong>Alabama</strong>’s Top 10 Tournaments<br />
For Average 5-Fish Weight in <strong>2011</strong><br />
CLUB LAKE DATE WEIGHT<br />
Carroll County (Ga.) <strong>Bass</strong> Masters Guntersville May 14 th 20.37 lbs.<br />
Macon (Ga.) <strong>Bass</strong> Club Eufaula Apr. 16 th 16.57 lbs.<br />
Tenn-Tom <strong>Bass</strong>in Pickwick Jul. 16 th 15.94 lbs.<br />
Peanut Craft Pickwick Apr. 23 rd 15.87 lbs.<br />
<strong>Team</strong> Trails <strong>of</strong> Mississippi Pickwick Feb. 26 th 15.50 lbs.<br />
Peanut Craft Pickwick May 7 th 15.49 lbs.<br />
26 <strong>Bass</strong>masters West Point Oct. 8 th 15.41 lbs.<br />
Conasauga (Ga.) <strong>Bass</strong>masters Wheeler May 15 th 14.83 lbs.<br />
FLW Tour Pickwick Jul. 23 rd 14.78 lbs.<br />
Everstart Series Pickwick Jun. 11 th 14.68 lbs.<br />
from which<br />
meaningful<br />
summaries can be<br />
prepared. All club<br />
representatives<br />
should understand<br />
that every report is<br />
important to the<br />
continued success <strong>of</strong><br />
the B.A.I.T Program.<br />
Of the 29<br />
reservoirs from<br />
one bass five pounds or larger for every 252 hours <strong>of</strong> fishing. Tournament<br />
anglers weighed in 14 bass eight pounds and larger in <strong>2011</strong>. The largest<br />
bass caught in <strong>2011</strong> came from Pickwick Lake and weighed 9.90 pounds.<br />
With 141 bass weighing five pounds or larger, Pickwick led this category.<br />
Other top lakes for big bass included Guntersville and Eufaula.<br />
Of the 24 organizations that submitted data during <strong>2011</strong>, only 75%<br />
submitted five or more tournament reports, and 33% submitted 10 or more<br />
reports. Three contributors submitted only one report. A list <strong>of</strong> contributing<br />
clubs for the <strong>2011</strong> B.A.I.T. Report is presented in Table 4.<br />
which reports were received, 19 had five or more tournament reports (Table<br />
1). The following comments deal with these reservoirs, which are ranked by<br />
quality indicators in Table 2. The percent <strong>of</strong> successful anglers (those with<br />
one or more fish) ranged from 70% at Harding to 97% at Pickwick. The<br />
average weight <strong>of</strong> bass caught ranged from 1.34 pounds at Harris to 2.77<br />
pounds at Guntersville (Table 1). Catch rates expressed as bass per anglerday<br />
ranged from 2.18 at Harding to 5.03 at Bankhead. Catch rates as<br />
pounds per angler-day ranged from 2.99 at Harding to 10.41 at Pickwick.<br />
The statewide average weight for bass caught on all 29 reservoirs was 2.02<br />
pounds.<br />
4
Statewide Tournament Results<br />
Overall, Pickwick accumulated more quality indicator points (92) than<br />
any other reservoir in <strong>Alabama</strong>, nearly doubling its 2010 margin over second<br />
place. Bankhead (76), Lay (73), Logan Martin (60), and Mitchell (60)<br />
rounded out the top five.<br />
Readers should note that the primary intent <strong>of</strong> Table 2 is not to<br />
determine the overall “best” reservoir, but to characterize the fishery <strong>of</strong><br />
each reservoir. <strong>Angler</strong>s should first review the quality indicator that is most<br />
important to them. The overall rating would be used to narrow choices. For<br />
example, if an angler wanted to have the best chance to catch a bass<br />
greater than 5 pounds, then Guntersville or Pickwick would be the place to<br />
go. Clubs interested in having all its members catch good quality stringers<br />
would look at the pounds per angler-day rankings to find that Pickwick, and<br />
Bankhead <strong>of</strong>fer the best opportunity. If catching lots <strong>of</strong> bass is important,<br />
then Pickwick or Bankhead might be the best destination based upon their<br />
bass per angler-day rankings.<br />
<strong>Bass</strong> data, as expressed in the B.A.I.T. report from reservoirs with<br />
harvest restrictions or length limits, will be biased since the data is a function<br />
<strong>of</strong> the restrictions. Length limits are imposed to increase the number <strong>of</strong> fish<br />
below a minimum length or within a specified length range (slot limit) which<br />
should eventually result in a greater supply <strong>of</strong> bass above the limit. Because<br />
all minimum lengths and length ranges will be above the 12-inch limit selfimposed<br />
by most tournaments, the restrictions will reduce the total harvest in<br />
numbers and possibly pounds. However, those fish weighed in will be larger<br />
(longer) by virtue <strong>of</strong> the minimum length (MLL) or slot limit. In the B.A.I.T.<br />
Report, length limit lakes should rank high for average weight and near the<br />
bottom for percent success and bass per angler-day. For instance, bass per<br />
angler-day averaged 3.72 statewide in <strong>2011</strong>; but for Guntersville and<br />
Eufaula, each averaged 2.57. Statewide average weight was 2.02 pounds<br />
for all reservoirs combined; but Guntersville with its 15-in. MLL averaged<br />
2.77 pounds. These average weights were higher primarily because anglers<br />
must release the smaller fish due to the minimum length limits. Length limits<br />
remained in effect during <strong>2011</strong> on West Point (14-inch MLL on largemouth),<br />
Wilson (14-inch MLL on smallmouth), Guntersville (15-inch MLL on<br />
largemouth and smallmouth), Eufaula (14-inch MLL on largemouth),<br />
Demopolis (14-inch MLL on all black bass), Pickwick<br />
(14-inch MLL on smallmouth), Little Bear Creek (13- to 16-inch slot on<br />
largemouth), Smith (13- to 15-inch slot on all black bass), and Harris (13- to<br />
16-inch slot on largemouth).<br />
<strong>Bass</strong> fishing in <strong>Alabama</strong> has been excellent in recent years, with <strong>2011</strong><br />
generally scoring near the top since the <strong>Alabama</strong> Division <strong>of</strong> Wildlife &<br />
Freshwater Fisheries began keeping records in 1986. For <strong>Alabama</strong>’s bass<br />
fishermen, <strong>2011</strong> was among one <strong>of</strong> the best years reported during any <strong>of</strong><br />
the previous 26 years <strong>of</strong> B.A.I.T. reporting. In general, the <strong>2011</strong> numbers<br />
slipped only slightly below the record setting year <strong>of</strong> 2010; however, the<br />
number <strong>of</strong> bass over five pounds decreased considerably.<br />
The average number <strong>of</strong> hours (effort) needed to catch a bass larger<br />
than five-pounds dramatically increased beginning in 1998 due to the<br />
presence <strong>of</strong> the Largemouth <strong>Bass</strong> Virus (LMBV), and reached its peak <strong>of</strong><br />
837 hours the following year. From 1999 through 2010, the amount <strong>of</strong> effort<br />
required to catch a bass over five pounds decreased by 82%; however, in<br />
<strong>2011</strong> the time required to catch a bass over five pounds was 41% higher<br />
than the previous year, and equal to the 26 year average (Figure 1).<br />
Although there have been no recent outbreaks <strong>of</strong> LMBV, there are<br />
indications that this disease may be impacting our bass fisheries by<br />
elevating natural mortality rates; so, please report any unusual bass die-<strong>of</strong>fs<br />
to your district fisheries <strong>of</strong>fice, and never move fish from one lake to another.<br />
The graphs throughout this report provide a historical record <strong>of</strong> how<br />
your favorite waters have performed in the B.A.I.T. Program. A few words <strong>of</strong><br />
caution - these graphs are not restricted to bodies <strong>of</strong> water with five or more<br />
tournaments. Data points for some years may be represented by only a few<br />
tournaments. However, those situations are restricted to those water bodies<br />
that have not been included in the quality indicator rankings in Table 2. You<br />
can use these graphs to predict future fishing by looking for trends.<br />
Good luck fishing, and don’t forget to take a child with you and<br />
introduce him or her to your sport. Our children are our future anglers and<br />
stewards <strong>of</strong> <strong>Alabama</strong>’s resources.<br />
<strong>Bass</strong> Over Eight Pounds from <strong>2011</strong> B.A.I.T. Reports<br />
Date Organization Lake Weight___<br />
Feb. 26 <strong>Team</strong> Trails <strong>of</strong> Mississippi Pickwick 9.60 lbs.<br />
Mar. 5 Peanut Craft Pickwick 9.90 lbs.<br />
Mar. 12 Tifton <strong>Bass</strong> Busters Eufaula 8.37 lbs.<br />
Mar. 27 Memphis <strong>Bass</strong> Association Pickwick 9.31 lbs.<br />
Apr. 2 Peanut Craft Pickwick 9.28 lbs.<br />
Apr. 16 Lowndes County <strong>Bass</strong>masters Eufaula 8.02 lbs.<br />
Apr. 23 Peanut Craft Pickwick 8.88 lbs.<br />
May 21 Fishers <strong>of</strong> Men Pickwick 8.19 lbs.<br />
May 21 Peanut Craft Pickwick 8.02 lbs.<br />
Jun. 4 BFL Pickwick 8.81 lbs.<br />
Jun. 10 Everstart Pickwick 8.13 lbs.<br />
Jul. 2 Peanut Craft Pickwick 8.02 lbs.<br />
Jul. 16 Tenn-Tom <strong>Bass</strong>in’ Pickwick 9.27 lbs.<br />
Jul. 22 FLW Tour Pickwick 8.69 lbs.<br />
5
Monthly Tournament Stats<br />
In this section, reservoirs with at least 20 reports are discussed in<br />
detail and <strong>of</strong>ten refer to the monthly tournament results listed in Table 6.<br />
This table provides monthly catch information for all reservoirs with at<br />
least 10 reports.<br />
Eufaula<br />
Forty nine (49) tournaments were reported during each month<br />
except September. The majority occurred during March (10) and May<br />
(10). Eight hundred seventy six (876) anglers fished for 9,438 hours to<br />
catch 2,436 bass that weighed 4,781 pounds, with an average size <strong>of</strong><br />
1.96 pounds.<br />
Catch-rates declined by 20 % from the previous year, but remained<br />
well above the historical average for this reservoir. The average sized<br />
bass dropped below two pounds for the first time since 1991, but the<br />
percent <strong>of</strong> anglers catching at least one fish remained high, decreasing<br />
by only 5 % from the previous year.<br />
The most notable change was the decline in bass larger than five<br />
pounds. The number <strong>of</strong> hours required to catch a bass <strong>of</strong> this size had<br />
shown steady improvement from 2007 (343 hours) to 2010 (85 hours);<br />
however, in <strong>2011</strong>, it took anglers almost three times as long to catch a<br />
bass over five pounds than it had during the previous year. Nonetheless,<br />
this value was similar to the long-term average for this reservoir.<br />
Guntersville<br />
Thirty five tournaments were reported during each month from<br />
February through November, but most tournaments occurred in February<br />
(8) and March (8). Seven hundred twenty six anglers fished for 7,002<br />
hours to catch 1,800 bass that weighed 4,989 pounds, with an average<br />
size <strong>of</strong> 2 lb. 12 oz. All quality indicators declined from 2010 to <strong>2011</strong>, but<br />
remained above the 26-year average for the lake.<br />
Overall, catch-rates fell slightly from 2010, but remained well<br />
above the long-term average for this reservoir. The fishery at<br />
Guntersville was dominated by largemouth bass (92 %) and no<br />
smallmouth bass were reported, although they do exist in the reservoir.<br />
Catch-rates from February through June were considerably higher than<br />
during the rest <strong>of</strong> the year. Twenty-four percent <strong>of</strong> anglers weighed in<br />
limits during <strong>2011</strong>, as opposed to 37 % in 2010.<br />
The number <strong>of</strong> hours required to catch a bass larger than five<br />
pounds (152 hrs.) was almost three times greater than a year ago;<br />
however, it was still much better than the long-term average for the lake<br />
(191 hrs.). Average bass weight declined by only 3 % from the previous<br />
year, indicating there are still good numbers <strong>of</strong> quality fish in the lake.<br />
Excellent fishing and several elite bass tournaments have brought<br />
national attention to the quality <strong>of</strong> this bass fishery. The past several<br />
years have <strong>of</strong>fered some <strong>of</strong> the best bass fishing in the 70 year history <strong>of</strong><br />
this reservoir and have attracted anglers from across the country.<br />
Logan Martin<br />
Thirty one tournaments were reported during <strong>2011</strong>, with the<br />
majority being held during the months <strong>of</strong> May (6), September (6), and<br />
October (5). Five hundred seven anglers fished for 4,538 hours to catch<br />
1,986 bass that weighed 3,240 pounds, with an average size <strong>of</strong> 1 lb. 10<br />
oz.<br />
Catch-rates were similar to 2010 and well above the 26 year average for<br />
this reservoir. The fishery at Logan Martin was dominated by spotted<br />
bass (74 %), but a quality largemouth bass fishery also exists there.<br />
The catch frequency for bass over five pounds (908 hrs.) was similar to<br />
the previous year (845 hrs.), but three times lower than the long-term<br />
average for the lake (297 hrs.). Catches <strong>of</strong> bass over five pounds from<br />
this reservoir have been quite variable over time ranging from 76 hours<br />
in 1991, to 1,444 hours in 2004.<br />
The number <strong>of</strong> bass caught per angler-day (4.38) and the number<br />
<strong>of</strong> pounds per angler-day (7.14) were both nearly identical to 2010.<br />
Average big bass weight in <strong>2011</strong> tournaments was 3 lbs. 13 oz.; the<br />
second lowest <strong>of</strong> all Coosa River impoundments.<br />
Pickwick<br />
Seventy eight (78) tournaments occurred between January and<br />
October <strong>of</strong> <strong>2011</strong>. The peak month was July (12 tournaments), but at<br />
least ten (10) tournaments were held during each month from March<br />
through August.<br />
Two thousand five hundred eighty five (2,585) anglers fished for<br />
23,761 hours to catch 10,250 bass that weighed 24,744 pounds, with an<br />
average size <strong>of</strong> 2 lb. 5 oz. The percent success increased to 97% in<br />
<strong>2011</strong>, and more than 65% <strong>of</strong> anglers weighed in a limit <strong>of</strong> five (5) fish.<br />
Only two (2) lakes had a higher percentage <strong>of</strong> limits weighed in by<br />
tournament anglers. The ratio <strong>of</strong> largemouths to smallmouths was 4:1.<br />
The hours required for an angler to catch a bass larger than five<br />
(5) pounds was slightly lower than the previous year (161 hours), but the<br />
time required to catch a bass over 8 pounds fell drastically from 6,423<br />
hours in 2010 to just 1,892 hours in <strong>2011</strong>! That’s a 70% reduction, which<br />
was good news for the Pickwick trophy hunters.<br />
Weiss<br />
Twenty tournaments were reported during each month from May<br />
through November, but the majority <strong>of</strong> tournaments occurred in June (8).<br />
Three hundred twelve anglers fished for 2,831 hours to catch 1,059 bass<br />
that weighed 1,742 pounds, with an average size <strong>of</strong> 1 lb. 10 oz.<br />
Catch-rates increased slightly, and remained well above the 25-yr.<br />
average for this reservoir. The fishery at Weiss shifted more towards<br />
largemouth bass from 2010 to <strong>2011</strong>. This year largemouth bass made<br />
up 61 % or the catches, as opposed to 51 % the previous year.<br />
The catch frequency <strong>of</strong> bass over five pounds (283 hrs.) dropped<br />
by 17 % from 2010, but remained similar to the 26 year average. The<br />
number <strong>of</strong> bass caught per angler-day (3.74) increased slightly, but the<br />
number <strong>of</strong> pounds per angler-day (6.15 pounds) decreased because<br />
average fish size was down 12 %.<br />
6
Standardized Electr<strong>of</strong>ishing Results<br />
The <strong>Alabama</strong> Division <strong>of</strong> Wildlife & Freshwater Fisheries manages<br />
45 public reservoirs through five District Offices. Inside the front cover <strong>of</strong><br />
this publication, each District Office is listed along with the reservoirs within<br />
their area <strong>of</strong> responsibility. Each reservoir is sampled on a routine basis to<br />
monitor the population structure <strong>of</strong> its sport fish species. These samples<br />
are conducted in a standardized manner according to the guidelines <strong>of</strong> the<br />
<strong>Alabama</strong> Reservoir Management Manual so that changes in population<br />
characteristics can be monitored over time. Most reservoirs are sampled<br />
on a three year cycle and management recommendations, such as length<br />
and bag limits, are determined from this research. There are three key<br />
components <strong>of</strong> the fish population that biologists must characterize in order<br />
to make these decisions; they are growth, mortality, and recruitment.<br />
Another important non-biological element is bass harvest rates, which is<br />
determined through the use <strong>of</strong> angler creel surveys.<br />
These four variables ultimately determine the quality <strong>of</strong> each fishery,<br />
but all <strong>of</strong> them are limited by the nutrient levels in each reservoir. Even<br />
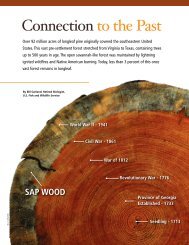
<strong>Alabama</strong> Wildlife & Freshwater Fisheries biologists conduct a standardized<br />
electr<strong>of</strong>ishing sample at Lake Jordan on the Coosa River.<br />
Complex statistical models are developed from these variables that<br />
are used to predict how fish populations might respond to changes in the<br />
length or bag limits imposed on each reservoir. Over time, these model’s<br />
predictive ability can be validated by comparing the predicted effects to the<br />
actual fishery responses to the changes in harvest restrictions. In general,<br />
harvest restrictions have miniscule impacts unless the rate <strong>of</strong> fishing<br />
mortality approaches or exceeds that <strong>of</strong> natural mortality because there is<br />
little biological justification for protecting fish that are dying primarily <strong>of</strong><br />
natural causes. Since bass harvest in <strong>Alabama</strong> is generally very low, few<br />
reservoirs have restrictive length limits at this time. However, routine<br />
monitoring <strong>of</strong> bass populations will allow changes in harvest restrictions to<br />
be made whenever necessary.<br />
<strong>Bass</strong> are measured and weighed so that biologists can determine the<br />
size structure <strong>of</strong> the population, growth rates, and relative condition.<br />
with good management, reservoirs with low fertility or poor water quality<br />
do not have the potential to produce outstanding fisheries. Depending on<br />
the results <strong>of</strong> these investigations, some management objectives may<br />
include the reduction <strong>of</strong> small bass through the use <strong>of</strong> slot limits, or<br />
increasing the number <strong>of</strong> larger fish using minimum length limits, which can<br />
also reduce the effects <strong>of</strong> variable recruitment.<br />
A careful review <strong>of</strong> the information in this section reveals certain<br />
fishery trends that are reflected in the tournament reporting data. For<br />
example, reservoirs that consistently produce good numbers <strong>of</strong> trophy<br />
bass are usually those with populations that exhibit low annual mortality<br />
and rapid growth. Conversely, lakes that rarely produce trophy bass are<br />
<strong>of</strong>ten characterized by slow growth and high annual mortality.<br />
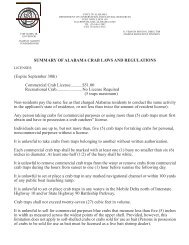
Cross-section <strong>of</strong> an otolith from a 16 year old largemouth bass. Dark<br />
bands are formed in winter when cold temperatures reduce growth.<br />
7
Standardized Electr<strong>of</strong>ishing Results<br />
Growth<br />
One <strong>of</strong> the three most important objectives <strong>of</strong> fisheries biologist’s<br />
assessment <strong>of</strong> a fish population is to determine the growth-rates for the<br />
fish being studied. There are many factors that can affect the rate at which<br />
fish grow. The most important are prey abundance, size, and nutritional<br />
value; and <strong>of</strong> course, the number <strong>of</strong> other fish competing with them for<br />
those food resources. Other factors include the age and health <strong>of</strong> the fish,<br />
water temperature, and water quality. Obviously, these variables do not<br />
remain constant over time, so the assessment represents a snapshot in<br />
time and can vary depending upon when the samples were obtained.<br />
Biologist’s determine fish’s growth-rates by measuring their lengths<br />
at each age represented in the sample. This is done by examining the<br />
fish’s otoliths, which are free-floating bones in the inner ear that form<br />
growth-rings similar to those that are visible on the top <strong>of</strong> a tree stump.<br />
These rings are formed because calcium is deposited at a constant rate no<br />
matter how fast the fish is growing. During winter, when the fish is not<br />
actively growing, the calcium is deposited in a more concentrated area,<br />
and leaves behind a ring once the fish’s growth-rate increase as water<br />
temperatures become warmer. Using this technique, biologist’s can easily<br />
determine the amount <strong>of</strong> annual growth since birth, or between two given<br />
years.<br />
In <strong>Alabama</strong>, largemouth bass rarely exceed 10 years <strong>of</strong> age, and<br />
relatively few <strong>of</strong> the fish in these samples include fish greater than 5 years<br />
old. In warmer climates, bass grow faster but do not live as long as fish in<br />
colder climates. Additionally, a biologist’s ability to impact the size<br />
structure <strong>of</strong> a fish population through the use <strong>of</strong> length limits is most easily<br />
measured by examining the population characteristics <strong>of</strong> fish that are<br />
about to enter the fishery (i.e. those fish becoming available for harvest).<br />
Given all <strong>of</strong> these factors, a good benchmark for the growth-rates <strong>of</strong> most<br />
Southeastern bass populations is the average length <strong>of</strong> bass at three<br />
years <strong>of</strong> age, which is usually 12 -14 inches. The bar chart below<br />
illustrates the results <strong>of</strong> these studies on the reservoirs that were sampled<br />
by Wildlife & Freshwater Fisheries biologists during Spring <strong>2011</strong>.<br />
In order to make good management decisions, growth-rates <strong>of</strong> bass<br />
populations are classified as slow, moderate, or fast. However, it should<br />
be noted that growth-rates are only one piece <strong>of</strong> the fish production puzzle<br />
and must be complimented by other desirable population characteristics in<br />
order to produce high quality fisheries.<br />
Total Length <strong>of</strong> Largemouth <strong>Bass</strong> at Three Years <strong>of</strong> Age<br />
SLOW<br />
GROWTH<br />
MODERATE<br />
GROWTH<br />
FAST<br />
GROWTH<br />
Demopolis<br />
Eufaula<br />
Guntersville<br />
Inland<br />
Lay<br />
Logan Martin<br />
Martin<br />
Miller's Ferry<br />
Mitchell<br />
Mobile Delta<br />
Point A<br />
Wheeler<br />
11.5 12.0 12.5 13.0 13.5 14.0 14.5 15.0<br />
Total Length (Inches)<br />
8
Standardized Electr<strong>of</strong>ishing Results<br />
Mortality<br />
The second <strong>of</strong> the three most important objectives in fishery<br />
assessments is to determine the mortality rate for the population. Mortality<br />
is the death <strong>of</strong> fish, which can be caused by a wide range <strong>of</strong> things that<br />
include both natural causes, and fishing-related causes. In this section, it<br />
is total annual mortality that will be discussed; however, separating natural<br />
mortality from fishing mortality is an important step in good fisheries<br />
management. Determining the fishing-related component <strong>of</strong> mortality is<br />
the most important, and most difficult, task that a fisheries biologist faces.<br />
Documenting the number and size <strong>of</strong> fish being harvested by anglers is<br />
relatively easy to do using angler interviews, but understanding how many<br />
fish die following tournaments or catch-and-release is a much more difficult<br />
task.<br />
The most common way that biologist’s determine the mortality rate<br />
<strong>of</strong> a fish population is to measure the rate <strong>of</strong> decline in the number <strong>of</strong> fish<br />
represented in each age group in the collection. For example, from a<br />
collection <strong>of</strong> fish with a mortality rate <strong>of</strong> 50%, you might expect to see a<br />
decline similar to this: Age-1 (100 fish), Age-2 (50 fish), Age-3 (25 fish),<br />
Age-4 (13 fish), Age-5 (6 fish), Age-6 (3 fish), Age-7 (2 fish), Age-8 (1 fish).<br />
In <strong>Alabama</strong>, typical annual mortality-rates for largemouth bass range<br />
from 35% to 45%, but can vary considerably from one year to the next.<br />
Only a small percentage <strong>of</strong> bass in <strong>Alabama</strong> populations live to exceed 10<br />
years <strong>of</strong> age. Typically, less than 1% <strong>of</strong> bass collected in a standardized<br />
reservoir sample will exceed 10 years <strong>of</strong> age. Even in populations with<br />
very low mortality-rates, this figure is usually less than 3%.<br />
Minimum length limits are a management tool <strong>of</strong>ten considered by<br />
biologists if mortality-rates are high; however, they are only effective if a<br />
large portion <strong>of</strong> the total annual mortality can be attributed to fishingrelated<br />
causes. Limiting angler harvest cannot reduce bass mortality from<br />
natural causes.<br />
The chart below reflects the total annual mortality rates <strong>of</strong><br />
largemouth bass populations sampled during Spring <strong>2011</strong>. Biologists’ use<br />
this information to help guide them to make management decisions in an<br />
effort to improve the quality <strong>of</strong> fishing. A reduction in mortality-rates<br />
following the enforcement <strong>of</strong> a length limit is an indication that this<br />
management action has had a positive influence on the population.<br />
Obviously, if fishing-related mortality is low, then length limits will do little to<br />
improve the quality <strong>of</strong> a fishery.<br />
Total Percent <strong>of</strong> the Largemouth <strong>Bass</strong> Population<br />
That Die Annually<br />
LOW<br />
MORTALITY<br />
MODERATE<br />
MORTALITY<br />
HIGH<br />
MORTALITY<br />
Demopolis<br />
Eufaula<br />
Guntersville<br />
Inland<br />
Lay<br />
Logan Martin<br />
Martin<br />
Miller's Ferry<br />
Mitchell<br />
Mobile Delta<br />
Point A<br />
Wheeler<br />
10 20 30 40 50 60 70<br />
Annual Mortality (%)<br />
9
Standardized Electr<strong>of</strong>ishing Results<br />
Recruitment<br />
The final critical objective in fishery assessments is to determine<br />
recruitment <strong>of</strong> the population into the fishery. This is generally defined in<br />
two ways: 1) the number <strong>of</strong> fish surviving to reach one year <strong>of</strong> age, or 2)<br />
the number <strong>of</strong> fish surviving to reach harvestable size. The first is<br />
important because fish that do not reach 3 to 3 ½ inches before their first<br />
winter are less likely to survive to the following spring. The second is<br />
important because it is a measure <strong>of</strong> the percentage <strong>of</strong> fish that reach<br />
sizes large enough to be caught or harvested by anglers. Recruitment can<br />
be impacted by density-dependent and/or density-independent factors.<br />
Density-dependent factors include population size, fish size and growth<br />
characteristics, reproductive fertility, cannibalism, disease, predation, and<br />
competition for food. Density-independent factors are non-biological in<br />
nature and may include floods, droughts, temperature extremes, excessive<br />
wind, and pollution.<br />
Obviously, all <strong>of</strong> these factors can influence one another and may<br />
vary considerably over time. Although it is the biological and<br />
environmental interactions that have the greatest impact, exploitation (fish<br />
removed from the population by angling) can also influence the recruitment<br />
potential <strong>of</strong> a population.<br />
Number <strong>of</strong> One Year Old Largemouth <strong>Bass</strong> Caught<br />
Per Hour <strong>of</strong> Electr<strong>of</strong>ishing<br />
LOW<br />
RECRUITMENT<br />
MODERATE<br />
RECRUITMENT<br />
HIGH<br />
RECRUITMENT<br />
Demopolis<br />
Eufaula<br />
Guntersville<br />
Inland<br />
Lay<br />
Logan Martin<br />
Martin<br />
Miller's Ferry<br />
Mitchell<br />
Mobile Delta<br />
Point A<br />
Wheeler<br />
0 10 20 30 40<br />
Catch Per Hour <strong>of</strong> Electr<strong>of</strong>ishing<br />
10
Standardized Electr<strong>of</strong>ishing Results<br />
Abundance<br />
Another important population variable is the abundance <strong>of</strong> catchable<br />
sized fish in the population. Actual abundance is determined by a wide<br />
range <strong>of</strong> things, which may include survival during critical phases <strong>of</strong> life,<br />
habitat suitability, water quality, fertility, water productivity, competition with<br />
other fish, predation, or disease. However, it is also important to<br />
remember that a biologist’s assessment <strong>of</strong> overall abundance is<br />
determined from electr<strong>of</strong>ishing samples that are a snapshot in time and<br />
may be influenced by temporary environmental conditions during the<br />
sample period. Muddy water can prevent a biologist from seeing fish<br />
beneath the surface while electr<strong>of</strong>ishing, cold fronts may cause fish to<br />
move away from the shoreline, aquatic weeds can hinder their ability to<br />
see or capture fish that would ordinarily be collected, fish may be deeper<br />
than the reach <strong>of</strong> the electrical field in extremely clear water, etc. All <strong>of</strong><br />
these things have the potential to bias estimates <strong>of</strong> abundance.<br />
The number <strong>of</strong> 8-12 inch fish collected per hour <strong>of</strong> electr<strong>of</strong>ishing is a<br />
general indicator <strong>of</strong> overall population abundance. In <strong>Alabama</strong>, the<br />
majority <strong>of</strong> samples, statewide, fall within the 11 – 26 fish per hour range.<br />
The chart below illustrates these values for samples conducted on public<br />
reservoirs during Spring <strong>2011</strong> survey efforts.<br />
Number <strong>of</strong> 8 - 12 Inch Largemouth <strong>Bass</strong> Caught by Electr<strong>of</strong>ishing<br />
LOW<br />
DENSITY<br />
MODERATE<br />
DENSITY<br />
HIGH<br />
DENSITY<br />
Demopolis<br />
Eufaula<br />
Guntersville<br />
Inland<br />
Lay<br />
Logan Martin<br />
Martin<br />
Miller's Ferry<br />
Mitchell<br />
Mobile Delta<br />
Point A<br />
Wheeler<br />
0 10 20 30 40 70 80<br />
Catch Per Hour <strong>of</strong> Electr<strong>of</strong>ishing<br />
11
Aliceville 5 64 94.7 c 50.9 c 544 171 b 100.0 c 0.0 c 0.0 c 96 c 344 1.61 c 0 c 0 c 3.86 c 94.74 c 3.80 c 6.33 . .<br />
Bankhead 5 106 96.2 80.2 904 455 12.9 c 87.1 c 0.0 c 94 c 780 1.71 2 0 4.75 96.23 5.03 8.63 452 45<br />
Big Creek 1 12 83.3 16.7 120 31 100.0 0.0 0.0 . 37 1.18 0 0 1.84 83.33 2.58 3.05 . .<br />
C<strong>of</strong>feeville 2 13 69.2 38.5 104 59 . . . 97 81 1.37 0 0 4.58 69.23 5.67 7.75 . .<br />
Demopolis 4 139 84.2 33.8 1195 404 90.6 c 9.4 c 0.0 c 96 887 2.19 4 0 5.06 84.17 3.38 7.42 299 30<br />
Eufaula 49 876 78.0 c 21.0 c 9438 2436 86.2 c 13.8 c 0.0 c 96 4781 1.96 39 2 4.65 77.97 c 2.57 5.04 242 24<br />
Gainesville 4 115 80.9 52.2 1036 377 97.8 c 2.2 c 0.0 c 99 c 602 1.60 1 0 4.61 80.87 3.64 5.81 1036 104<br />
Guntersville 35 726 80.2 24.4 7002 1800 92.3 c 7.7 c 0.0 c 97 c 4989 2.77 46 0 5.31 80.17 2.57 7.13 152 15<br />
Harding 8 112 69.6 10.7 944 206 66.0 34.0 0.0 91 282 1.37 0 0 3.45 69.64 2.18 2.99 . .<br />
Harris 11 167 88.0 45.5 1369 466 15.4 84.6 0.0 89 624 1.34 4 0 3.72 88.02 3.40 4.56 342 34<br />
Holt 6 97 74.2 46.4 795 296 15.1 c 84.9 c 0.0 c 100 493 1.67 2 0 4.56 74.23 3.72 6.20 398 40<br />
Jones Bluff 3 52 88.5 76.9 493 216 74.1 c 25.9 c 0.0 c 98 408 1.89 1 0 4.46 88.46 4.38 8.27 493 49<br />
Jordan 8 132 85.6 38.6 1278 459 13.8 c 86.2 c 0.0 c 98 771 1.68 1 0 3.96 85.61 3.59 6.03 1278 128<br />
Lay 16 253 88.5 47.4 2108 808 30.0 c 70.0 c 0.0 c 98 c 1727 2.14 10 0 4.47 88.54 3.83 8.19 211 21<br />
Logan Martin 31 507 92.9 56.8 4538 1986 26.3 c 73.7 c 0.0 c 96 3240 1.63 5 0 3.83 92.90 4.38 7.14 908 91<br />
Martin 12 268 91.4 47.8 2546 1053 17.8 c 82.2 c 0.0 c 93 1444 1.37 1 0 3.52 91.42 4.14 5.67 2546 255<br />
Millers Ferry 2 33 90.9 51.5 304 121 87.8 c 12.2 c 0.0 c 98 195 1.61 1 0 5.32 90.91 3.99 6.43 304 30<br />
Mitchell 7 243 89.7 46.1 2109 851 13.8 c 86.2 c 0.0 c 95 c 1536 1.80 1 0 4.15 89.71 4.04 7.28 2109 211<br />
Mobile Delta 9 89 95.5 50.6 743 312 100.0 0.0 0.0 94 460 1.48 0 0 2.81 95.51 4.20 6.20 . .<br />
Neely Henry 11 298 92.3 49.0 2614 1019 52.4 c 47.6 c 0.0 c 97 1779 1.75 4 0 3.62 92.28 3.90 6.81 654 65<br />
Pickwick 78 2585 96.7 c 65.7 c 23761 10250 b 73.2 c 2.4 c 24.4 c 98 c 24744 2.33 141 12 5.90 96.71 c 4.46 10.41 161 16<br />
Smith 3 90 77.8 15.6 712 204 20.9 c 79.1 c 0.0 c 99 310 1.52 0 0 3.05 77.78 2.87 4.36 . .<br />
Tuscaloosa 2 71 94.4 64.8 620 286 47.3 c 52.7 c 0.0 c 95 c 361 1.26 0 0 4.57 94.37 4.62 5.83 . .<br />
Upper Bear 1 10 90.0 20.0 85 27 51.9 48.1 0.0 100 42 1.54 0 0 2.94 90.00 3.18 4.91 . .<br />
Warrior 1 16 93.8 81.3 152 68 100.0 0.0 0.0 97 125 1.83 0 0 4.50 93.75 4.47 8.20 . .<br />
Weiss 20 312 94.6 44.2 2831 1059 60.8 c 39.2 c 0.0 c 92 1742 1.64 10 0 4.33 94.55 3.74 6.15 283 28<br />
West Point 19 294 88.4 31.3 3323 1080 34.5 c 65.5 c 0.0 c 94 c 1747 1.62 12 0 4.25 88.44 3.25 5.26 277 28<br />
Wheeler 10 195 83.6 34.4 1779 539 83.6 c 2.2 c 14.2 c 98 c 940 1.74 3 0 4.53 83.59 3.03 5.29 593 59<br />
Wilson 5 119 84.0 39.5 998 347 69.4 c 0.0 c 30.6 c 96 c 663 1.91 3 0 4.12 84.03 3.48 6.65 333 33<br />
Grand Total 368 7994 86.6 c 47.2 c 74439 27386 b 53.1 c 46.1 c 0.8 c 96 c 56134 2.02 c 291 c 14 c 4.60 c 86.62 c 3.72 c 7.54 252 c 25 c<br />
<strong>Bass</strong> per day a<br />
Pounds per day a<br />
Hrs. to catch a<br />
bass over 5 lb.<br />
Days a to catch a<br />
bass over 5 lb.<br />
12<br />
Table 1. Statewide summary <strong>of</strong> tournaments for bass clubs participating in the <strong>2011</strong> B.A.I.T. Program.<br />
Lake<br />
No. <strong>of</strong><br />
tournaments<br />
No. <strong>of</strong> anglers<br />
% <strong>of</strong> anglers w/<br />
at least 1 fish<br />
% <strong>of</strong> anglers w/ a<br />
limit <strong>of</strong> fish<br />
Total hrs. fished<br />
Total bass caught<br />
% largemouth<br />
% spotted bass<br />
% smallmouth<br />
Percent <strong>of</strong> bass<br />
released alive<br />
Total lbs. <strong>of</strong> bass<br />
Avg. bass weight<br />
<strong>Bass</strong> over 5lb.<br />
<strong>Bass</strong> over 8lb.<br />
Avg. big bass<br />
weight<br />
% success<br />
(anglers w/ at<br />
least 1 fish)<br />
a a day is defined as one angler fishing for 10 hours<br />
b due to missing data these values are artificially low<br />
c incomplete records were excluded from these calculations
Table 2. Ranking by quality indicators for all reservoirs with five or more tournament reports in the <strong>2011</strong> B.A.I.T. Program.<br />
Percent Average <strong>Bass</strong> <strong>Bass</strong> per Pounds per Hours per<br />
Rank Success Weight <strong>Angler</strong>-Day <strong>Angler</strong>-Day <strong>Bass</strong> > 5 lbs. Overall Value<br />
1 Pickwick Guntersville Bankhead Pickwick Guntersville Pickwick 92<br />
2 Bankhead Pickwick Pickwick Bankhead Pickwick Bankhead 76<br />
3 Mobile Delta Lay Logan Martin Lay Lay Lay 73<br />
4 Aliceville Eufaula Mobile Delta Mitchell Eufaula Logan Martin 60<br />
5 Weiss Wilson Martin Logan Martin West Point Mitchell 60<br />
6 Logan Martin Mitchell Mitchell Guntersville Weiss Neely Henry 60<br />
7 Neely Henry Neely Henry Neely Henry Neely Henry Wilson Guntersville 59<br />
8 Martin Wheeler Lay Wilson Harris Weiss 55<br />
9 Mitchell Bankhead Aliceville Aliceville Holt Wilson 53<br />
10 Lay Jordan Weiss Holt Bankhead Mobile Delta 48<br />
11 West Point Holt Holt Mobile Delta Wheeler Aliceville 46<br />
12 Harris Weiss Jordan Weiss Neely Henry Holt 41<br />
13 Jordan Logan Martin Wilson Jordan Logan Martin Eufaula 40<br />
14 Wilson West Point Harris Martin Jordan Martin 40<br />
15 Wheeler Aliceville West Point Wheeler Mitchell West Point 39<br />
16 Guntersville Mobile Delta Wheeler West Point Martin Jordan 38<br />
17 Eufaula Martin Guntersville Eufaula Aliceville Wheeler 35<br />
18 Holt Harding Eufaula Harris Mobile Delta Harris 29<br />
19 Harding Harris Harding Harding Harding Harding 6<br />
13
1 13 134 73.9 10.4 1060 243 79.5 1.0 19.5 91 439 1.81 1 0 3.45 73.88 2.29 4.14 1060 106<br />
2 13 131 79.4 26.7 1085 320 38.1 60.0 1.9 100 617 1.93 5 0 4.05 79.39 2.95 5.69 217 22<br />
3 8 166 82.5 36.7 2168 665 78.2 21.8 0.0 97 1305 1.96 12 0 5.43 82.53 3.07 6.02 181 18<br />
4 1 18 44.4 11.1 117 19 21.1 78.9 0.0 100 31 1.62 0 0 4.94 44.44 1.62 2.62 . .<br />
5 1 . . . . . . . . . . . . . . . . . . .<br />
6 8 106 81.1 58.5 865 292 36.8 63.2 0.0 86 565 1.94 4 0 4.09 81.13 3.38 6.54 216 22<br />
7 5 97 96.9 80.4 831 435 73.9 26.1 0.0 97 839 1.93 1 0 4.34 96.91 5.24 10.10 831 83<br />
8 5 39 89.7 30.8 350 117 100.0 0.0 0.0 97 159 1.36 0 0 2.54 89.74 3.35 4.54 . .<br />
9 8 196 89.8 32.7 1780 571 . . . 94 1102 1.93 7 0 4.85 89.80 3.21 6.19 254 25<br />
10 10 140 84.3 52.9 1256 487 78.1 21.9 0.0 96 793 1.63 1 0 4.33 84.29 3.88 6.31 1256 126<br />
11 6 506 86.0 29.1 4048 1521 . . . 98 2767 1.82 6 0 5.48 85.97 3.76 6.83 675 67<br />
12 3 58 84.5 39.7 497 163 61.1 2.2 36.7 97 433 2.65 9 0 6.01 84.48 3.28 8.71 55 6<br />
13 5 35 94.3 74.3 304 155 64.3 35.7 0.0 100 307 1.98 1 0 4.14 94.29 5.10 10.08 304 30<br />
14 1 13 38.5 69.2 104 59 . . . 97 81 1.37 0 0 4.58 38.46 5.67 7.75 . .<br />
15 3 65 89.2 61.5 562 222 . . . 100 406 1.83 2 0 4.85 89.23 3.95 7.23 281 28<br />
16 13 360 78.9 33.9 3152 960 . . . 96 1860 1.94 15 0 4.75 78.89 3.05 5.90 210 21<br />
17 13 158 96.2 84.2 1264 716 18.9 81.1 0.0 96 1511 2.11 6 0 4.79 96.20 5.66 11.95 211 21<br />
18 5 790 92.0 45.6 8748 3315 . . . 98 6583 1.99 22 0 6.05 92.03 3.79 7.53 398 40<br />
19 9 192 92.2 69.3 1920 686 . . . 96 1706 2.49 8 0 5.14 92.19 3.57 8.89 240 24<br />
20 2 39 92.3 30.8 361 110 100.0 0.0 0.0 99 155 1.41 0 0 3.31 92.31 3.05 4.29 . .<br />
21 11 90 80.0 14.4 759 185 34.4 65.6 0.0 96 305 1.65 0 0 3.18 80.00 2.44 4.02 . .<br />
22 9 379 88.7 66.8 3222 1221 . . . . 2060 1.69 5 0 4.95 88.65 3.79 6.40 644 64<br />
23 74 2143 . 68.6 18216 7992 . . . . 20319 2.42 129 12 5.95 . 4.61 11.15 133 13<br />
24 142 2139 86.2 30.6 21775 6932 51.5 48.4 0.1 95 11792 1.70 57 2 4.15 86.16 3.18 5.40 382 38<br />
Grand Total 368 7994 86.6 c 47.2 c 74439 27386 b 53.1 c 46.1 c 0.8 c 96 c 56134 2.02 c 291 c 14 c 4.60 c 86.62 c 3.72 c 7.54 252 c 25 c<br />
<strong>Bass</strong> per day a<br />
Pounds per day a<br />
Hrs. to catch a<br />
bass over 5 lb.<br />
Days a to catch a<br />
bass over 5 lb.<br />
14<br />
Table 3. Tournament summary for bass clubs participating in the <strong>2011</strong> B.A.I.T. Program.<br />
Club No.<br />
No. <strong>of</strong><br />
tournaments<br />
No. <strong>of</strong> anglers<br />
% <strong>of</strong> anglers w/<br />
at least 1 fish<br />
% <strong>of</strong> anglers w/ a<br />
limit <strong>of</strong> fish<br />
Total hrs. fished<br />
Total bass<br />
caught<br />
% largemouth<br />
% spotted bass<br />
% smallmouth<br />
Percent <strong>of</strong> bass<br />
released alive<br />
Total lbs. <strong>of</strong> bass<br />
Avg. bass weight<br />
<strong>Bass</strong> over 5lb.<br />
<strong>Bass</strong> over 8lb.<br />
Avg. big bass<br />
weight<br />
% success<br />
(anglers w/ at<br />
least 1 fish)<br />
a a day is defined as one angler fishing for 10 hours<br />
b due to missing data these values are artificially low<br />
c incomplete records were excluded from these calculations
BOEING BASS CLUB 100 SHAWNEE DR. NW HUNTSVILLE AL 35806 JOANTHAN MANTEUFFEL 256-423-8674<br />
LAKE GUNTERSVILLE BASSMASTERS 3480 LITTLE DR SW HARTSELLE AL 35640 PHIL EKEMA 256-751-3656<br />
NATIONAL BASS TRAIL (GA/AL) 979 KENNON DR. CATALULA GA 31804 BLAINE SOUERWINE 706-494-0699<br />
PALS & GALS 3313 CUTOFF ROAD MOUNDVILLE AL 35474 BILLY RICHARDS 205-792-7398<br />
A&D TEAM TRAIL 6130 HWY 17 COFFEEVILLE AL 36919 ANOTHONY SKINNER 251-542-9644<br />
HILLCREST BASS CLUB 5117 POST OAK RD. OXFORD AL 36206 CLYDE ABERNATHY 256-835-9412<br />
FISHERS OF MEN - SOUTH ALA. P.O. BOX 2222 E. BREWTON AL 36427 ALLEN COUCH 251-867-9852<br />
MOBILE BASSMASTERS 4951 GOVERNMENT BLVD. MOBILE AL 36693 BOB STEELE 251-661-9600<br />
BIRMINGHAM BASSMASTERS 13784 DIANNE DR. McCALLA AL 35111 MIKE LINN 205-477-7643<br />
NORTHPORT BASS CLUB 11008 BUSTER TIERCE SPUR NORTHPORT AL 35475 ROBERT FINDLAY 205-339-5546<br />
ALABAMA BASS FEDERATION 1362 COUNY ROAD 85 PRATTVILLE AL 36067 JIM SPARROW 334-201-4135<br />
MORGAN COUNTY BASS CLUB 171 ROSECLIFF DR. HARVEST AL 35749 KEVIN MAYES 256-837-5711<br />
PRATTVILLE BASS ANGLERS 1752 WHIPPOORWILL CT. DEATSVILLE AL 36022 TIM BAKER<br />
DIXIE BASS P. O. BOX 1214 WAYNESBORO MS 39367 MARGUERITE PALMER 601-735-3058<br />
NORTH ALABAMA FISHING FORUMS.COM PO BOX 185 WARRIOR AL 35180 JODY HARRISON 205-243-4572<br />
NORTH ALABAMA TOURNAMENT ANGLERS24963 LISA DR. ATHENS AL 35613 STAN SHERROD 256-230-0081<br />
NORTH BIBB BASS CLUB 1177 MT. CARMEL DR. WEST BLOCKTON AL 35184 DOUG HAYNES 205-938-2455<br />
ALABAMA B.A.S.S. FEDERATION NATION 605 FARR CIRCLE BIRMINGHAM AL 35226 EDDIE PLEMONS 205-979-3526<br />
WEST ALABAMA BASS FISHERMANS ASSN.P.O. BOX 210 GORDO AL. 35466 JEFF GILLIAM 205-364-8530<br />
PENSACOLA HAWG HJNTER BASS CLUB 5680 MULDOON ROAD PERDIDO RIVER FL 32526 WILLIAM MYRICK 850-456-6860<br />
BLUFF CITY BASSMASTERS 501 FIVE MILE RD. EUFAULA AL 36027 JIM HOWARD 334-616-1918<br />
FAYETTE BASS CLUB 10991 HWY 13 N BANKSTON AL 35542 TODD TUCKER<br />
MISS. DIV. WILDLIFE, FISHERIES & PARKS 1505 EASTOVER DR. JACKSON MS 39211 LARRY PUGH 601-432-2400<br />
GEORIGA BASS FEDERATION BIOLOGY DEPT., 1601 MAPLE ST.CARROLLTON GA 30118 DR. CARL QUERTERMUS 678-839-4035<br />
15<br />
Table 4. Clubs supporting the <strong>2011</strong> B.A.I.T. annual report.<br />
Club Name Address City State Zip Code Representative Phone
JAN 10 129 41.3 2.8 1034 78 58.9 41.1 0.0 100 184 1.52 1 0 2.79 41.28 0.90 1.77 1034 103<br />
FEB 32 568 80.6 36.6 4625 1454 50.4 49.6 0.0 100 3155 1.93 33 1 4.90 80.59 3.34 6.82 140 14<br />
MAR 44 1276 78.5 32.4 11276 3456 63.7 36.3 0.0 96 7707 2.21 59 3 5.32 78.45 3.09 6.83 188 19<br />
APR 41 913 93.3 58.1 8170 3440 54.1 45.9 0.0 97 7053 1.98 45 3 5.30 93.29 4.31 8.63 175 17<br />
MAY 47 1021 93.1 65.6 10088 4136 62.4 37.1 0.5 96 9095 2.14 44 2 4.86 93.10 4.16 9.02 229 23<br />
JUN 41 1229 92.0 63.1 11659 4938 65.2 34.2 0.6 93 10219 2.07 49 2 4.82 92.01 4.22 8.74 235 24<br />
JUL 31 714 81.8 58.4 6063 2508 46.8 46.8 6.4 93 5671 2.26 24 3 4.50 81.79 4.14 9.35 242 24<br />
AUG 27 366 88.2 45.9 3191 1103 55.5 41.2 3.3 94 2092 1.90 8 0 4.45 88.15 3.46 6.56 399 40<br />
SEP 29 685 84.9 31.8 5953 2003 34.5 64.3 1.2 96 3612 1.80 6 0 3.87 84.93 3.36 6.07 960 96<br />
OCT 38 730 88.4 30.7 9214 3117 43.3 56.3 0.4 96 5485 1.76 16 0 4.06 88.40 3.38 5.95 576 58<br />
NOV 17 214 89.3 40.7 1851 690 38.6 61.4 0.0 97 1166 1.69 5 0 3.87 89.25 3.73 6.30 370 37<br />
DEC 11 149 86.6 34.9 1317 463 38.0 62.0 0.0 95 695 1.50 1 0 4.00 86.58 3.52 5.28 1317 132<br />
Grand Total 368 7994 86.6 c 47.2 c 74439 27386 b 53.1 c 46.1 c 0.8 c 96 c 56134 2.02 c 291 c 14 c 4.60 c 86.62 c 3.72 c 7.54 252 c 25 c<br />
<strong>Bass</strong> per day a<br />
Pounds per day a<br />
Hrs. to catch a<br />
bass over 5 lb.<br />
Days a to catch a<br />
bass over 5 lb.<br />
16<br />
Table 5. Statewide summary <strong>of</strong> bass tournaments by month for bass clubs participating in the <strong>2011</strong> B.A.I.T. Program.<br />
Month<br />
No. <strong>of</strong><br />
tournaments<br />
No. <strong>of</strong> anglers<br />
% <strong>of</strong> anglers w/<br />
at least 1 fish<br />
% <strong>of</strong> anglers w/ a<br />
limit <strong>of</strong> fish<br />
Total hrs. fished<br />
Total bass<br />
caught<br />
% largemouth<br />
% spotted bass<br />
% smallmouth<br />
Percent <strong>of</strong> bass<br />
released alive<br />
Total lbs. <strong>of</strong> bass<br />
Avg. bass weight<br />
<strong>Bass</strong> over 5lb.<br />
<strong>Bass</strong> over 8lb.<br />
Avg. big bass<br />
weight<br />
% success<br />
(anglers w/ at<br />
least 1 fish)<br />
a a day is defined as one angler fishing for 10 hours<br />
b due to missing data these values are artificially low<br />
c incomplete records were excluded from these calculations
900<br />
850<br />
800<br />
750<br />
700<br />
650<br />
600<br />
550<br />
500<br />
450<br />
400<br />
350<br />
300<br />
250<br />
200<br />
150<br />
100<br />
50<br />
0<br />
Hours<br />
17<br />
9<br />
8<br />
<strong>Bass</strong> / Day<br />
Pounds / Day<br />
Hrs. / 5 lb. <strong>Bass</strong><br />
7<br />
6<br />
Pounds or Number<br />
5<br />
4<br />
3<br />
2<br />
1<br />
0<br />
1986 1988 1990 1992 1994 1996 1998 2000 2002 2004 2006 2008 2010<br />
Year<br />
Figure 1. Annual catch for B.A.I.T. tournaments, 1986 - <strong>2011</strong>.
POUNDS OR NUMBER<br />
10<br />
COFFEEVILLE<br />
8<br />
6<br />
4<br />
2<br />
AVERAGE WEIGHT BASS/ANGLER POUNDS/ANGLER<br />
0<br />
1985 1990 1995 2000 2005 2010<br />
YEAR<br />
POUNDS OR NUMBER<br />
8<br />
DEMOPOLIS<br />
6<br />
4<br />
2<br />
AVERAGE WEIGHT BASS/ANGLER POUNDS/ANGLER<br />
0<br />
1985 1990 1995 2000 2005 2010<br />
YEAR<br />
POUNDS OR NUMBER<br />
9<br />
8<br />
7<br />
6<br />
5<br />
4<br />
3<br />
2<br />
1<br />
0<br />
EUFAULA<br />
AVERAGE WEIGHT BASS/ANGLER POUNDS/ANGLER<br />
1985 1990 1995 2000 2005 2010<br />
YEAR<br />
Figure 2. Annual quality indicators for C<strong>of</strong>feeville, Demopolis, and Eufaula, through <strong>2011</strong>.<br />
18
POUNDS OR NUMBER<br />
8<br />
GAINESVILLE<br />
6<br />
4<br />
2<br />
AVERAGE WEIGHT BASS/ANGLER POUNDS/ANGLER<br />
0<br />
1985 1990 1995 2000 2005 2010<br />
POUNDS OR NUMBER<br />
10<br />
YEAR<br />
GUNTERSVILLE<br />
8<br />
6<br />
4<br />
2<br />
AVERAGE WEIGHT BASS/ANGLER POUNDS/ANGLER<br />
0<br />
1985 1990 1995 2000 2005 2010<br />
YEAR<br />
POUNDS OR NUMBER<br />
6<br />
HARDING<br />
5<br />
4<br />
3<br />
2<br />
1<br />
0<br />
AVERAGE WEIGHT BASS/ANGLER POUNDS/ANGLER<br />
1985 1990 1995 2000 2005 2010<br />
YEAR<br />
Figure 3. Annual quality indicators for Gainesville, Guntersville, and Harding, through <strong>2011</strong>.<br />
19
POUNDS OR NUMBER<br />
7<br />
6<br />
HARRIS<br />
5<br />
4<br />
3<br />
2<br />
1<br />
AVERAGE WEIGHT BASS/ANGLER POUNDS/ANGLER<br />
0<br />
1985 1990 1995 2000 2005 2010<br />
YEAR<br />
POUNDS OR NUMBER<br />
POUNDS OR NUMBER<br />
9<br />
8<br />
JONES BLUFF<br />
7<br />
6<br />
5<br />
4<br />
3<br />
2<br />
1<br />
AVERAGE WEIGHT BASS/ANGLER POUNDS/ANGLER<br />
0<br />
1985 1990 1995 2000 2005 2010<br />
8<br />
7<br />
YEAR<br />
JORDAN<br />
6<br />
5<br />
4<br />
3<br />
2<br />
1<br />
0<br />
AVERAGE WEIGHT BASS/ANGLER POUNDS/ANGLER<br />
1985 1990 1995 2000 2005 2010<br />
YEAR<br />
Figure 4. Annual quality indicators for Harris, Jones Bluff, and Jordan, through <strong>2011</strong>.<br />
20
POUNDS OR NUMBER<br />
10<br />
LAY<br />
8<br />
6<br />
4<br />
2<br />
AVERAGE WEIGHT BASS/ANGLER POUNDS/ANGLER<br />
0<br />
1985 1990 1995 2000 2005 2010<br />
YEAR<br />
POUNDS OR NUMBER<br />
POUNDS OR NUMBER<br />
8<br />
7<br />
LOGAN MARTIN<br />
6<br />
5<br />
4<br />
3<br />
2<br />
1<br />
AVERAGE WEIGHT BASS/ANGLER POUNDS/ANGLER<br />
0<br />
1985 1990 1995 2000 2005 2010<br />
7<br />
6<br />
YEAR<br />
MARTIN<br />
5<br />
4<br />
3<br />
2<br />
1<br />
0<br />
AVERAGE WEIGHT BASS/ANGLER POUNDS/ANGLER<br />
1985 1990 1995 2000 2005 2010<br />
YEAR<br />
Figure 5. Annual quality indicators for Lay, Logan Martin, and Martin, through <strong>2011</strong>.<br />
21
POUNDS OR NUMBER<br />
12<br />
MILLERS FERRY<br />
10<br />
8<br />
6<br />
4<br />
2<br />
AVERAGE WEIGHT BASS/ANGLER POUNDS/ANGLER<br />
0<br />
1985 1990 1995 2000 2005 2010<br />
YEAR<br />
POUNDS OR NUMBER<br />
9<br />
8<br />
MITCHELL<br />
7<br />
6<br />
5<br />
4<br />
3<br />
2<br />
1<br />
AVERAGE WEIGHT BASS/ANGLER POUNDS/ANGLER<br />
0<br />
1985 1990 1995 2000 2005 2010<br />
YEAR<br />
POUNDS OR NUMBER<br />
7<br />
6<br />
MOBILE DELTA<br />
5<br />
4<br />
3<br />
2<br />
1<br />
0<br />
AVERAGE WEIGHT BASS/ANGLER POUNDS/ANGLER<br />
1985 1990 1995 2000 2005 2010<br />
YEAR<br />
Figure 6. Annual quality indicators for Millers Ferry, Mitchell, and the Mobile Delta, through <strong>2011</strong>.<br />
22
POUNDS OR NUMBER<br />
8<br />
NEELY HENRY<br />
6<br />
4<br />
2<br />
AVERAGE WEIGHT BASS/ANGLER POUNDS/ANGLER<br />
0<br />
1985 1990 1995 2000 2005 2010<br />
YEAR<br />
POUNDS OR NUMBER<br />
POUNDS OR NUMBER<br />
12<br />
11<br />
PICKWICK<br />
10<br />
9<br />
8<br />
7<br />
6<br />
5<br />
4<br />
3<br />
2<br />
1<br />
AVERAGE WEIGHT BASS/ANGLER POUNDS/ANGLER<br />
0<br />
1985 1990 1995 2000 2005 2010<br />
5<br />
4<br />
3<br />
2<br />
1<br />
YEAR<br />
SMITH<br />
AVERAGE WEIGHT BASS/ANGLER POUNDS/ANGLER<br />
0<br />
1985 1990 1995 2000 2005 2010<br />
YEAR<br />
Figure 7. Annual quality indicators for Neely Henry, Pickwick, and Smith, through <strong>2011</strong>.<br />
23
POUNDS OR NUMBER<br />
10<br />
WARRIOR<br />
8<br />
6<br />
4<br />
2<br />
AVERAGE WEIGHT BASS/ANGLER POUNDS/ANGLER<br />
0<br />
1985 1990 1995 2000 2005 2010<br />
YEAR<br />
POUNDS OR NUMBER<br />
8<br />
7<br />
WEISS<br />
6<br />
5<br />
4<br />
3<br />
2<br />
1<br />
AVERAGE WEIGHT BASS/ANGLER POUNDS/ANGLER<br />
0<br />
1985 1990 1995 2000 2005 2010<br />
YEAR<br />
POUNDS OR NUMBER<br />
7<br />
6<br />
WEST POINT<br />
5<br />
4<br />
3<br />
2<br />
1<br />
0<br />
AVERAGE WEIGHT BASS/ANGLER POUNDS/ANGLER<br />
1985 1990 1995 2000 2005 2010<br />
YEAR<br />
Figure 8. Annual quality indicators for Warrior, Weiss, and West Point, through <strong>2011</strong>.<br />
24
POUNDS OR NUMBER<br />
8<br />
WHEELER<br />
6<br />
4<br />
2<br />
AVERAGE WEIGHT BASS/ANGLER POUNDS/ANGLER<br />
0<br />
1985 1990 1995 2000 2005 2010<br />
YEAR<br />
POUNDS OR NUMBER<br />
10<br />
9<br />
8<br />
7<br />
WILSON<br />
AVERAGE WEIGHT BASS/ANGLER POUNDS/ANGLER<br />
6<br />
5<br />
4<br />
3<br />
2<br />
1<br />
0<br />
1985 1990 1995 2000 2005 2010<br />
YEAR<br />
Figure 9. Annual quality indicators for Wheeler and Wilson, through <strong>2011</strong>.<br />
25
Table 6. Summary <strong>of</strong> bass tournaments by lake and month for bass clubs participating in the <strong>2011</strong> B.A.I.T. Program.<br />
Lake<br />
Month<br />
No. <strong>of</strong><br />
tournaments<br />
No. <strong>of</strong> anglers<br />
% success<br />
(anglers w/ at<br />
least 1 fish)<br />
Total hrs. fished<br />
Total bass<br />
caught<br />
% largemouth<br />
% spotted bass<br />
% smallmouth<br />
Percent <strong>of</strong> bass<br />
released alive<br />
Total lbs. <strong>of</strong> bass<br />
Avg. bass<br />
weight<br />
<strong>Bass</strong> over 5lb.<br />
<strong>Bass</strong> over 8lb.<br />
Avg. big bass<br />
weight<br />
<strong>Bass</strong> per day 1<br />
Pounds per day 1<br />
Hrs. to catch a<br />
bass over 5 lb.<br />
Eufaula JAN 2 33 33.3 264 24 95.5 4.5 0.0 100.0 43.1 1.80 0 0 2.24 0.91 1.63 .<br />
FEB 5 59 76.3 466 149 88.7 11.3 0.0 98.0 299.9 2.01 2 0 4.75 3.20 6.43 233<br />
MAR 10 305 71.8 2643 631 87.7 12.3 0.0 98.7 1382.9 2.19 13 1 5.28 2.39 5.23 203<br />
APR 8 112 88.4 1271 381 93.7 6.3 0.0 96.3 779.9 2.05 11 1 5.49 3.00 6.14 116<br />
MAY 10 144 77.8 1674 380 87.4 12.6 0.0 94.2 677.3 1.78 3 0 4.06 2.27 4.05 558<br />
JUN 4 84 97.6 1566 470 81.3 18.7 0.0 96.0 866.6 1.84 7 0 4.53 2.91 5.37 224<br />
JUL 2 21 85.7 189 41 76.7 23.3 0.0 87.8 65.1 1.59 0 0 2.93 2.17 3.45 .<br />
AUG 2 18 77.8 243 72 71.4 28.6 0.0 87.5 128.9 1.79 1 0 6.17 2.96 5.31 243<br />
SEP . . . . . . . . . . . . . . . . .<br />
OCT 4 75 85.3 939 241 85.6 14.4 0.0 96.7 439.7 1.82 1 0 4.05 2.57 4.68 939<br />
NOV 1 9 88.9 72 20 60.0 40.0 0.0 100.0 45.7 2.28 1 0 5.25 2.78 6.34 72<br />
DEC 1 16 68.8 112 27 85.2 14.8 0.0 96.3 51.9 1.92 0 0 4.84 2.41 4.63 .<br />
Guntersville JAN . . . . . . . . . . . . . . . . .<br />
FEB 6 96 82.3 744 216 93.0 7.0 0.0 100.0 625.3 2.90 12 0 6.04 2.90 8.41 62<br />
MAR 6 127 81.1 1460 357 90.4 9.6 0.0 99.7 1049.2 2.94 12 0 5.22 2.45 7.19 122<br />
APR 3 81 91.4 767 234 95.9 4.1 0.0 91.5 622.2 2.66 7 0 6.20 3.05 8.12 110<br />
MAY 4 74 93.2 868 320 96.0 4.0 0.0 91.5 1066.7 3.33 5 0 5.42 3.69 12.29 174<br />
JUN 2 40 92.5 340 96 . . . . 239.3 2.49 2 0 6.25 2.82 7.04 170<br />
JUL 1 40 65.0 360 67 . . . 95.5 168.1 2.51 1 0 5.88 1.86 4.67 360<br />
AUG 2 22 77.3 186 39 82.1 17.9 0.0 94.9 89.9 2.30 0 0 4.14 2.10 4.83 .<br />
SEP 4 143 79.7 1307 334 90.5 9.5 0.0 98.8 766.4 2.29 2 0 4.31 2.56 5.86 654<br />
OCT 5 74 58.1 726 96 91.7 8.3 0.0 99.0 251.4 2.62 3 0 4.92 1.32 3.46 242<br />
NOV 2 29 69.0 245 41 91.7 8.3 0.0 100.0 110.6 2.70 2 0 5.26 1.67 4.51 123<br />
DEC . . . . . . . . . . . . . . . . .<br />
Harris JAN 2 20 50.0 160 12 0.0 100.0 0.0 100.0 15.2 1.27 0 0 1.36 0.75 0.95 .<br />
FEB 1 29 93.1 261 113 6.2 93.8 0.0 100.0 147.9 1.31 0 0 4.18 4.33 5.67 .<br />
MAR 1 28 85.7 224 51 29.4 70.6 0.0 29.4 84.4 1.65 2 0 5.69 2.28 3.77 112<br />
APR 1 11 100.0 88 40 37.5 62.5 0.0 97.5 55.0 1.38 0 0 3.75 4.55 6.25 .<br />
MAY 1 16 100.0 128 35 65.7 34.3 0.0 97.1 63.4 1.81 1 0 5.13 2.73 4.95 128<br />
JUN . . . . . . . . . . . . . . . . .<br />
JUL . . . . . . . . . . . . . . . . .<br />
AUG 1 20 100.0 160 62 11.3 88.7 0.0 79.0 81.9 1.32 1 0 6.91 3.88 5.12 160<br />
SEP . . . . . . . . . . . . . . . . .<br />
OCT . . . . . . . . . . . . . . . . .<br />
NOV 1 8 100.0 68 33 9.1 90.9 0.0 100.0 41.4 1.26 0 0 2.31 4.85 6.09 .<br />
DEC 3 35 88.6 280 120 7.5 92.5 0.0 98.3 134.9 1.12 0 0 3.43 4.29 4.82 .<br />
Lay JAN . . . . . . . . . . . . . . . . .<br />
FEB 4 86 88.4 716 273 30.7 69.3 0.0 100.0 590.8 2.16 6 0 5.43 3.81 8.25 119<br />
MAR 3 41 87.8 360 117 20.4 79.6 0.0 98.1 250.1 2.14 1 0 3.89 3.25 6.95 360<br />
APR . . . . . . . . . . . . . . . . .<br />
MAY 1 6 100.0 60 28 64.3 35.7 0.0 100.0 62.6 2.24 0 0 4.89 4.67 10.43 .<br />
JUN 2 37 89.2 296 131 6.7 93.3 0.0 94.7 272.2 2.08 0 0 4.33 4.43 9.20 .<br />
JUL . . . . . . . . . . . . . . . . .<br />
AUG 1 6 66.7 48 6 0.0 100.0 0.0 100.0 8.9 1.48 0 0 1.94 1.25 1.84 .<br />
SEP 3 56 85.7 460 153 13.5 86.5 0.0 90.5 316.4 2.07 1 0 4.34 3.33 6.89 460<br />
OCT 2 21 100.0 168 100 53.0 47.0 0.0 100.0 225.7 2.26 2 0 4.85 5.95 13.43 84<br />
NOV . . . . . . . . . . . . . . . . .<br />
DEC . . . . . . . . . . . . . . . . .<br />
1 a day is defined as one angler fishing for 10 hours<br />
26
Table 6. Cont'd.<br />
Lake<br />
Month<br />
No. <strong>of</strong><br />
tournaments<br />
No. <strong>of</strong> anglers<br />
% success<br />
(anglers w/ at<br />
least 1 fish)<br />
Total hrs. fished<br />
Total bass<br />
caught<br />
% largemouth<br />
% spotted bass<br />
% smallmouth<br />
Percent <strong>of</strong> bass<br />
released alive<br />
Total lbs. <strong>of</strong> bass<br />
Avg. bass<br />
weight<br />
<strong>Bass</strong> over 5lb.<br />
<strong>Bass</strong> over 8lb.<br />
Avg. big bass<br />
weight<br />
<strong>Bass</strong> per day 1<br />
Pounds per day 1<br />
Hrs. to catch a<br />
bass over 5 lb.<br />
Logan Martin JAN . . . . . . . . . . . . . . . . .<br />
FEB . . . . . . . . . . . . . . . . .<br />
MAR . . . . . . . . . . . . . . . . .<br />
APR 4 71 94.4 637 321 31.2 68.8 0.0 96.6 562.1 1.75 2 0 4.31 5.04 8.82 319<br />
MAY 6 118 95.8 1068 490 27.7 72.3 0.0 94.5 711.7 1.45 1 0 3.86 4.59 6.66 1068<br />
JUN 3 130 87.7 1116 451 47.7 52.3 0.0 94.7 807.1 1.79 1 0 4.24 4.04 7.23 1116<br />
JUL . . . . . . . . . . . . . . . . .<br />
AUG 3 21 95.2 168 56 11.1 88.9 0.0 98.2 78.4 1.40 0 0 2.79 3.33 4.66 .<br />
SEP 6 62 93.5 530 240 12.5 87.5 0.0 95.4 389.9 1.62 0 0 3.89 4.53 7.36 .<br />
OCT 5 57 98.2 619 266 23.3 76.7 0.0 95.9 411.9 1.55 1 0 3.48 4.30 6.65 619<br />
NOV 2 16 87.5 128 59 71.2 28.8 0.0 100.0 94.3 1.60 0 0 3.31 4.61 7.37 .<br />
DEC 2 32 90.6 272 103 12.6 87.4 0.0 100.0 184.4 1.79 0 0 4.35 3.79 6.78 .<br />
Martin JAN . . . . . . . . . . . . . . . . .<br />
FEB 2 28 82.1 230 61 11.7 88.2 . 100.0 90.7 1.49 0 0 2.78 2.65 3.94 .<br />
MAR 2 35 85.7 360 127 7.9 92.1 0.0 98.4 184.5 1.45 0 0 4.28 3.53 5.13 .<br />
APR 1 94 95.7 752 407 . . . 99.3 574.6 1.41 1 0 5.88 5.41 7.64 752<br />
MAY . . . . . . . . . . . . . . . . .<br />
JUN . . . . . . . . . . . . . . . . .<br />
JUL 1 28 92.9 280 81 18.5 81.5 0.0 100.0 118.2 1.46 0 0 3.90 2.89 4.22 .<br />
AUG . . . . . . . . . . . . . . . . .<br />
SEP . . . . . . . . . . . . . . . . .<br />
OCT 4 55 90.9 707 292 23.3 76.7 0.0 78.1 367.6 1.26 0 0 3.02 4.13 5.20 .<br />
NOV 2 28 92.9 217 85 15.3 84.7 0.0 98.8 108.7 1.28 0 0 3.14 3.92 5.01 .<br />
DEC . . . . . . . . . . . . . . . . .<br />
Neely Henry JAN . . . . . . . . . . . . . . . . .<br />
FEB . . . . . . . . . . . . . . . . .<br />
MAR . . . . . . . . . . . . . . . . .<br />
APR 2 148 93.9 1332 562 26.7 73.3 0.0 96.4 1090.4 1.94 4 0 4.58 4.22 8.19 333<br />
MAY . . . . . . . . . . . . . . . . .<br />
JUN 1 13 100.0 104 34 79.4 20.6 0.0 100.0 56.2 1.65 0 0 3.18 3.27 5.41 .<br />
JUL 4 52 88.5 434 154 50.0 50.0 0.0 93.5 223.9 1.45 0 0 3.23 3.55 5.17 .<br />
AUG . . . . . . . . . . . . . . . . .<br />
SEP 3 64 93.8 566 214 46.7 53.3 0.0 100.0 318.6 1.49 0 0 3.71 3.78 5.63 .<br />
OCT 1 21 81.0 179 55 . . . 98.2 90.3 1.64 0 0 3.44 3.08 5.06 .<br />
NOV . . . . . . . . . . . . . . . . .<br />
DEC . . . . . . . . . . . . . . . . .<br />
Pickw ick JAN 2 20 . 170 . . . . . 64.7 . 1 0 4.90 . 3.81 170<br />
FEB 5 83 . 706 116 . . . . 618.6 2.38 12 1 5.92 2.68 8.77 59<br />
MAR 10 490 . 4165 1486 . . . . 3514.8 2.37 25 2 6.93 3.57 8.44 160<br />
APR 11 168 . 1428 620 . . . . 1877.6 2.66 13 2 6.04 5.03 13.15 86<br />
MAY 11 391 100.0 3422 1778 . . . 98.0 4443.0 2.36 25 2 6.19 5.44 12.99 137<br />
JUN 10 528 . 4488 2305 . . . . 5510.4 2.39 31 2 6.78 5.14 12.28 140<br />
JUL 12 386 88.9 3272 1725 75.0 1.9 23.1 94.2 4366.8 2.53 21 3 6.02 5.27 13.35 144<br />
AUG 10 158 87.3 1319 472 68.1 4.3 27.7 95.7 1030.4 2.18 4 0 4.77 3.58 7.81 330<br />
SEP 2 141 . 1199 481 . . . . 924.4 1.92 3 0 6.13 4.01 7.71 334<br />
OCT 5 220 97.9 3593 1267 79.2 0.0 20.8 98.7 2393.0 1.89 6 0 4.13 3.53 6.66 599<br />
NOV . . . . . . . . . . . . . . . . .<br />
DEC . . . . . . . . . . . . . . . . .<br />
1 a day is defined as one angler fishing for 10 hours<br />
27
Table 6. Cont'd.<br />
Lake<br />
Month<br />
No. <strong>of</strong><br />
tournaments<br />
No. <strong>of</strong> anglers<br />
% success<br />
(anglers w/ at<br />
least 1 fish)<br />
Total hrs. fished<br />
Total bass<br />
caught<br />
% largemouth<br />
% spotted bass<br />
% smallmouth<br />
Percent <strong>of</strong> bass<br />
released alive<br />
Total lbs. <strong>of</strong> bass<br />
Avg. bass<br />
weight<br />
<strong>Bass</strong> over 5lb.<br />
<strong>Bass</strong> over 8lb.<br />
Avg. big bass<br />
weight<br />
<strong>Bass</strong> per day 1<br />
Pounds per day 1<br />
Hrs. to catch a<br />
bass over 5 lb.<br />
Weiss JAN . . . . . . . . . . . . . . . . .<br />
FEB . . . . . . . . . . . . . . . . .<br />
MAR . . . . . . . . . . . . . . . . .<br />
APR . . . . . . . . . . . . . . . . .<br />
MAY 3 33 97.0 277 128 54.7 45.3 0.0 97.7 247.0 1.93 3 0 5.22 4.62 8.92 92<br />
JUN 8 155 96.8 1464 572 65.6 34.4 0.0 89.0 907.1 1.59 5 0 4.41 3.91 6.20 293<br />
JUL 2 27 96.3 216 65 58.5 41.5 0.0 93.8 110.8 1.70 0 0 3.95 3.01 5.13 .<br />
AUG 2 43 95.3 415 149 61.1 38.9 0.0 94.6 226.1 1.52 0 0 3.96 3.59 5.45 .<br />
SEP 2 30 93.3 263 77 48.1 51.9 0.0 97.4 121.2 1.57 0 0 3.28 2.93 4.61 .<br />
OCT 2 17 70.6 140 46 65.2 34.8 0.0 100.0 75.3 1.64 0 0 3.45 3.30 5.39 .<br />
NOV 1 7 85.7 56 22 63.6 36.4 0.0 100.0 54.3 2.47 2 0 6.42 3.93 9.69 28<br />
DEC . . . . . . . . . . . . . . . . .<br />
West Point JAN 1 9 22.2 72 2 50.0 50.0 0.0 100.0 4.5 2.25 0 0 2.19 0.28 0.63 .<br />
FEB . . . . . . . . . . . . . . . . .<br />
MAR 2 27 92.6 216 78 30.8 69.2 0.0 100.0 118.4 1.52 1 0 4.82 3.61 5.48 216<br />
APR 2 39 94.9 312 126 31.0 69.0 0.0 98.6 203.4 1.61 3 0 5.37 4.04 6.52 104<br />
MAY 5 104 90.4 1270 388 39.7 60.3 0.0 97.7 611.4 1.58 5 0 4.59 3.06 4.82 254<br />
JUN 1 14 100.0 252 58 67.2 32.8 0.0 89.7 99.3 1.71 1 0 5.28 2.30 3.94 252<br />
JUL 2 24 79.2 201 51 33.3 66.7 0.0 62.7 69.0 1.35 0 0 2.94 2.54 3.43 .<br />
AUG . . . . . . . . . . . . . . . . .<br />
SEP 3 38 86.8 342 104 40.4 59.6 0.0 76.0 142.0 1.37 0 0 3.41 3.04 4.15 .<br />
OCT 2 35 91.4 590 236 14.6 85.4 0.0 99.2 445.4 1.89 2 0 5.55 4.00 7.55 295<br />
NOV 1 4 100.0 68 37 10.8 89.2 0.0 97.3 54.0 1.46 0 0 2.72 5.44 7.94 .<br />
DEC . . . . . . . . . . . . . . . . .<br />
1 a day is defined as one angler fishing for 10 hours<br />
28
Other Topics<br />
TOURNAMENT PERMITS<br />
The <strong>Alabama</strong> Division <strong>of</strong> Wildlife & Freshwater Fisheries does not<br />
require tournament organizations to secure tournament permits for any <strong>of</strong><br />
their events. However, the <strong>Alabama</strong> Marine Police requires a Marine<br />
Event Permit for any event (including bass tournaments) with more than<br />
100 boats participating. Applications can be obtained from the <strong>Alabama</strong><br />
Marine Police free <strong>of</strong> charge by calling (334) 242-3630, and must be<br />
completed and submitted to them at least 15 days prior to the event.<br />
The U.S. Army Corps <strong>of</strong> Engineers also requires a Special Use<br />
Permit for bass tournaments with more than 10 boats which are held on<br />
any <strong>of</strong> their reservoirs. Corps permits must be submitted 30 days prior to<br />
the event, and can be obtained from your local project <strong>of</strong>fice or from their<br />
website at: http://bwt.sam.usace.army.mil/specialevent.htm.<br />
CORPS OF ENGINEERS ANNUAL DAY USE PERMITS<br />
Annual passes can be obtained from the guard shack at all park<br />
entrances, or by contacting your local Corp <strong>of</strong> Engineers Resources<br />
Management <strong>of</strong>fice. These passes allow you to use any boat ramp<br />
operated and maintained by the Corps <strong>of</strong> Engineers, nationwide. The<br />
charge for these permits is $30 and is good for one year from the date <strong>of</strong><br />
purchase. Local and regional <strong>of</strong>fices are listed below.<br />
<strong>Alabama</strong> River Lakes Site Office (Hayneville) 334-872-9554<br />
Millers Ferry Resource Office (Camden) 334-682-4244<br />
Holt Resource Office (Peterson) 205-553-9373<br />
Black Warrior/Tombigbee Project Mgmt. Office (Tuscaloosa) 205-752-3571<br />
Demopolis Site Office (Demopolis) 334-289-3540<br />
Tennessee-Tombigbee Waterway Office (Carrollton) 205-373-8705<br />
TRAILER TOURNAMENTS<br />
Any tournaments where rules permit anglers to fish in various water<br />
bodies and then bring their catch to a particular lake for a weigh-in where<br />
fish are then released alive into that body <strong>of</strong> water are in direct violation <strong>of</strong><br />
<strong>Alabama</strong>’s Public Water Stocking (220-2-.129) regulation. Moving live fish<br />
from one lake to another can have a number <strong>of</strong> detrimental consequences;<br />
examples include 1) moving fish caught from lakes with consumption<br />
advisories into lakes without advisories, 2) introducing genetically inferior<br />
strains <strong>of</strong> spotted bass into our world-class spotted bass fisheries <strong>of</strong> the<br />
Coosa River, 3) introducing diseases such as the Largemouth <strong>Bass</strong> Virus<br />
which decimated many <strong>of</strong> our bass fisheries in <strong>Alabama</strong> beginning in the<br />
late 1990’s, 4) diluting the genetic benefits <strong>of</strong> our Florida bass stocking<br />
program, and 5) introducing non-native, potentially harmful species into<br />
lakes where they do not currently exist.<br />
However, it is important for anglers to know that only the act <strong>of</strong><br />
releasing fish into a body <strong>of</strong> water other than where they were caught is<br />
illegal. If tournament organizations want to continue to <strong>of</strong>fer these<br />
types <strong>of</strong> tournaments to their competitors, they are certainly free to do<br />
so as long as the fish brought in from other reservoirs are not<br />
released there. If you participate in one <strong>of</strong> these tournaments, do not<br />
release your fish into that lake if you did not catch them there.<br />
Your fish can be eaten, donated to a charitable organization such as<br />
an orphanage, or returned to the reservoir from which they were<br />
caught. Fish can only be moved legally from one reservoir to another<br />
if they are transported by boat through a navigable lock.<br />
CATCH-AND-RELEASE<br />
Access area creel surveys conducted by Wildlife & Freshwater<br />
Fisheries biologists have revealed a significant decline in bass<br />
harvest rates, statewide. In 2009, nearly 100% <strong>of</strong> all bass caught<br />
from public waters were released.<br />
As the catch-and-release ethic has evolved during the last 20<br />
years due to intense promotion by tournament organizations and<br />
participants, many well-intentioned anglers have become so<br />
passionate about this angling ethic that they feel a moral obligation to<br />
release every bass they catch, which <strong>of</strong>ten leads them to make some<br />
poor choices with regard to the handling <strong>of</strong> their fish.<br />
An unfortunate consequence <strong>of</strong> catch-and-release is that<br />
tournament anglers are <strong>of</strong>ten so focused on releasing their fish alive,<br />
that they sometimes fail to recognize when a fish is too far gone to<br />
survive the stress. Making this mistake can result in numerous dead<br />
fish floating in the water around the boat ramp on the following day.<br />
The number <strong>of</strong> complaints received by ADCNR accusing tournament<br />
anglers <strong>of</strong> killing and wasting fish during organized bass tournaments<br />
is on the rise, so please encourage your anglers to be aware <strong>of</strong> this<br />
growing problem, and consider adopting tournament rules that<br />
discourage the release <strong>of</strong> fish in poor condition following bass<br />
tournaments.<br />
29
Tournament Website<br />
http://www.outdooralabama.com/tournaments/<br />
Type the above link into your web browser to access the page below and post your tournaments or view those<br />
posted by other organizations. This feature is available for all 45 <strong>of</strong> <strong>Alabama</strong>’s public reservoirs and signs are being<br />
placed at each ADCNR public access area to inform anglers <strong>of</strong> the new interactive website.<br />
Select from these<br />
options to see<br />
when and where<br />
tournaments are<br />
being held, or. . .<br />
Click here to<br />
bring up the<br />
page below and<br />
post your own<br />
tournament.<br />
On this page, you can<br />
post specific information<br />
about your tournament<br />
and include contact<br />
information, a link to<br />
your website, or even a<br />
copy <strong>of</strong> your tournament<br />
registration form.<br />
Please let other tournament fishermen know about this website, and if you have questions or comments<br />
call 334-242-3471. This website exists for your convenience and we welcome any suggestions you might have<br />
that would improve this valuable tool.<br />
30
Boating Access<br />
The <strong>Alabama</strong> Division <strong>of</strong> Wildlife &<br />
Freshwater Fisheries maintains 118 public<br />
boating access areas statewide. Several <strong>of</strong><br />
these facilities received upgrades during <strong>2011</strong>.<br />
Tornado Clean Up<br />
Six boat ramps received direct hits or<br />
major damage during the April 27 th tornadoes.<br />
Much <strong>of</strong> the boating access effort during <strong>2011</strong><br />
was directed at clearing downed trees and<br />
repairing other storm-related damage.<br />
Wetumpka City Ramp (Coosa River)<br />
This is a new facility constructed on land<br />
leased from the City <strong>of</strong> Wetumpka, which is<br />
responsible for the daily routine maintenance <strong>of</strong><br />
the area. Construction began in Fall 2010, but<br />
was completed during Spring <strong>2011</strong>. It includes<br />
a 20 foot wide launching slab, paved parking for<br />
20 trailers, and a gravel overflow parking area<br />
more than an acre in size. Tornado clean-up<br />
and high water levels delayed the completion <strong>of</strong><br />
Construction <strong>of</strong> the South Sauty Public Boat Ramp, Lake Guntersville.<br />
the courtesy pier, which will be added during Summer 2012. This facility Spann’s Landing (Pea River)<br />
is located on the west side <strong>of</strong> the river in downtown Wetumpka.<br />
This access area has been in existence for a number <strong>of</strong> years,<br />
where constant use and undermining from water currents had<br />
South Sauty (Lake Guntersville)<br />
caused serious damage to the launching slab. The old launching slab<br />
With the popularity <strong>of</strong> Lake Guntersville during the past several<br />
was demolished and a new one constructed during Fall <strong>2011</strong>.<br />
years, existing public access has not been adequate during peak fishing Construction timing was perfect and allowed the slab to be built<br />
seasons. To help remedy this problem, South Sauty was chosen for a<br />
during very low water levels, which allowed the toe <strong>of</strong> the slab to be<br />
major renovation and expansion. This site was selected because it was positioned in the deepest water possible. This ramp had traditionally<br />
located in an area <strong>of</strong> the lake that <strong>of</strong>fers excellent fishing and had<br />
been difficult to use during low water periods, which should no longer<br />
particularly limited public access. This site was also desirable because<br />
be an issue.<br />
it included several acres <strong>of</strong> undeveloped property that was suitable for<br />
parking lot expansion. This access area was originally constructed<br />
Other Projects (Statewide)<br />
during the mid-1960’s, and had received only minor upgrades since that<br />
Due to the extensive damage caused by tornadoes, no other<br />
time.<br />
significant projects were completed during <strong>2011</strong>. However, a number<br />
Prior to renovation, it was a primitive facility with a single lane<br />
<strong>of</strong> parking lots were re-striped, courtesy piers repaired, and signage<br />
launching slab, a small courtesy pier, and dirt parking for about five rigs. replaced, as needed.<br />
Upon completion, it will include a large, three-lane launching slab, ample<br />
security lighting, two 40-ft. courtesy piers, and parking for 75 rigs. The<br />
entrance will also be relocated to accommodate better traffic flow within<br />
the project boundaries, and all aspects will be fully ADA compliant.<br />
Construction was initiated during the fall <strong>of</strong> <strong>2011</strong>, but will not be<br />
finished until April, 2012. Once completed, South Sauty will have the<br />
distinction <strong>of</strong> being the largest public access area on Lake Guntersville<br />
and should help to take some <strong>of</strong> the pressure <strong>of</strong>f <strong>of</strong> the other boat ramps<br />
throughout the lake.<br />
31
The <strong>Department</strong> <strong>of</strong> Conservation and Natural Resources does not discriminate on the<br />
basis <strong>of</strong> race, color, religion, age, gender, national origin, or disability in its hiring<br />
or employment practices nor in admission to, or operations <strong>of</strong> its programs, services,<br />
or activities. This publication is available in alternative formats.
SPORT FISH<br />
R EST OR ATI O N