6 - Eurostat - Europa
6 - Eurostat - Europa
6 - Eurostat - Europa

You also want an ePaper? Increase the reach of your titles
YUMPU automatically turns print PDFs into web optimized ePapers that Google loves.
Structural business statistics
6 Structural business statistics<br />
Introduction<br />
What effects do the European Union’s economic<br />
and regional policies have on the business<br />
structure of the regions? What sectors are<br />
growing, what sectors are contracting and what<br />
regions are likely to be most affected? A detailed<br />
analysis of the structure of the European economy<br />
can only be made at regional level. Regional<br />
structural business statistics (SBS) provide data<br />
with a detailed activity breakdown that can be<br />
used for this kind of analysis. The first part of<br />
this chapter looks at regional specialisation and<br />
business concentration within the EU’s business<br />
economy. The second part analyses the activity of<br />
the business services sector in detail.<br />
Regional specialisation and<br />
business concentration<br />
There are significant disparities between<br />
European regions in terms of the importance of<br />
different activities within the business economy.<br />
While some activities are distributed relatively<br />
evenly across most regions, many others exhibit<br />
a considerable variation in the level of regional<br />
specialisation, often with a few regions having a<br />
particularly high degree of specialisation.<br />
The share of a particular activity within the<br />
business economy gives an idea of which regions<br />
are the most or least specialised in that activity,<br />
regardless of whether the region or the activity<br />
considered is large or small. There are various<br />
reasons for relative specialisation. Depending on<br />
the type of activity, these can include availability of<br />
natural resources, availability of skilled employees,<br />
culture and tradition, cost levels, infrastructure,<br />
legislation, climatic and topographic conditions<br />
and proximity to markets.<br />
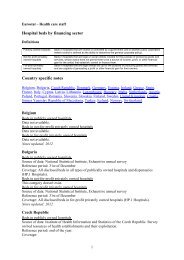
Figure 6.1 shows that, on an aggregate activity<br />
level (NACE sections), the widest spread in the<br />
relative importance of an activity in each region’s<br />
non-financial business economy (NACE sections<br />
C to I and K) workforce was in manufacturing<br />
(NACE section D). Manufacturing accounted<br />
for only 3.7 % of persons employed in Ciudad<br />
Autónoma de Melilla (Spain) and under 10 %<br />
in a further 13 regions, including the capital<br />
regions of Belgium, Spain and the United<br />
Kingdom. The distribution of the remaining<br />
regions was relatively symmetrical, from 10 %<br />
to almost half of the workforce in one Bulgarian<br />
and two Czech regions: Severen tsentralen (BG)<br />
— 48.4 %, Střední Morava (CZ) — 48.1 %, and<br />
Severovýchod (CZ) — 48.2 %. Západné Slovensko<br />
(SK) was the only region where the share of<br />
employment in manufacturing exceeded half<br />
the non-financial business economy workforce<br />
(56.1 %). In contrast, the spread of employment<br />
was much narrower in distributive trades (NACE<br />
section G), which was the activity displaying<br />
the highest median employment, present in all<br />
regions and serving more local clients. Shares<br />
ranged from 11.6 % in Észak-Alföld (Hungary)<br />
and less than 17 % in Åland and Länsi-Suomi<br />
(Finland), Comunidad Foral de Navarra (Spain),<br />
Vzhodna Slovenija (Slovenia) and Severozápad<br />
(the Czech Republic) to around 40 % in Kentriki<br />
Makedonia, Peloponnisos, Voreio Aigaio, Dytiki<br />
Ellada (Greece) and Ciudad Autónoma de Melilla<br />
(Spain) and over 45 % in Kriti (Greece).<br />
On the other hand, transport, storage and<br />
communication (NACE section I) and mining<br />
and quarrying (NACE section C) are two activities<br />
with a similar relative size in most regions, but<br />
where there are a few strong outlier regions that<br />
are highly specialised. Transport, storage and<br />
communication accounted for not more than 6.9 %<br />
in a quarter of the regions and less than 9.8 % in<br />
three quarters of the regions. These narrow ranges<br />
are mainly due to the fact that road transport and<br />
post and telecommunications account for a large<br />
share of employment in this sector and that these<br />
activities tend to be of relatively equal importance<br />
across most regions. In fact, there were only<br />
four regions where the share of employment in<br />
transport, storage and communication exceeded<br />
20 %. The highest specialisation of the Finnish<br />
island region of Åland, where almost half of the<br />
workforce (45.0 %) was employed in this sector,<br />
is due almost exclusively to the importance of<br />
water transport. Åland was far ahead of Köln<br />
in Germany (30.1 %) and Bourgogne in France<br />
(22.6 %), where post and telecommunications<br />
was particularly important, and Bratislavský kraj<br />
(22.3 %), the capital region of Slovakia, owing to<br />
the importance of road and other land transport.<br />
Natural endowments play an important role in<br />
activities of mining and quarrying. Many regions<br />
record little or no such activity, with only very<br />
few regions being highly specialised on account of<br />
deposits of metallic ores, coal, oil or gas. Mining<br />
and quarrying accounted for less than 0.2 % of<br />
persons employed in a quarter of all regions, and<br />
between 0.2 % and 0.5 % in half of the regions.<br />
However, this sector accounted for over 5 % in<br />
five regions and as much as a 10th of the total<br />
102 <strong>Eurostat</strong> regional yearbook 2010 eurostat
eurostat<br />
<strong>Eurostat</strong> regional yearbook 2010<br />
Structural business statistics<br />
Figure 6.1: Degree of regional specialisation by activity (NACE sections), EU-27 and Norway,<br />
by NUTS 2 regions, 2007 ( 1 )<br />
(%, share of non-financial business economy employment)<br />
Distributive trades (G 50–52)<br />
Manufacturing (D 15–37)<br />
Real estate, renting and business<br />
activities (K 70–74) ( 2 )<br />
Construction (F 45)<br />
Transport, storage and communication (I 60–64)<br />
Hotels and restaurants (H 55)<br />
Electricity, gas and water supply (E 40–41)<br />
Mining and quarrying (C 10–14)<br />
Severozapaden (BG31)<br />
Agder og Rogaland (NO04)<br />
Castilla-La Mancha (ES42)<br />
Notio Aigaio (GR42)<br />
Kriti (GR43)<br />
Západné<br />
Slovensko<br />
(SK02)<br />
Inner London (UKI1)<br />
Åland (FI20)<br />
0 % 5 % 10 % 15 % 20 % 25 % 30 % 35 % 40 % 45 % 50 % 55 % 60 % 65 %<br />
( 1 ) Denmark, national level; Malta, data not available; Poland, provisional data; Spain, provisional data for construction (F 45).<br />
( 2 ) Cyprus, excluding research and development (K 73).<br />
Source: <strong>Eurostat</strong> (sbs_r_nuts03).<br />
non-financial business economy workforce in<br />
North Eastern Scotland (United Kingdom) and<br />
Agder og Rogaland (Norway).<br />
Table 6.1 shows which region was the most<br />
specialised in 2007 on a more detailed activity level<br />
(all NACE divisions within each NACE section)<br />
and, as a comparison, the median and average<br />
share of the non-financial business economy<br />
workforce among all regions within the EU-27 and<br />
Norway. Manufacturing activities which involve<br />
the primary processing stages of agricultural,<br />
fishing or forestry products are particularly<br />
concentrated in areas close to the source of the<br />
raw material. The regions most specialised in food<br />
and beverages manufacturing (NACE 15) were all<br />
located in rural areas in or close to agricultural<br />
production centres: Bretagne (the most specialised<br />
of all the regions) in France, Podlaskie, Lubelskie<br />
and Warmińsko-mazurskie in the eastern part of<br />
Poland, Dél-Alföld in Hungary, La Rioja in Spain<br />
and Severen tsentralen and Yuzhen tsentralen<br />
in Bulgaria. Heavily forested Nordic and Baltic<br />
regions were the regions most specialised in the<br />
manufacture of wood and wood products (NACE<br />
20) and in the related manufacturing of pulp,<br />
paper and paper products (NACE 21). Itä-Suomi<br />
(Finland) was the most specialised region in wood<br />
and wood products and Norra Mellansverige<br />
(Sweden) in pulp and paper.<br />
Regions traditionally associated with tourism, in<br />
particular in Spain, Greece and Portugal, were the<br />
most specialised in hotels and restaurants (NACE<br />
55). Hotels and restaurants accounted for more than<br />
20 % of the workforce in the Greek island regions<br />
of Notio Aigaio and Ionia Nisia, the Spanish Illes<br />
Balears, the Algarve in the south of Portugal and<br />
Provincia Autonoma Bolzano/Bozen in the northeast<br />
of Italy on the border with Austria.<br />
Greek regions were the most specialised in<br />
distributive trades (NACE G 50–52), with the<br />
exception of motor trades (NACE 50), where<br />
Germany’s Brandenburg-Südwest had the highest<br />
specialisation. Construction activities (NACE 45)<br />
accounted for the highest shares of the workforce<br />
in Spanish regions. Transport services are also<br />
influenced by location, with water transport<br />
(NACE 61) naturally being important for coastal<br />
regions and islands, while air transport (NACE<br />
62) is important for regions with or close to major<br />
cities and also for island regions (especially those<br />
with a developed tourism industry). The small<br />
island region of Åland (Finland) is a centre for<br />
the ferry services between Sweden and Finland<br />
and other Baltic Sea traffic. Åland was very highly<br />
specialised in water transport, which accounted<br />
for over 35 % of persons employed in 2007, almost<br />
eight times more than the next most specialised<br />
region (Vestlandet) and almost 10 times more<br />
than the third (Agder og Rogaland) (both in<br />
Norway). Outer London was the region most<br />
specialised in air transport, followed by Noord-<br />
Holland (Dutch region of Amsterdam), the Illes<br />
Balears in Spain, Köln in Germany, the French<br />
6<br />
103
6 Structural business statistics<br />
Table 6.1: Most specialised region by activity (NACE sections and divisions), EU-27 and Norway,<br />
2007 ( 1 )<br />
(%, share of total non-financial business economy employment of the region and the median<br />
and average share of all regions)<br />
All regions Most specialised region<br />
Activity (NACE)<br />
Median<br />
share (%)<br />
Average<br />
share (%)<br />
Name (NUTS 2 region)<br />
Share of the<br />
region (%)<br />
Mining and quarrying (C 10–14) 0.3 0.7 Agder og Rogaland (NO04) 13.1<br />
Coal, lignite and peat (10) 0.0 0.2 Śląskie (PL22) c<br />
Crude petroleum and natural gas (11) 0.0 0.2 Agder og Rogaland (NO04) 12.8<br />
Uranium and thorium ores (12) 0.0 0.0 Severovýchod (CZ05) c<br />
Metal ores (13) 0.0 0.0 Övre Norrland (SE33) c<br />
Gewinnung von Steinen und Erden (14) 0.2 0.2 Świętokrzyskie (PL33) c<br />
Manufacturing (D 15–37) 24.9 25.9 Západné Slovensko (SK02) 56.1<br />
Food and beverages (15) 3.6 3.8 Bretagne (FR52) 10.9<br />
Tobacco products (16) 0.0 0.1 Trier (DEB2) c<br />
Textiles (17) 0.4 0.7 Prov. West-vlaanderen (BE25) 5.5<br />
Wearing apparel; fur (18) 0.3 1.0 Dytiki Makedonia (GR13) 11.6<br />
Leather and leather products (19) 0.1 0.3 Marche (ITE3) 7.6<br />
Wood and wood products (20) 0.9 1.2 Itä-Suomi (FI13) 5.7<br />
Pulp, paper and paper products (21) 0.4 0.6 Norra Mellansverige (SE31) 4.5<br />
Publishing and printing (22) 1.0 1.1 Inner London (UKI1) 4.0<br />
Fuel processing (23) 0.0 0.1 Cumbria (UKD1) c<br />
Chemicals and chemical products (24) 1.0 1.3 Rheinhessen-Pfalz (DEB3) 10.9<br />
Rubber and plastic products (25) 1.2 1.4 Auvergne (FR72) 6.3<br />
Other non-metallic mineral products (26) 1.1 1.3 Świętokrzyskie (PL33) 5.4<br />
Basic metals (27) 0.5 1.0 východné Slovensko (SK04) 8.3<br />
Fabricated metal products (28) 2.7 3.0 Arnsberg (DEA5) 8.8<br />
Machinery and equipment (29) 2.2 2.8 Unterfranken (DE26) 12.3<br />
Office machinery and computers (30) 0.0 0.1 Southern and Eastern (IE02) 1.3<br />
Electrical machinery and apparatus (31) 0.9 1.3 Západné Slovensko (SK02) 10.2<br />
Radio, Tv and communication equipment (32) 0.3 0.5 Pohjois-Suomi (FI1A) 5.9<br />
Medical, precision and optical equipment (33) 0.6 0.7 Border, Midland and Western (IE01) 5.5<br />
Motor vehicles and (semi)-trailers (34) 0.8 1.6 Braunschweig (DE91) c<br />
Other transport equipment (35) 0.5 0.8 Sud-Est (RO22) 6.1<br />
Furniture and other manufacturing (36) 1.0 1.4 Warmińsko-mazurskie (PL62) 7.9<br />
Recycling (37) 0.1 0.1 Brandenburg-Nordost (DE41) 0.7<br />
Electricity, gas and water supply (E 40–41) 1.0 1.2 Severozapaden (BG31) 5.3<br />
Electricity, gas and hot water supply (40) 0.8 0.9 Sud-vest Oltenia (RO41) 4.4<br />
Water supply (41) 0.2 0.3 východné Slovensko (SK04) 1.8<br />
Construction (F 45) 10.9 11.2 Castilla-La Mancha (ES42) 29.0<br />
Distributive trades (G 50–52) 25.8 25.7 Kriti (GR43) 46.3<br />
Motor trades (50) 3.5 3.6 Brandenburg-Südwest (DE42) 7.0<br />
Wholesale trade (51) 7.2 7.5 Peloponnisos (GR25) 16.1<br />
Retail trade and repair (52) 14.3 14.6 Kriti (GR43) 31.3<br />
Hotels and restaurants (H 55) 7.1 8.0 Notio Aigaio (GR42) 31.6<br />
Transport, storage and communication (I 60–64) 8.2 8.9 Åland (FI20) 45.0<br />
Real estate activities (60) 4.3 4.5 Bourgogne (FR26) 20.6<br />
Renting (61) 0.1 0.4 Åland (FI20) 35.7<br />
Computer activities (62) 0.0 0.2 Outer London (UKI2) 3.7<br />
Research and development (63) ( 2 ) 1.8 2.0 Bremen (DE50) 13.1<br />
104 <strong>Eurostat</strong> regional yearbook 2010 eurostat
eurostat<br />
<strong>Eurostat</strong> regional yearbook 2010<br />
Structural business statistics<br />
All regions Most specialised region<br />
Activity (NACE)<br />
Median<br />
share (%)<br />
Average<br />
share (%)<br />
Name (NUTS 2 region)<br />
Share of the<br />
region (%)<br />
Post and telecommunications (64) 1.6 1.8 Köln (DEA2) 23.2<br />
Real estate, renting, business activities (K 70–74) 16.9 18.4 Inner London (UKI1) 50.7<br />
Real estate activities (70) 2.0 2.0 Latvija (Lv00) 5.7<br />
Renting (71) 0.4 0.5 North Eastern Scotland (UKM5) 1.7<br />
Computer activities (72) 1.5 1.7 Berkshire, Buckinghamshire<br />
and Oxfordshire (UKJ1)<br />
8.1<br />
Research and development (73) ( 2 ) 0.2 0.3 Oberbayern (DE21) 2.1<br />
Other business activities (74) 12.6 13.8 Inner London (UKI1) 39.8<br />
( 1 ) Denmark, national level; Malta, data not available; Poland, provisional data; Spain, provisional data for construction (F 45).<br />
( 2 ) Cyprus, excluding research and development (K 73).<br />
c: confidential data<br />
Source: <strong>Eurostat</strong> (sbs_r_nuts03).<br />
island of Corse and Portuguese islands in Região<br />
Autónoma dos Açores.<br />
As with air transport, specialisation in real estate,<br />
renting and business activities (NACE 70–74) may<br />
be based on access to a critical mass of clients<br />
(enterprises or households) or to a knowledge base<br />
(external researchers and qualified staff). Within<br />
the countries themselves, the capital region or<br />
other large metropolitan regions were normally<br />
among the most specialised in the business<br />
services sectors: computer services (NACE 72) and<br />
other business activities (NACE 74). A detailed<br />
analysis of the business services sector is included<br />
in the last part of this chapter. Latvia was most<br />
specialised in real estate (NACE 70) in 2007, ahead<br />
of Algarve (Portugal) and Inner London (United<br />
Kingdom), while Hamburg was most specialised in<br />
renting, ahead of the French overseas departments<br />
of Guadeloupe and Martinique.<br />
While an analysis of specialisation shows the<br />
relative importance of different activities in the<br />
regions, regardless of the size of the region or the<br />
activity, an analysis of concentration looks at the<br />
dominance of certain regions within an activity,<br />
or activities within a region. In most activities,<br />
there are many examples of regions that are<br />
highly ranked in terms of both specialisation<br />
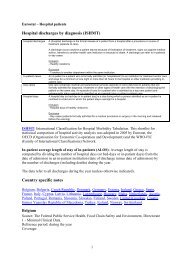
and concentration. Figure 6.2 shows the extent<br />
to which employment in certain activities was<br />
concentrated in a limited number of regions<br />
in 2007. Four of the five mining and quarrying<br />
activities topped the rankings based on the share<br />
of total employment in the EU-27 and Norway, as<br />
accounted for by the 10 regions with the largest<br />
workforces. The most concentrated was the<br />
mining of uranium and thorium ores (NACE 12),<br />
with persons employed in only nine of the 273<br />
regions (for which data are available) in 2007.<br />
Air transport (NACE 62) and leather and leather<br />
products manufacturing (NACE 19) were also<br />
highly concentrated in the 10 largest regions, which<br />
together accounted for 59 % and 51 % of total<br />
employment respectively. In the case of air transport,<br />
this dominance is due to the concentration in large<br />
metropolitan regions where the large airports are<br />
situated: chief among them the regions of Paris,<br />
Outer London, Köln, Amsterdam and Madrid.<br />
Leather and leather products manufacturing, on<br />
the other hand, is a small activity in Europe, heavily<br />
concentrated in Italy, Portugal and Romania:<br />
five of the 10 regions with the largest workforces<br />
were situated in Italy, three in Romania and one<br />
each in Portugal and Spain. The region with the<br />
largest workforce was Toscana in Italy, with 43 000<br />
persons employed. This region alone accounted for<br />
more than 8 % of the total leather manufacturing<br />
workforce in the EU-27 and Norway.<br />
In contrast to the more specialised types of mining<br />
and quarrying, other mining and quarrying<br />
(NACE 14) was among the activities in which the<br />
10 largest regions were least dominant, accounting<br />
for only 17 % of total sectoral employment. This<br />
is due to the widespread availability and local<br />
sourcing of many construction materials, such<br />
as sand and stone, which dominate this type of<br />
mining in most regions. Of all the activities (NACE<br />
divisions), retail trade (NACE 52), food and<br />
beverages manufacturing (NACE 15) and motor<br />
trades (NACE 50) had the lowest concentration<br />
in 2007, but, in contrast to other mining and<br />
quarrying, these are all major activities in terms<br />
of employment in the EU.<br />
Post and telecommunications (NACE 64) and<br />
motor vehicles manufacturing (NACE 34) are<br />
examples of major activities that were relatively<br />
highly concentrated in a few regions.<br />
6<br />
105
6 Structural business statistics<br />
Figure 6.2: Most concentrated activities (NACE divisions), EU-27 and Norway,<br />
by NUTS 2 regions, 2007 ( 1 )<br />
(%, share of regions in total sectoral employment)<br />
Uranium and thorium ores (CA12)<br />
Metal ores (CB 13)<br />
Crude petroleum and natural gas (CA 11)<br />
Coal, lignite and peat (CA 10)<br />
Air transport (I 62)<br />
Leather and leather products (DC 19)<br />
Water transport (I 61)<br />
Post and telecommunications (I 64)<br />
Textiles (DB 17)<br />
Wearing apparel; fur (DB 18)<br />
Tobacco products (DA 16)<br />
Office machinery and computers (DL 30)<br />
Research and development (K 73) ( 2 )<br />
Fuel processing (DF 23)<br />
Computer activities (K 72)<br />
Motor vehicles and (semi)trailers (DM 34)<br />
Chemicals and chemical products (DG 24)<br />
Basic metals (DJ 27)<br />
Real estate activities (K 70)<br />
Radio, TV and communication equipment (DL 32)<br />
Machinery and equipment (DK 29)<br />
Publishing and printing (DE 22)<br />
Renting (K 71)<br />
Medical, precision and optical instruments (DL 33)<br />
Other business activities (K 74)<br />
Supporting transport activities (I 63)<br />
Fabricated metal products (DJ 28)<br />
Construction (F 45)<br />
Electricity, gas and hot water supply (E 40)<br />
Other transport equipment (DM 35)<br />
Furniture and other manufacturing (DN 36)<br />
Electronic machinery and apparatus (DL 31)<br />
Wholesale trade (G 51)<br />
Other non-metallic-mineral products (DI 26)<br />
Land transport and pipelines (I 60)<br />
Wood and wood products (DD 20)<br />
Hotels and restaurants (H 55)<br />
Pulp, paper and paper products (DE 21)<br />
Recycling (DN 37)<br />
Other mining and quarrying (CB 14)<br />
Rubber and plastic products (DH 25)<br />
Water supply (E 41)<br />
Retail trade and repair (G 52)<br />
Food and beverages (DA 15)<br />
Motor trades (G 50)<br />
0 % 10 % 20 % 30 % 40 % 50 % 60 % 70 % 80 % 90 % 100 %<br />
Regions ranked: 1–10 11–20 21–50 51–265<br />
( 1 ) Denmark, national level; Malta, data not available; Poland, provisional data; Spain, provisional data for construction (F 45).<br />
( 2 ) Cyprus, excluding research and development (K 73).<br />
Source: <strong>Eurostat</strong> (sbs_r_nuts03).<br />
106 <strong>Eurostat</strong> regional yearbook 2010 eurostat
eurostat<br />
<strong>Eurostat</strong> regional yearbook 2010<br />
Structural business statistics<br />
Map 6.1: Regional business concentration, by NUTS 2 regions, 2007 ( 1 )<br />
(%, share of the five largest activities (NACE divisions) in total non-financial<br />
business economy employment)<br />
Regional business concentration,<br />
by NUTS 2 regions, 2007 ( 1 )<br />
(%, share of the five largest activities (NACE divisions)<br />
in total non-financial business economy employment)<br />
6 Structural business statistics<br />
Map 6.1 gives an indication of how concentrated<br />
or diversified the regional business economy<br />
was in 2007, measured as the share of the five<br />
largest activities (NACE divisions) in the total<br />
non-financial business economy workforce. The<br />
level of concentration tends to be highest in<br />
regions where trade and services dominate the<br />
business economy, as industrial activities are<br />
more fragmented. By this measure, the most<br />
concentrated regions were generally in countries<br />
traditionally associated with tourism (in particular<br />
Spain, Greece and Portugal), underlining the<br />
importance of construction, trade, and hotels and<br />
restaurants in tourism-oriented regions.<br />
However, high concentrations were also recorded<br />
in several densely populated areas, such as most<br />
parts of the Netherlands, and also the capital<br />
region in most countries (at least relative to the<br />
national average). The situation was similar in<br />
most countries — the capital region was usually<br />
among the regions with the highest business<br />
concentration and was often top of the list.<br />
In contrast, the lowest business concentrations<br />
were recorded mainly in regions with a relatively<br />
small services sector and a large manufacturing<br />
sector in eastern Europe (in particular in<br />
Slovakia, the Czech Republic, Hungary, Romania<br />
and Bulgaria), although low shares were also<br />
recorded in Sweden (except the capital region)<br />
and Finland (except the island region of Åland).<br />
The five largest activities accounted for less than<br />
40 % of total employment in Západné Slovensko<br />
(Slovakia) and Severovýchod (Czech Republic).<br />
Figure 6.3 provides a more detailed analysis of<br />
the most specialised regions. Among the top 10<br />
regions, Inner London stands apart as the only<br />
large metropolitan region with a fundamentally<br />
different business profile. Here, other business<br />
activities dominate, accounting for 40 % of total<br />
employment, which is much higher than in all<br />
the other regions shown. In addition, real estate<br />
activities (NACE division 70) are among the top five<br />
activities in Inner London (and not construction),<br />
whereas in all other regions shown the top five<br />
activities in terms of employment were retail trade,<br />
construction, hotels and restaurants, other business<br />
activities and wholesale trade. In fact, looking at all<br />
regions for which data are available, retail trade is<br />
among the five largest activities (NACE divisions)<br />
in every region (except Észak-Alföld in Hungary),<br />
other business activities is among the five largest<br />
in more than 95 % of the regions, construction in<br />
more than 85 % of the regions, wholesale trade<br />
in more than 80 % of the regions and hotels and<br />
restaurants in more than 65 % of the regions.<br />
Specialisation in business services<br />
The services sector is an important and growing<br />
area of the EU economy which in recent years<br />
has attracted increasing political and economic<br />
interest. In real estate, renting and business<br />
activities (NACE section K) made up a third of this<br />
sector in terms of employment, and was second by<br />
only 6 percentage points to distributive trades.<br />
The importance of this sector, measured as the<br />
share in the total workforce of the non-financial<br />
business economy, has been seen to increase in<br />
recent years. The structure of employment in this<br />
sector is shown in Figure 6.4.<br />
It can be observed that three quarters of the<br />
workforce in 2007 was divided between other<br />
business services (NACE 74), which include many<br />
highly specialised knowledge-intensive activities<br />
such as legal, accounting and management<br />
services, architectural and engineering activities,<br />
advertising and the supply of personnel and<br />
placement services provided by labour recruitment<br />
agencies. Security and industrial cleaning services<br />
are also included, as are secretarial, translation,<br />
packaging and other professional business<br />
services. A significant share of just over 10 %<br />
was taken up by computer activities (NACE 72),<br />
which cover consultancy activities for hardware<br />
and software, data processing activities, database<br />
activities and the maintenance and repair of<br />
office and information technology machinery.<br />
This sector is at the forefront of the information<br />
society, with enterprises that support clients in<br />
a broad range of areas, in almost all economic<br />
activities. It is quite common for enterprises to<br />
outsource their requirements for hardware and<br />
software to specialist providers. The possibility<br />
to trade such services across borders has been<br />
increased by improved telecommunications,<br />
notably growing access to broadband Internet.<br />
Those two divisions together (NACE 72 and 74)<br />
make up the business services sector.<br />
All the divisions within the section of real estate,<br />
renting and business activities noted positive<br />
growth rates of employment in 2007 (see Figure<br />
6.5) and all the rates were significant. The growth<br />
rate for computer activities reached 6.9 % and<br />
for other business activities 5.8 %. The business<br />
services sector was quite clearly one of the most<br />
108 <strong>Eurostat</strong> regional yearbook 2010 eurostat
eurostat<br />
<strong>Eurostat</strong> regional yearbook 2010<br />
Structural business statistics<br />
Figure 6.3: Most specialised regions, EU-27 and Norway,<br />
by NUTS 2 regions, 2007 ( 1 )<br />
(%, share of the five largest activities (NACE divisions) in non-financial business economy<br />
employment of the region)<br />
Melilla (ES64)<br />
Notio Aigaio (GR42)<br />
Ionia Nisia (GR22)<br />
Kriti (GR43)<br />
Algarve (PT15)<br />
Ceuta (ES63)<br />
Inner London (UKI1)<br />
Voreio Aigaio (GR41)<br />
Canarias (ES70)<br />
Illes Balears (ES53)<br />
10.4<br />
12.9<br />
Hotels and restaurants<br />
13.2<br />
16.4<br />
18.5<br />
18.2<br />
22.5<br />
23.9<br />
31.6<br />
30.6<br />
12.1<br />
22.2<br />
3.1<br />
26.6<br />
14.6<br />
25.0<br />
10.8<br />
31.3<br />
17.8<br />
23.2<br />
23.5<br />
20.4<br />
39.8<br />
22.5<br />
23.2<br />
19.7<br />
20.4<br />
13.7<br />
0 % 10 % 20 % 30 % 40 % 50 % 60 % 70 % 80 % 90 % 100 %<br />
12.9<br />
10.5<br />
11.1<br />
12.5<br />
7.5<br />
10.2<br />
6.3<br />
9.4<br />
11.9<br />
9.9<br />
4.8<br />
5.4<br />
7.0<br />
10.4<br />
9.9<br />
8.4<br />
6.0<br />
11.9<br />
10.0<br />
9.1<br />
7.2<br />
8.9<br />
7.4<br />
10,0<br />
24.1<br />
25.3<br />
25.4<br />
26.1<br />
-26.7<br />
Retail trade Construction Other business activities<br />
Wholesale trade Other divisions in top �ve Other divisions (not in top �ve)<br />
( 1 ) Denmark, national level; Malta, data not available; Cyprus, excluding research and development (K 73).Poland, provisional data, Spain, provisional data for construction (F 45).<br />
Source: <strong>Eurostat</strong> (sbs_r_nuts03).<br />
dynamic sectors in the non-financial business<br />
economy in terms of employment growth. One<br />
of the prime reasons for the rapid growth of this<br />
sector could be the outsourcing phenomenon.<br />
Business services can be produced either internally<br />
by the enterprise itself or they can be purchased.<br />
Many enterprises have outsourced some of the<br />
services activities they previously produced<br />
in-house in a bid to procure these services on a<br />
competitive market and thus to reduce costs and<br />
increase flexibility. Business services enterprises<br />
enable their clients to focus on their core business<br />
activities and lessen their need to employ their<br />
own personnel in ancillary or support functions.<br />
Map 6.2 shows how specialised different<br />
regions were in business services, from which<br />
a clear pattern of high concentration in large<br />
metropolitan areas emerges. The capital region<br />
is the most specialised region in all countries<br />
except the Netherlands, where Noord-Holland<br />
(which includes Amsterdam) was just behind<br />
Utrecht, and Germany, where Berlin was just<br />
behind Darmstadt. Of the top 24 regions with<br />
shares exceeding 25 %, seven were British, six<br />
Dutch and four German. Luxembourg (24.2 %)<br />
and the Netherlands were particularly specialised<br />
in these activities, which account for a minimum<br />
of 17 % of persons employed in all Dutch regions.<br />
In the United Kingdom, there is a high degree<br />
of specialisation in the regions around London<br />
and other metropolitan areas such as Greater<br />
Manchester and West Midlands. There is also<br />
a relatively high share of persons employed in<br />
19.7<br />
20.1<br />
20.5<br />
21.1<br />
22.2<br />
6<br />
109
6 Structural business statistics<br />
Figure 6.4: Structure of employment in real estate, renting and business activities (NACE section K)<br />
by divisions, EU-27 and Norway, 2007 ( 1 )<br />
Other business activities (K 74)<br />
74.2 %<br />
Real estate activities (K 70)<br />
11.1 %<br />
( 1 ) Malta, data not available; Cyprus, excluding research and development (K 73); Poland, provisional data.<br />
Source: <strong>Eurostat</strong> (sbs_r_nuts03).<br />
business services in Western Scotland, partly<br />
stemming from the location of many call centres<br />
in the region. A significant cluster of regions<br />
with very high specialisation in business services<br />
is also located in Germany, in a belt from the<br />
region of Oberbayern in the south-eastern part to<br />
Hannover.<br />
Figure 6.6 shows the difference in the degree<br />
of specialisation in business services across<br />
countries and between the regions with the<br />
highest and lowest values in each country. The<br />
graph also clearly illustrates the dominance of<br />
the capital region, which is the most specialised<br />
in all countries except the Netherlands and<br />
Germany. There are equally large differences in<br />
specialisation within these countries as there are<br />
between them.<br />
Business services in the most specialised country,<br />
the Netherlands, account on average for 27.6 %<br />
Renting (K 71)<br />
2.4 %<br />
Computer activities (K 72)<br />
10.7 %<br />
Research and<br />
development (K 73)<br />
1.6 %<br />
of persons employed, around three and a half<br />
times more than in the least specialised country,<br />
Lithuania. The highest difference between the most<br />
and the least specialised region within one country<br />
(5.2 times) was observed in Belgium. At the other<br />
end of the scale are Slovenia, Italy and Ireland,<br />
with a factor lower than 2 differentiating between<br />
the regions with the highest and lowest values.<br />
Employment growth<br />
in business services<br />
Employment in business services in the EU-<br />
27 grew by an impressive 50 % between 1999<br />
and 2007. Map 6.3 shows the growth rate of<br />
employment in 2007 in business services. There<br />
were four Belgian and Romanian and three<br />
French regions included in the list of 25 regions,<br />
with the highest growth rate exceeding 15 %.<br />
Seven regions from the countries that joined<br />
110 <strong>Eurostat</strong> regional yearbook 2010 eurostat
eurostat<br />
<strong>Eurostat</strong> regional yearbook 2010<br />
Structural business statistics<br />
Figure 6.5: Growth rates of employment in real estate, renting and business activities<br />
(NACE section K) by divisions, EU-27 and Norway, 2006–07 ( 1 )<br />
(%)<br />
Real estate, renting, business activities<br />
(K 70-74)<br />
Real estate activities (K 70)<br />
Renting (K 71)<br />
Computer activities (K 72)<br />
Research and development (K 73)<br />
Other business activities (K 74)<br />
0 % 1 % 2 % 3 % 4 % 5 % 6 % 7 % 8 %<br />
( 1 ) Malta, North Eastern Scotland (UKM5) and Highlands and Islands (UKM6), data not available; Cyprus, excluding research and development (K 73); Poland, provisional data.<br />
Source: <strong>Eurostat</strong> (sbs_r_nuts03).<br />
the EU in 2004 or 2007 were in this top list: four<br />
from Romania, two from the Czech Republic and<br />
one from Slovakia.<br />
About one in every seven regions recorded negative<br />
employment growth rates, but in only seven cases<br />
did the decrease reach 10 %. Three of these were<br />
Greek regions and two of them Dutch.<br />
Characteristics of the top<br />
30 most specialised regions<br />
in business services<br />
Figure 6.7 provides information on the top 30<br />
most specialised regions in business services.<br />
The most specialised of all regions is Inner<br />
London (United Kingdom), where just under<br />
700 000 persons — or 45 % of the total nonfinancial<br />
business economy workforce — were<br />
employed in these activities. Only one region<br />
from the countries that joined the EU in 2004<br />
or 2007 is in the top 30: the capital region of the<br />
Czech Republic in 25th place.<br />
The number of persons employed also grew<br />
considerably in many of the top-ranked regions<br />
in 2007, with by far the highest growth rate,<br />
higher than 35 %, in the Belgian capital region.<br />
Strong growth of over 15 % was also recorded<br />
in Darmstadt (Germany). Two thirds of the<br />
regions already with high concentrations in<br />
business services were aiming for even greater<br />
specialisation. Ten regions from the top 30 –<br />
eight Dutch, Cheshire (United Kingdom) and<br />
Prov. Vlaams-Brabant (Belgium) – recorded in<br />
the number of persons employed in business<br />
services, but none of them dropped by more<br />
than 7.5 %.<br />
Conclusion<br />
Regional structural business statistics offer users<br />
wanting to know more about the structure and<br />
development of the regional business economy a<br />
detailed, harmonised data source, describing for<br />
each activity the number of workplaces, number<br />
of persons employed, wage costs and investments<br />
made. This chapter has shown how some of these<br />
data can be used to analyse different regional<br />
business characteristics: the focus, diversity and<br />
specialisation of the regional business economies<br />
and the nature and characteristics of regional<br />
business services activities. The analysis in this<br />
chapter has generally confirmed the positive<br />
expectations for the business services sector,<br />
reinforcing the belief that this area will remain<br />
one of the key drivers of competitiveness and job<br />
creation within the EU economy in the coming<br />
years.<br />
Globalisation, international market liberalisation<br />
and further technological gains are likely to lead<br />
to further integration among Europe’s regions<br />
(and beyond), bringing buyers and sellers of these<br />
services closer together.<br />
6<br />
111
6 Structural business statistics<br />
Map 6.2: Persons employed in business services (NACE divisions K 72 and K 74),<br />
by NUTS 2 regions, 2007 ( 1 )<br />
(%, share in non-financial business economy employment of the region)<br />
Persons employed in business services<br />
(NACE divisions K 72 and K 74),<br />
by NUTS 2 regions, 2007 ( 1 )<br />
(%, share in non-financial business economy employment<br />
of the region)<br />
eurostat<br />
<strong>Eurostat</strong> regional yearbook 2010<br />
Structural business statistics<br />
Figure 6.6: Specialisation in business services (NACE divisions K 72 and K 74), EU-27 and Norway,<br />
by NUTS 2 regions, 2007 ( 1 )<br />
(%, share of non-financial business economy employment)<br />
Netherlands<br />
Luxembourg<br />
United Kingdom<br />
France<br />
Germany<br />
Belgium<br />
Sweden<br />
Ireland<br />
Denmark<br />
Hungary<br />
Norway<br />
Portugal<br />
Spain<br />
Italy<br />
Finland<br />
Austria<br />
Greece<br />
Czech Republic<br />
Estonia<br />
Slovenia<br />
Poland<br />
Slovakia<br />
Romania<br />
Latvia<br />
Bulgaria<br />
Cyprus<br />
Lithuania<br />
Corse<br />
Småland<br />
med öarna<br />
Border, Midland<br />
and Western<br />
0 % 5 % 10 % 15 % 20 % 25 % 30 % 35 % 40 % 45 % 50 % 55 % 60 % 65 % 70 % 75 %<br />
National average<br />
Zeeland Utrecht<br />
Île de France<br />
Stockholm<br />
Southern and Eastern<br />
Dél-Alföld Közép-Magyarország<br />
Oslo og Akershus<br />
Centro (P) Lisboa<br />
Castilla-<br />
La Mancha ( 2 )<br />
Marche Lazio<br />
Åland Etelä-Suomi<br />
Burgenland (A) Wien<br />
Notio<br />
Aigaio<br />
Severovýchod<br />
Vzhodna<br />
Slovenija<br />
Attiki<br />
Zahodna Slovenija<br />
Lubelskie Mazowieckie<br />
Západné<br />
Slovensko<br />
Cornwall and<br />
Isles of Scilly<br />
Nord-Est<br />
Niederbayern Darmstadt<br />
Prov.<br />
Luxembourg<br />
(B) ( 2 )<br />
Hedmark og<br />
Oppland<br />
Praha<br />
Bratislavský kraj<br />
Bucureşti – Ilfov<br />
Comunidad de Madrid<br />
( 1 ) Denmark and Bulgaria, national level; Malta, data not available; Cyprus, excluding research and development (K 73); Poland, provisional data.<br />
( 2 ) 2006.<br />
Source: <strong>Eurostat</strong> (sbs_r_nuts03).<br />
Inner<br />
London<br />
Région de Bruxelles-Capitale<br />
/Brussels Hoofdstedelijk<br />
Gewest<br />
6<br />
113
6 Structural business statistics<br />
Map 6.3: Growth rates of employment in business services (NACE divisions K 72 and K 74),<br />
by NUTS 2 regions, 2006–07 ( 1 )<br />
(%)<br />
Growth rates of employment<br />
in business services<br />
(NACE divisions K 72 and K 74),<br />
by NUTS 2 regions, 2006–07 ( 1 )<br />
(%)<br />
eurostat<br />
<strong>Eurostat</strong> regional yearbook 2010<br />
Structural business statistics<br />
Figure 6.7: Most specialised regions in business services (NACE divisions K 72 and K 74),<br />
EU-27 and Norway, by NUTS 2 regions, 2007 ( 1 )<br />
(%, share of non-financial business economy employment of the region and the region’s share<br />
of total business services employment)<br />
Inner London (UKI1)<br />
Région de Bruxelles-Capitale/ Brussels Hoofdstedelijk Gewest (BE10)<br />
Utrecht (NL31)<br />
Noord-Holland (NL32)<br />
Berkshire, Buckinghamshire and Oxfordshire (UKJ1)<br />
Darmstadt (DE71)<br />
Berlin (DE30)<br />
Groningen (NL11)<br />
Comunidad de Madrid (ES30)<br />
Île de France (FR10)<br />
Zuid-Holland (NL33)<br />
Lisboa (PT17)<br />
Stockholm (SE11)<br />
Prov. Vlaams-Brabant (BE24)<br />
Hamburg (DE60)<br />
Flevoland (NL23)<br />
Surrey, East and West Sussex (UKJ2)<br />
Outer London (UKI2)<br />
Bedfordshire and Hertfordshire (UKH2)<br />
Hampshire and Isle of Wight (UKJ3)<br />
Noord-Brabant (NL41)<br />
Düsseldorf (DEA1)<br />
Oslo og Akershus (NO01)<br />
Greater Manchester (UKD3)<br />
Praha (CZ01)<br />
Wien (AT13)<br />
Cheshire (UKD2)<br />
Luxembourg (Grand-Duché) (LU00)<br />
Overijssel (NL21)<br />
Limburg (NL) (NL42)<br />
0 % 5 % 10 % 15 % 20 % 25 % 30 % 35 % 40 % 45 % 50 %<br />
Region's share of total business<br />
services employment (%)<br />
Share of non-�nancial economy<br />
employment of the region (%)<br />
( 1 ) Denmark, national level; Malta, data not available; Cyprus, excluding research and development (K 73); Poland, provisional data; Spain, provisional data for construction (F 45).<br />
Source: <strong>Eurostat</strong> (sbs_r_nuts03)<br />
6<br />
115
6 Structural business statistics<br />
Methodological notes<br />
Regional structural business statistics (SBS) are collected within the framework of a Council and Parliament regulation,<br />
in accordance with the definitions and breakdowns specified in the Commission regulations implementing it. Data for<br />
the reference year 2007, presented in the chapter, have been collected within the legal framework provided by Council<br />
Regulation (EC, Euratom) No 58/97 of 20 December 1996 concerning structural business statistics. The data cover all the<br />
EU Member States and Norway. Data at NUTS 2 level in the 2006 classification were unavailable for Denmark. These and<br />
other SBS data sets are available on <strong>Eurostat</strong>’s website (www.ec.europa.eu/eurostat) on the tag ‘Statistics’, under the theme<br />
‘Industry, trade and services’/‘Structural Business Statistics’. Selected publications, data and background information are<br />
available in this section of the <strong>Eurostat</strong> website dedicated to European business — see the special topic on regional structural<br />
business statistics. Most data series are continuously updated and revised where necessary. This chapter reflects the data<br />
situation in March 2010.<br />
Structural business statistics are presented by sectors of activity according to the NACE Rev. 1.1 classification, with a<br />
breakdown to two-digit level (NACE divisions). The data presented here are restricted to the non-financial business economy.<br />
The non-financial business economy includes sections C (Mining and quarrying), D (Manufacturing), E (Electricity, gas<br />
and water supply), F (Construction), G (Wholesale and retail trade), H (Hotels and restaurants), I (Transport, storage and<br />
communication) and K (Real estate, renting and business activities). It excludes agricultural, forestry and fishing activities<br />
and public administration and other non-market services (such as education and health, which are currently not covered<br />
by the SBS), as well as financial services (NACE section J).<br />
The observation unit for regional SBS data is the local unit, which is an enterprise or part of an enterprise situated in a<br />
geographically identified place. Local units are classified into sectors (by NACE) according to their main activity. At national<br />
level, the statistical unit is the enterprise. An enterprise can consist of several local units. It is possible for the principal<br />
activity of a local unit to differ from that of the enterprise to which it belongs. Hence, national and regional structural<br />
business statistics are not entirely comparable. It should be noted that in some countries the activity code assigned is based<br />
on the principal activity of the enterprise in question.<br />
Regional data are available at NUTS 2 level for a limited set of variables: the number of local units, wages and salaries, the<br />
number of persons employed and investments in tangible goods. The latter variable is collected on an optional basis, except<br />
for Industry (NACE sections C to E), which has more limited availability of data than for the other variables.<br />
Structural business statistics define number of persons employed as the total number of persons who work (paid or unpaid)<br />
in the observation unit, as well as persons who work outside the unit who belong to it and are paid by it. It includes working<br />
proprietors, unpaid family workers, part-time workers and seasonal workers, etc.<br />
116 <strong>Eurostat</strong> regional yearbook 2010 eurostat