More than 9 million persons employed in the ... - Eurostat - Europa
More than 9 million persons employed in the ... - Eurostat - Europa
More than 9 million persons employed in the ... - Eurostat - Europa

Create successful ePaper yourself
Turn your PDF publications into a flip-book with our unique Google optimized e-Paper software.
Industry, trade and services<br />
Authors: Claudia PELZER, Vaida BAKSYTE<br />
Statistics <strong>in</strong> focus<br />
101/2009<br />
<strong>More</strong> <strong>than</strong> 9 <strong>million</strong> <strong>persons</strong> <strong>employed</strong><br />
<strong>in</strong> <strong>the</strong> hotels and restaurants sector <strong>in</strong> <strong>the</strong> EU<br />
In 2006, <strong>the</strong>re were 1.7 <strong>million</strong> enterprises <strong>in</strong> <strong>the</strong><br />
EU-27 hotels and restaurants sector, employ<strong>in</strong>g<br />
some 9.3 <strong>million</strong> people. This corresponded to<br />
8.3 % of <strong>the</strong> non-f<strong>in</strong>ancial bus<strong>in</strong>ess economy's<br />
(NACE Rev. 1.1 Sections C to I and K)<br />
enterprise population and 7.1 % of its<br />
workforce.<br />
Hotels and restaurants recorded value added of<br />
EUR 181.9 billion <strong>in</strong> <strong>the</strong> EU-27, which<br />
represented 3.2 % of <strong>the</strong> total for <strong>the</strong> nonf<strong>in</strong>ancial<br />
bus<strong>in</strong>ess economy.<br />
In 2008, women made up 55% of <strong>the</strong> workforce<br />
<strong>in</strong> this sector and 28% worked part time.<br />
Specialisations with<strong>in</strong> this activity are strongly<br />
related to climate, natural or man-made<br />
attractions (beaches, mounta<strong>in</strong>s, castles, etc), as<br />
well as proximity to a critical mass of potential<br />
customers (<strong>in</strong> particular for restaurants and<br />
bars). It is <strong>the</strong>refore no surprise to f<strong>in</strong>d that <strong>the</strong><br />
island dest<strong>in</strong>ation of Cyprus is <strong>the</strong> most<br />
specialised Member State, while some regions <strong>in</strong><br />
Greece, Portugal, Spa<strong>in</strong> and Austria are also<br />
highly specialised <strong>in</strong> <strong>the</strong>se activities<br />
(specialisation <strong>in</strong>dices for value added or<br />
employment may be def<strong>in</strong>ed as <strong>the</strong> share of <strong>the</strong><br />
hotels and restaurants sector with<strong>in</strong> <strong>the</strong><br />
country’s non-f<strong>in</strong>ancial bus<strong>in</strong>ess economy,<br />
expressed <strong>in</strong> percentage terms).<br />
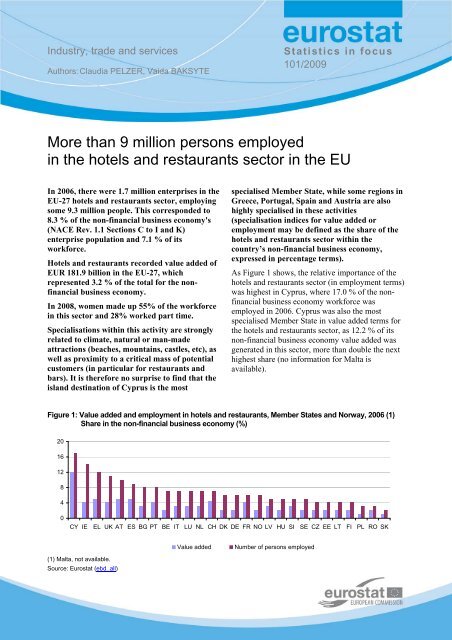
As Figure 1 shows, <strong>the</strong> relative importance of <strong>the</strong><br />
hotels and restaurants sector (<strong>in</strong> employment terms)<br />
was highest <strong>in</strong> Cyprus, where 17.0 % of <strong>the</strong> nonf<strong>in</strong>ancial<br />
bus<strong>in</strong>ess economy workforce was<br />
<strong>employed</strong> <strong>in</strong> 2006. Cyprus was also <strong>the</strong> most<br />
specialised Member State <strong>in</strong> value added terms for<br />
<strong>the</strong> hotels and restaurants sector, as 12.2 % of its<br />
non-f<strong>in</strong>ancial bus<strong>in</strong>ess economy value added was<br />
generated <strong>in</strong> this sector, more <strong>than</strong> double <strong>the</strong> next<br />
highest share (no <strong>in</strong>formation for Malta is<br />
available).<br />
Figure 1: Value added and employment <strong>in</strong> hotels and restaurants, Member States and Norway, 2006 (1)<br />
Share <strong>in</strong> <strong>the</strong> non-f<strong>in</strong>ancial bus<strong>in</strong>ess economy (%)<br />
20<br />
16<br />
12<br />
8<br />
4<br />
0<br />
CY IE EL UK AT ES BG PT BE IT LU NL CH DK DE FR NO LV HU SI SE CZ EE LT FI PL RO SK<br />
(1) Malta, not available.<br />
Source: <strong>Eurostat</strong> (ebd_all)<br />
Value added Number of <strong>persons</strong> <strong>employed</strong>
Structural profile of hotels and restaurants <strong>in</strong> <strong>the</strong> EU-27<br />
Table 1 provides more detailed <strong>in</strong>formation on<br />
<strong>the</strong> EU-27 hotels and restaurants sector, which<br />
generated EUR 433.7 billion of turnover <strong>in</strong> 2006<br />
of which EUR 181.9 billion was value added.<br />
These figures equated to 2.0 % and 3.2 % of<br />
non-f<strong>in</strong>ancial bus<strong>in</strong>ess economy totals.<br />
In <strong>the</strong> EU-27, restaurants, bars, canteens and<br />
cater<strong>in</strong>g (NACE Groups 55.3 to 55.5) was <strong>the</strong><br />
larger of <strong>the</strong> two aggregates that make-up <strong>the</strong><br />
hotels and restaurants sector, contribut<strong>in</strong>g almost<br />
two thirds (64.0%) of <strong>the</strong> value added <strong>in</strong> 2006,<br />
while employ<strong>in</strong>g around three quarters (75.3%)<br />
of <strong>the</strong> workforce.<br />
Measured as <strong>the</strong> average value added generated<br />
by each person <strong>employed</strong>, apparent labour<br />
productivity stood at EUR 19 600 for <strong>the</strong> whole<br />
of <strong>the</strong> hotels and restaurants sector <strong>in</strong> <strong>the</strong> EU-27<br />
<strong>in</strong> 2006.<br />
Apparent labour productivity by subsector was<br />
considerably higher for hotels, camp<strong>in</strong>g sites,<br />
o<strong>the</strong>r provision of short-stay accommodation<br />
(EUR 28 600), <strong>than</strong> for restaurants, bars,<br />
canteens and cater<strong>in</strong>g (EUR 16 700).<br />
The employment figures used for <strong>the</strong> calculation<br />
of apparent labour productivity are likely to be<br />
over-stated to some degree for hotels and<br />
restaurants, given that this measure is based on<br />
head counts and this activity had <strong>the</strong> highest<br />
<strong>in</strong>cidence of part-time employment among <strong>the</strong><br />
NACE sections that make up <strong>the</strong> non-f<strong>in</strong>ancial<br />
bus<strong>in</strong>ess economy. This may, <strong>in</strong> part, expla<strong>in</strong><br />
why <strong>the</strong> hotels and restaurants sector recorded<br />
<strong>the</strong> lowest level of apparent labour productivity,<br />
at approximately half <strong>the</strong> non-f<strong>in</strong>ancial services<br />
average (EUR 39 700).<br />
With<strong>in</strong> <strong>the</strong> restaurants, bars, canteens and<br />
cater<strong>in</strong>g subsector <strong>the</strong>re was a relatively low<br />
share of paid employees, 79.6 % (<strong>in</strong>dicat<strong>in</strong>g a<br />
Table 1: Structural profile of hotels and restaurants, EU-27, 2006<br />
Number of<br />
enterprises<br />
Number of<br />
<strong>persons</strong><br />
<strong>employed</strong> Turnover<br />
large number of work<strong>in</strong>g proprietors and unpaid<br />
family workers), while <strong>the</strong> 89.9 % share<br />
recorded for hotels, camp<strong>in</strong>g sites, o<strong>the</strong>r<br />
provision of short-stay accommodation was<br />
above <strong>the</strong> non-f<strong>in</strong>ancial bus<strong>in</strong>ess economy<br />
average.<br />
Details for <strong>the</strong> Member States, as presented <strong>in</strong><br />
Table 2, show that with EUR 41.7 billion of<br />
value added <strong>in</strong> 2006, <strong>the</strong> hotels and restaurants<br />
sector <strong>in</strong> <strong>the</strong> United K<strong>in</strong>gdom was <strong>the</strong> largest <strong>in</strong><br />
<strong>the</strong> EU, contribut<strong>in</strong>g more <strong>than</strong> a fifth of <strong>the</strong> EU-<br />
27 total. The United K<strong>in</strong>gdom also reported <strong>the</strong><br />
largest workforce, with some 1.9 <strong>million</strong> <strong>persons</strong><br />
work<strong>in</strong>g <strong>in</strong> <strong>the</strong> hotels and restaurants sector.<br />
Among each of <strong>the</strong> Member States for which<br />
data are available, <strong>the</strong> contribution of <strong>the</strong> hotels<br />
and restaurants sector to non-f<strong>in</strong>ancial bus<strong>in</strong>ess<br />
economy value added was consistently lower<br />
<strong>than</strong> <strong>the</strong> correspond<strong>in</strong>g share of employment,<br />
reflect<strong>in</strong>g <strong>the</strong> labour-<strong>in</strong>tensive nature of <strong>the</strong>se<br />
activities.<br />
In 2006, average personnel costs per employee<br />
(EUR 15 600) <strong>in</strong> <strong>the</strong> EU-27 hotels and<br />
restaurants sector were among <strong>the</strong> lowest<br />
recorded across <strong>the</strong> whole of <strong>the</strong> non-f<strong>in</strong>ancial<br />
bus<strong>in</strong>ess economy. These low levels reflect <strong>the</strong><br />
high use of part-time and seasonal employment<br />
and <strong>the</strong> relatively low or unskilled workforce.<br />
Table 1 shows that total <strong>in</strong>vestment by <strong>the</strong> EU-<br />
27 hotels and restaurants sector was equivalent<br />
to 19.4% of its value added <strong>in</strong> 2006 and was<br />
significantly higher for hotels, camp<strong>in</strong>g sites,<br />
o<strong>the</strong>r provision of short-stay accommodation<br />
(29.8 %) <strong>than</strong> for restaurants, bars, canteens and<br />
cater<strong>in</strong>g subsector (13.5 %). Investment rates<br />
were frequently above 20 %, ris<strong>in</strong>g to over 50 %<br />
<strong>in</strong> six of <strong>the</strong> Member States that have jo<strong>in</strong>ed <strong>the</strong><br />
EU s<strong>in</strong>ce 2004 (Table 2).<br />
Value<br />
added<br />
Apparent<br />
labour<br />
product.<br />
(EUR 1 000/<br />
pers. emp.)<br />
Gross<br />
operat<strong>in</strong>g<br />
rate<br />
2 101/2009 — Statistics <strong>in</strong> focus<br />
Invest.<br />
rate<br />
(1 000)<br />
(EUR <strong>million</strong>)<br />
(%)<br />
Hotels and restaurants<br />
Hotels; camp<strong>in</strong>g sites, o<strong>the</strong>r provision of<br />
1 682 9 266 433 696 181 912 19.6 14.6 19.4<br />
short-stay accommodation<br />
Restaurants; bars; canteens and<br />
259 2 287 135 108 65 413 28.6 18.7 29.8<br />
cater<strong>in</strong>g<br />
Source: <strong>Eurostat</strong> (sbs_na_1a_se)<br />
1 423 6 978 298 588 116 499 16.7 12.8 13.5
Table 2: Hotels and restaurants <strong>in</strong> <strong>the</strong> EU Member States and Norway, 2006<br />
Number of<br />
<strong>persons</strong><br />
<strong>employed</strong> Turnover<br />
Value<br />
added<br />
Gross<br />
tangible<br />
<strong>in</strong>vest.<br />
Average<br />
personnel<br />
costs<br />
(EUR 1 000)<br />
Apparent<br />
labour<br />
prod.<br />
Wage<br />
adjusted<br />
labour<br />
prod. ratio<br />
Gross<br />
operat<strong>in</strong>g<br />
rate<br />
Invest.<br />
rate<br />
(1 000) (EUR <strong>million</strong>) (/ employee) (/ person empl.)<br />
(%)<br />
EU-27 9 266 433 696 181 912 35 243 15.6 19.6 126.2 14.6 19.4<br />
BE 166 10 179 3 723 772 18.1 22.4 124.0 15.0 20.7<br />
BG 115 1 077 328 391 1.6 2.9 176.3 15.9 119.3<br />
CZ 158 3 969 1 259 273 6.7 7.9 118.5 11.7 21.7<br />
DK 105 5 352 2 298 336 16.8 22.0 130.9 13.2 14.6<br />
DE 1 316 48 989 23 225 1 605 12.6 17.7 139.8 19.0 6.9<br />
EE 19 434 160 44 5.7 8.6 151.7 12.9 27.6<br />
IE 149 8 531 3 407 740 18.0 22.9 127.2 11.3 21.7<br />
EL 304 9 475 3 457 1 323 14.3 11.4 79.5 12.9 38.3<br />
ES 1 259 58 406 25 172 4 228 17.6 20.0 113.8 13.9 16.8<br />
FR 915 66 493 28 529 7 053 26.9 31.2 116.1 9.4 24.7<br />
IT 1 115 60 364 21 993 5 847 19.5 19.7 100.9 13.7 26.6<br />
CY 38 1 683 919 97 17.8 23.9 133.8 21.2 2.5<br />
LV 31 509 225 148 3.3 7.4 220.4 24.2 65.7<br />
LT 39 476 165 110 3.3 4.3 129.3 9.3 66.9<br />
LU 16 1 027 492 23 24.6 31.7 128.9 15.7 4.7<br />
HU 127 2 569 702 166 5.3 5.5 105.2 5.5 23.6<br />
MT : : : : : : : : :<br />
NL 345 15 578 6 610 668 12.9 19.2 148.3 17.4 10.1<br />
AT 243 13 143 6 390 1 136 21.0 26.3 125.5 17.6 17.8<br />
PL 231 4 504 1 518 391 5.1 6.6 127.5 16.7 25.7<br />
PT 276 8 880 3 072 1 246 8.9 11.1 124.9 8.9 40.6<br />
RO 122 2 030 564 599 2.6 4.6 181.3 12.9 106.2<br />
SI 32 1 228 462 234 12.8 14.4 112.8 9.5 50.6<br />
SK 22 453 174 110 5.2 8.0 155.0 13.8 63.1<br />
FI 55 4 855 1 806 181 27.1 32.8 121.2 9.6 10.0<br />
SE 124 8 688 3 294 630 24.9 26.5 106.4 8.3 19.1<br />
UK 1 927 94 309 41 710 6 860 13.5 21.6 160.5 18.3 16.4<br />
NO 84 5 848 2 448 279 25.1 29.3 116.8 7.9 11.4<br />
Source: <strong>Eurostat</strong> (ebd_all)<br />
Micro and small enterprises dom<strong>in</strong>at<strong>in</strong>g <strong>the</strong> sector<br />
A large proportion of <strong>the</strong> value added created <strong>in</strong> <strong>the</strong><br />
EU-27 hotels and restaurants sector was<br />
concentrated <strong>in</strong> micro or small enterprises (those<br />
with less <strong>than</strong> 49 <strong>persons</strong> <strong>employed</strong>). Toge<strong>the</strong>r,<br />
micro and small enterprises generated 62.7 % of<br />
<strong>the</strong> sector’s value added <strong>in</strong> 2006, and <strong>employed</strong><br />
71.5 % of its workforce <strong>in</strong> 2005 – approximately<br />
20 percentage po<strong>in</strong>ts higher <strong>than</strong> <strong>the</strong> correspond<strong>in</strong>g<br />
shares for enterprises of this size with<strong>in</strong> <strong>the</strong> whole<br />
of <strong>the</strong> non-f<strong>in</strong>ancial bus<strong>in</strong>ess economy – see<br />
Table 3.<br />
Among <strong>the</strong> Member States, <strong>the</strong> United K<strong>in</strong>gdom<br />
(44.9 %) and to a lesser extent <strong>the</strong> Ne<strong>the</strong>rlands<br />
(34.6 %) stood out from <strong>the</strong> o<strong>the</strong>r countries, as<br />
large enterprises (with 250 and more <strong>persons</strong><br />
<strong>employed</strong>) made significant contributions to total<br />
value added with<strong>in</strong> <strong>the</strong> hotels and restaurant sector<br />
<strong>in</strong> 2006.<br />
Table 3: Share of value added and <strong>persons</strong><br />
<strong>employed</strong> by enterprise size class,<br />
EU-27, (%)<br />
Value added Persons <strong>employed</strong><br />
Nonf<strong>in</strong>ancial<br />
bus<strong>in</strong>ess<br />
econ. (1)<br />
Hotels &<br />
restaurants<br />
Statistics <strong>in</strong> focus — 101/2009 3<br />
(2)<br />
Nonf<strong>in</strong>ancial<br />
bus<strong>in</strong>ess<br />
econ. (1)<br />
Hotels &<br />
restaurants<br />
(2)<br />
1 to 9 <strong>employed</strong> 20.2 35.5 29.5 44.7<br />
10 to 49 <strong>employed</strong> 18.8 27.2 20.8 26.8<br />
50-249 <strong>employed</strong> 17.8 13.8 16.8 10.9<br />
250 or + <strong>employed</strong><br />
(1) 2005.<br />
(2) 2006.<br />
43.1 23.5 33.0 17.6<br />
Source: <strong>Eurostat</strong> (sbs_sc_1b_se02, t<strong>in</strong>00053, t<strong>in</strong>00052)
Regional employment: high shares <strong>in</strong> sou<strong>the</strong>rn coastal and island regions<br />
Map 1: Regional employment <strong>in</strong> hotels and restaurants (NACE Rev. 1.1 Section H)<br />
by NUTS 2 regions, 2006<br />
Source: <strong>Eurostat</strong> (sbs_r_nuts03)<br />
The highest proportions of non-f<strong>in</strong>ancial<br />
bus<strong>in</strong>ess economy employment with<strong>in</strong> <strong>the</strong> hotels<br />
and restaurants sector were recorded <strong>in</strong> several<br />
sou<strong>the</strong>rn Member States, as well as <strong>the</strong> United<br />
K<strong>in</strong>gdom – peak<strong>in</strong>g <strong>in</strong> <strong>the</strong> regions of Ionia Nisia<br />
(33.8 %) and Notio Aigaio (29.9 %) – both <strong>in</strong><br />
Greece – followed by regions <strong>in</strong> Portugal, Spa<strong>in</strong><br />
and Italy (often holiday islands). This sector also<br />
provided 15.0 % or more of employment <strong>in</strong> a<br />
few regions <strong>in</strong> <strong>the</strong> United K<strong>in</strong>gdom and Austria,<br />
one Irish and one German region, as well as<br />
Cyprus (which is a s<strong>in</strong>gle NUTS region). In most<br />
of <strong>the</strong> regions <strong>in</strong> <strong>the</strong> United K<strong>in</strong>gdom <strong>the</strong> share is<br />
between 10 and 15 %; this can be expla<strong>in</strong>ed by<br />
<strong>the</strong> very high proportion of part time<br />
employment <strong>in</strong> this sector <strong>in</strong> <strong>the</strong> UK.<br />
4 101/2009 — Statistics <strong>in</strong> focus
Evolution of turnover and employment <strong>in</strong>dices for hotels and restaurants<br />
Figure 2 provides <strong>in</strong>formation on <strong>the</strong> evolution of<br />
EU-27 turnover and employment <strong>in</strong>dices for hotels<br />
and restaurants s<strong>in</strong>ce 2000; <strong>the</strong>se are shown <strong>in</strong><br />
relation to <strong>in</strong>dices for all services collected with<strong>in</strong><br />
short-term bus<strong>in</strong>ess statistics (STS). With almost<br />
un<strong>in</strong>terrupted growth dur<strong>in</strong>g <strong>the</strong> period 2000-2008,<br />
<strong>the</strong> subsequent effects of <strong>the</strong> f<strong>in</strong>ancial crisis are<br />
evident <strong>in</strong> Figure 2.<br />
Figure 2: Turnover and employment <strong>in</strong>dices, EU-27 (2005=100)<br />
130<br />
120<br />
110<br />
100<br />
90<br />
80<br />
70<br />
Jan-00<br />
Jan-01<br />
Jan-02<br />
Jan-03<br />
Jan-04<br />
It is likely that <strong>in</strong> periods of slow growth or<br />
recession, both bus<strong>in</strong>esses and households cut back<br />
on <strong>the</strong>ir expenditure on hotels and restaurants. The<br />
EU-27 hotels and restaurants employment <strong>in</strong>dex<br />
recorded its first reduction <strong>in</strong> January 2008, while<br />
turnover followed a negative trend from March<br />
2008.<br />
Employment, hotels and restaurants Employment, all services<br />
Turnover, hotels and restaurants Turnover, all services<br />
Source: <strong>Eurostat</strong> (sts_selb_m, sts_setu_m, sts_trlb_m, sts_trtu_m)<br />
Women and part-time workers dom<strong>in</strong>at<strong>in</strong>g <strong>the</strong> hotels and restaurants sector<br />
Figure 3 shows that <strong>the</strong> hotels and restaurants<br />
workforce is quite atypical, as it has a relatively<br />
high proportion of women and part-time<br />
workers. This may reflect employment<br />
flexibility, with considerable opportunities for<br />
those seek<strong>in</strong>g work outside of <strong>the</strong> normal n<strong>in</strong>e to<br />
five rout<strong>in</strong>e (for example, students).<br />
Figure 3: Employment characteristics, EU-27, 2008 (% of total workforce)<br />
100<br />
75<br />
50<br />
25<br />
0<br />
Hotels and restaurants Bus<strong>in</strong>ess economy<br />
Males<br />
Females<br />
BY GENDER<br />
Source: <strong>Eurostat</strong> (lfsa_epgana)<br />
Jan-05<br />
Statistics <strong>in</strong> focus — 101/2009 5<br />
Jan-06<br />
Jan-07<br />
Jan-08<br />
Jan-09<br />
In 2008, women made up 55 % of <strong>the</strong> EU-27<br />
workforce, around 10 percentage po<strong>in</strong>ts higher<br />
<strong>than</strong> <strong>the</strong> correspond<strong>in</strong>g share for <strong>the</strong> whole<br />
bus<strong>in</strong>ess economy. Some 72 % of those<br />
<strong>employed</strong> <strong>in</strong> <strong>the</strong> hotels and restaurants sector<br />
worked on a full-time basis, a share that was<br />
well below <strong>the</strong> bus<strong>in</strong>ess economy average<br />
(82.5 %).<br />
100<br />
75<br />
50<br />
25<br />
0<br />
Hotels and restaurants Bus<strong>in</strong>ess economy<br />
Part time<br />
Full time<br />
BY WORKING TIME
Demand for hotels and similar establishments<br />
Table 4: Ma<strong>in</strong> <strong>in</strong>dicators for hotels and similar<br />
establishments, 2007<br />
Number<br />
of hotels<br />
and<br />
similar<br />
establishments<br />
Average<br />
number of<br />
bed<br />
places per<br />
establishment<br />
Nights Tourism<br />
spent <strong>in</strong>tensity<br />
(per<br />
(units)<br />
( 1 000) <strong>in</strong>habitant)<br />
EU-27 202 353 58 1 578 148 3.2<br />
BE 2 013 62 16 197 1.5<br />
BG 1 526 152 16 736 2.2<br />
CZ 4 559 54 27 044 2.6<br />
DK 477 154 11 080 2.0<br />
DE 35 941 46 214 675 2.6<br />
EE 346 83 3 843 2.9<br />
IE 4 087 38 28 282 6.6<br />
EL 9 207 76 64 086 5.7<br />
ES 17 827 92 271 689 6.1<br />
FR 18 135 69 204 269 3.2<br />
IT 34 058 63 254 329 4.3<br />
CY 735 119 14 298 18.4<br />
LV 318 65 2 759 1.2<br />
LT 348 63 2 591 0.8<br />
LU 273 53 1 438 3.0<br />
HU 1 999 77 16 297 1.6<br />
MT 160 250 7 917 19.4<br />
NL 3 196 63 34 159 2.1<br />
AT 14 204 40 79 167 9.6<br />
PL 2 443 78 24 307 0.6<br />
PT 2 031 130 39 737 3.7<br />
RO 4 163 55 19 756 0.9<br />
SI 396 83 5 546 2.8<br />
SK 1 249 54 7 233 1.3<br />
FI 909 131 15 817 3.0<br />
SE 1 893 110 25 416 2.8<br />
UK 39 860 31 169 484 2.8<br />
HR 800 204 20 940 4.7<br />
TR : : 115 967 1.7<br />
IS 294 63 1 917 6.2<br />
LI 47 27 129 3.7<br />
NO 1 112 139 18 510 4.0<br />
CH 5 635 48 36 365 4.8<br />
Source: <strong>Eurostat</strong> (tour_cap_nat, tour_cap_bed, tour_occ_ni)<br />
The largest numbers of hotels and similar<br />
establishments <strong>in</strong> 2007 were <strong>in</strong> <strong>the</strong> United<br />
K<strong>in</strong>gdom, Germany and Italy. However, <strong>the</strong> largest<br />
establishments <strong>in</strong> terms of <strong>the</strong> average number of<br />
bed places were <strong>in</strong> Malta. In terms of <strong>the</strong> number of<br />
nights spent <strong>in</strong> <strong>the</strong>se establishments, Spa<strong>in</strong>, Italy<br />
and Germany recorded <strong>the</strong> highest figures.<br />
Tourism <strong>in</strong>tensity can be measured as <strong>the</strong> average<br />
number of nights spent <strong>in</strong> hotels and similar<br />
establishments per <strong>in</strong>habitant: this ratio is high for<br />
popular tourism dest<strong>in</strong>ations – such as <strong>the</strong> island<br />
dest<strong>in</strong>ations of Malta and Cyprus, as well as<br />
Austria, Ireland and Spa<strong>in</strong>.<br />
Demand patterns are also reflected <strong>in</strong> <strong>the</strong> average<br />
length of stays (nights per arrival). For nonresidents,<br />
this <strong>in</strong>dicator was notably higher <strong>in</strong><br />
Cyprus, Malta, Greece and Bulgaria, followed by<br />
Croatia, Spa<strong>in</strong> and Portugal – all of which are<br />
popular dest<strong>in</strong>ations for summer vacations. In<br />
contrast, resident demand is more likely to be a<br />
result of bus<strong>in</strong>ess travel or alternatively may reflect<br />
<strong>persons</strong> spend<strong>in</strong>g (long) weekends on vacation<br />
with<strong>in</strong> <strong>the</strong>ir own country.<br />
Figure 4: Average number of nights spent<br />
per arrival <strong>in</strong> hotels and similar<br />
establishments, 2007 (1)<br />
0 2 4 6 8<br />
6 101/2009 — Statistics <strong>in</strong> focus<br />
BE<br />
BG<br />
CZ<br />
DK<br />
DE<br />
EE<br />
EL<br />
ES<br />
FR<br />
IT<br />
CY<br />
LV<br />
LT<br />
LU<br />
HU<br />
MT<br />
NL<br />
AT<br />
PL<br />
PT<br />
RO<br />
SI<br />
SK<br />
FI<br />
SE<br />
UK<br />
HR<br />
IS<br />
LI<br />
NO<br />
CH<br />
Residents<br />
Non residents<br />
(1) EU-27 and Ireland, not available.<br />
Source: <strong>Eurostat</strong> (tour_occ_ni, tour_occ_ar)
METHODOLOGICAL NOTES<br />
Structural bus<strong>in</strong>ess statistics<br />
SBS data have been collected with<strong>in</strong> <strong>the</strong> legal framework<br />
provided by Council Regulation No 58/97 of 20 December<br />
1996 concern<strong>in</strong>g structural bus<strong>in</strong>ess statistics, which aims<br />
to provide data which is comparable between <strong>the</strong> Member<br />
States on <strong>the</strong> structure, activity, competitiveness and<br />
performance of bus<strong>in</strong>esses. SBS data for <strong>the</strong> EU-27 may<br />
<strong>in</strong>clude rounded estimates. The classification of activities is<br />
based on NACE Rev. 1.1. The non-f<strong>in</strong>ancial bus<strong>in</strong>ess<br />
economy is def<strong>in</strong>ed as Sections C to I and K.<br />
The number of enterprises is a count of enterprises active<br />
dur<strong>in</strong>g at least a part of <strong>the</strong> reference period.<br />
The number of <strong>persons</strong> <strong>employed</strong> is all <strong>persons</strong> who work<br />
<strong>in</strong> <strong>the</strong> observation unit (<strong>in</strong>clusive of work<strong>in</strong>g proprietors<br />
and unpaid family workers), as well as <strong>persons</strong> who work<br />
outside <strong>the</strong> unit who belong to it and are paid by it. Parttime,<br />
seasonal and home workers on <strong>the</strong> payroll are<br />
<strong>in</strong>cluded, as well as apprentices.<br />
Turnover comprises <strong>the</strong> totals <strong>in</strong>voiced by <strong>the</strong> observation<br />
unit dur<strong>in</strong>g <strong>the</strong> reference period, and this corresponds to<br />
market sales of goods or services supplied to third parties.<br />
Value added (at factor cost) can be calculated from<br />
turnover, plus capitalised production, plus o<strong>the</strong>r operat<strong>in</strong>g<br />
<strong>in</strong>come, plus or m<strong>in</strong>us <strong>the</strong> changes <strong>in</strong> stocks, m<strong>in</strong>us <strong>the</strong><br />
purchases of goods and services, m<strong>in</strong>us o<strong>the</strong>r taxes on<br />
products which are l<strong>in</strong>ked to turnover but not deductible,<br />
m<strong>in</strong>us <strong>the</strong> duties and taxes l<strong>in</strong>ked to production.<br />
Gross tangible <strong>in</strong>vestment <strong>in</strong>cludes new and exist<strong>in</strong>g<br />
capital goods bought or produced for own use hav<strong>in</strong>g a<br />
useful life of more <strong>than</strong> one year, and <strong>in</strong>cludes also land.<br />
The <strong>in</strong>vestment rate is tangible <strong>in</strong>vestment divided by<br />
value added expressed as a percentage.<br />
Apparent labour productivity is calculated as value added<br />
divided by <strong>the</strong> number of <strong>persons</strong> <strong>employed</strong>.<br />
Average personnel costs are calculated as personnel costs<br />
divided by <strong>the</strong> number of (paid) employees.<br />
The wage adjusted labour productivity ratio is calculated<br />
by divid<strong>in</strong>g <strong>the</strong> apparent labour productivity by average<br />
personnel costs, and is expressed a percentage.<br />
The gross operat<strong>in</strong>g rate is <strong>the</strong> gross operat<strong>in</strong>g surplus<br />
divided by turnover, expressed as a percentage. Gross<br />
operat<strong>in</strong>g surplus is calculated as value added less<br />
personnel costs.<br />
Short-term bus<strong>in</strong>ess statistics (STS)<br />
The basic form of an <strong>in</strong>dex is its gross (also known as<br />
unadjusted) form but <strong>in</strong> this publication <strong>the</strong> form used both<br />
for turnover and employment is <strong>the</strong> trend, whereby seasonal<br />
and one-off fluctuations have been removed. Information<br />
for STS is based on NACE Rev. 2. The aggregate for<br />
services required by STS Regulation is def<strong>in</strong>ed as NACE<br />
Rev. 2 Sections G to J and L to N exclud<strong>in</strong>g head office<br />
management (70.1), scientific research and development<br />
(72), veter<strong>in</strong>ary activities (75), rent<strong>in</strong>g and leas<strong>in</strong>g (77),<br />
comb<strong>in</strong>ed facilities (81.1) and landscape activities (81.3).<br />
The turnover <strong>in</strong>dex reflects <strong>the</strong> totals <strong>in</strong>voiced by <strong>the</strong><br />
observation unit dur<strong>in</strong>g <strong>the</strong> reference period. This<br />
corresponds to market sales of goods or services supplied to<br />
third parties.<br />
The employment <strong>in</strong>dex shows <strong>the</strong> evolution of <strong>the</strong> number<br />
of <strong>persons</strong> <strong>employed</strong>.<br />
Tourism data<br />
These data are collected with<strong>in</strong> <strong>the</strong> legal framework provided<br />
by Council Directive 95/57/EC of November 1995.<br />
The number of establishments is a count of establishments<br />
whose capacity exceeds <strong>the</strong> national m<strong>in</strong>imum even if <strong>the</strong><br />
major part of turnover may come from restaurants or o<strong>the</strong>r<br />
services. Due to methodological differences between<br />
countries <strong>in</strong> <strong>the</strong> coverage of enterprises (e.g. data collection<br />
thresholds <strong>in</strong> terms of m<strong>in</strong>imum number of bedplaces), <strong>the</strong><br />
data on capacity is not necessarily comparable across <strong>the</strong> EU.<br />
The number of bed places is determ<strong>in</strong>ed by <strong>the</strong> number of<br />
<strong>persons</strong> who can stay overnight <strong>in</strong> <strong>the</strong> beds set up <strong>in</strong> <strong>the</strong><br />
establishment (dwell<strong>in</strong>g), ignor<strong>in</strong>g any extra beds that may<br />
be set up by customer request. The term bed place applies<br />
to a s<strong>in</strong>gle bed, a double bed be<strong>in</strong>g counted as two bed<br />
places.<br />
The arrival of residents and non-residents is def<strong>in</strong>ed as a<br />
person who arrives at (leaves) a hotel or similar<br />
establishment and checks <strong>in</strong> (out).<br />
The nights spent by residents and non-residents are each<br />
night that a guest actually spends (sleeps or stays) or is<br />
registered (his/her physical presence <strong>the</strong>re be<strong>in</strong>g unnecessary).<br />
Tourism <strong>in</strong>tensity is <strong>the</strong> average number of nights spent <strong>in</strong><br />
hotels and similar establishments per <strong>in</strong>habitant.<br />
Abbreviations and symbols<br />
EU-27 European Union of 27 Member States<br />
BE Belgium<br />
BG Bulgaria<br />
CZ Czech Republic<br />
DK Denmark<br />
DE Germany<br />
EE Estonia<br />
IE Ireland<br />
EL Greece<br />
ES Spa<strong>in</strong><br />
FR France<br />
IT Italy<br />
CY Cyprus<br />
LV Latvia<br />
LT Lithuania<br />
LU Luxembourg<br />
HU Hungary<br />
MT Malta<br />
NL Ne<strong>the</strong>rlands<br />
AT Austria<br />
PL Poland<br />
PT Portugal<br />
RO Romania<br />
SI Slovenia<br />
SK Slovakia<br />
FI F<strong>in</strong>land<br />
SE Sweden<br />
UK United K<strong>in</strong>gdom<br />
HR Croatia<br />
TR Turkey<br />
IS Island<br />
LI Liechtenste<strong>in</strong><br />
NO Norway<br />
CH Switzerland<br />
: (<strong>in</strong> tables) not available<br />
Statistics <strong>in</strong> focus — 101/2009 7
Fur<strong>the</strong>r <strong>in</strong>formation<br />
<strong>Eurostat</strong> Website: http://ec.europa.eu/eurostat<br />
Data on “Structural Bus<strong>in</strong>ess Statistics”<br />
http://epp.eurostat.ec.europa.eu/portal/page/portal/european_bus<strong>in</strong>ess/data/database<br />
<strong>More</strong> <strong>in</strong>formation about “Structural Bus<strong>in</strong>ess Statistics”<br />
http://epp.eurostat.ec.europa.eu/portal/page/portal/european_bus<strong>in</strong>ess/<strong>in</strong>troduction<br />
Journalists can contact <strong>the</strong> media support service:<br />
Bech Build<strong>in</strong>g Office A4/125 L - 2920 Luxembourg<br />
Tel. (352) 4301 33408 Fax (352) 4301 35349<br />
E-mail: eurostat-mediasupport@ec.europa.eu<br />
European Statistical Data Support:<br />
<strong>Eurostat</strong> set up with <strong>the</strong> members of <strong>the</strong> ‘European statistical system’ a network of<br />
support centres, which will exist <strong>in</strong> nearly all Member States as well as <strong>in</strong> some EFTA<br />
countries.<br />
Their mission is to provide help and guidance to Internet users of European statistical<br />
data.<br />
Contact details for this support network can be found on our Internet site:<br />
http://ec.europa.eu/eurostat/<br />
A list of worldwide sales outlets is available at <strong>the</strong>:<br />
Office for Official Publications of <strong>the</strong> European Communities.<br />
2, rue Mercier<br />
L - 2985 Luxembourg<br />
URL: http://publications.europa.eu<br />
E-mail: <strong>in</strong>fo@publications.europa.eu<br />
Manuscript completed on: 22.12.2009<br />
Data extracted on: 25.06.2009<br />
ISSN 1977-0316<br />
Catalogue number: KS-SF-09-101-EN-N<br />
© European Union, 2009