Ohm's Law
Ohm's Law
Ohm's Law

Create successful ePaper yourself
Turn your PDF publications into a flip-book with our unique Google optimized e-Paper software.
Ohm’s <strong>Law</strong><br />
Objective:<br />
Firstly, to determine the mathematical relationship between current, potential difference, and<br />
resistance. After this, a comparison will be made of the potential vs current behavior of a resistor<br />
and a light bulb..<br />
Apparatus:<br />
1 Lab Pro Device<br />
1 Ti Graphing Calculator with DATAMATE program installed<br />
1 Adjustable DC power supply<br />
1 Vernier Circuit Board<br />
1 Current and Charge Voltage system<br />
1 Voltimeter<br />
1 Wire<br />
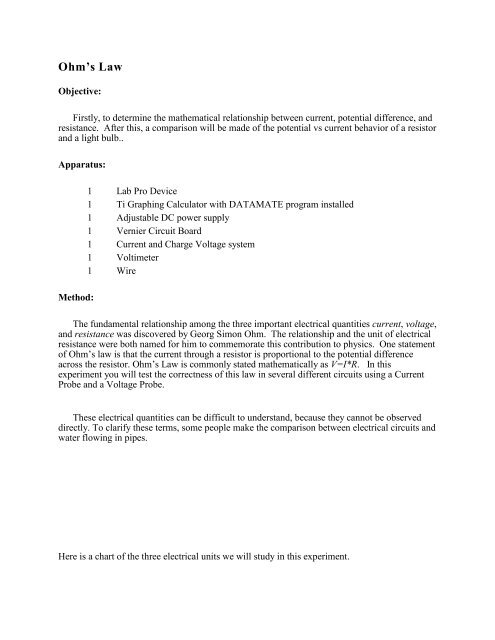
Method:<br />
The fundamental relationship among the three important electrical quantities current, voltage,<br />
and resistance was discovered by Georg Simon Ohm. The relationship and the unit of electrical<br />
resistance were both named for him to commemorate this contribution to physics. One statement<br />
of Ohm’s law is that the current through a resistor is proportional to the potential difference<br />
across the resistor. Ohm’s <strong>Law</strong> is commonly stated mathematically as V=I*R. In this<br />
experiment you will test the correctness of this law in several different circuits using a Current<br />
Probe and a Voltage Probe.<br />
These electrical quantities can be difficult to understand, because they cannot be observed<br />
directly. To clarify these terms, some people make the comparison between electrical circuits and<br />
water flowing in pipes.<br />
Here is a chart of the three electrical units we will study in this experiment.
Electrical Quantity Description Unit Water Analogy<br />
Voltage or Potential<br />
Difference<br />
Current<br />
Resistance<br />
A measure of the Energy<br />
difference per unit charge<br />
between two points in a<br />
circuit.<br />
A measure of the flow of<br />
charge in a circuit.<br />
A measure of how<br />
difficult it is for current to<br />
flow in a circuit.<br />
Volt (V)<br />
Ampere (A)<br />
Ohm ()<br />
Water Pressure<br />
Amount of water<br />
flowing<br />
A measure of how<br />
difficult it is for water<br />
to flow through a pipe.<br />
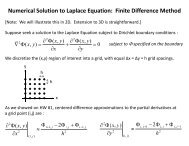
Resistors are labeled with a rated resistance and a percentage tolerance, which specifies how<br />
much the value of resistance may vary from the rated value. The rated resistance value is usually<br />
indicated with a color code. Most ordinary carbon-composition resistors are labeled with four color<br />
bands, as shown below in Figure 1.<br />
Figure 1: Image taken from the12volt.com website<br />
The color codes used for carbon resistors are listed in Table 1 on the next page. The first two<br />
bands are read as a two-digit number. The third is read as a power-of-ten multiplier of that<br />
number. The fourth is the tolerance rating. Tolerance is a percent rating, showing how much the<br />
actual resistance could vary from the labeled value The resistance value of a resistor can be<br />
calculated according to Eqn. 1 below:<br />
(3rd band digit)<br />
Resistance value = (2-digit # from first 2 bands) * 10 Eqn. (1)
Table 1:<br />
Color<br />
Number<br />
for band 1-3<br />
Band #4<br />
Tolerance<br />
Rating<br />
Black 0 ---<br />
Brown 1 ± 1%<br />
Red 2 ± 2%<br />
Orange 3 ---<br />
Yellow 4 ---<br />
Green 5 ± 0.5%<br />
Blue 6 ± 0.25%<br />
Violet 7 ± 0.1%<br />
Gray 8 ± 0.05%<br />
White 9 ---<br />
Gold 0.1 ±5%<br />
Figure 2<br />
Silver 0.01<br />
±10%<br />
Setup:<br />
1. Connect the Current & Voltage Probe System to the LabPro interface:<br />
a. Connect DIN 1 on the Dual Channel Amplifier to Channel 1 of the LabPro or CBL 2 interface.<br />
b. Connect DIN 2 to Channel 2. Then connect a Current Probe to PROBE 1 on the Dual Channel Amplifier<br />
and a Voltage Probe to PROBE 2.<br />
2. Use the black link cable to connect the LabPro interface to the TI Graphing Calculator. Firmly press in the cable<br />
ends.<br />
3. Turn on the calculator and start the DATAMATE program.
Note: If the DATAMATE program is not stored in the calculator, follow the directions in Appendix D-DataMate<br />
Guidebook to transfer the program from the LabPro to your calculator.<br />
4. If CH 1 displays the Current Sensor and CH 2 displays the Voltage Sensor, proceed directly to Step 5. If it does<br />
not, set up your sensors manually. To do this:<br />
a. Select SETUP from the main screen.<br />
b. Press ENTER to select CH 1.<br />
c. Select C V SYSTEM from SELECT SENSOR.<br />
d. Select CV CURRENT (A) from C V SYSTEM.<br />
e. Press DOWN to select CH2 and press ENTER .<br />
f. Select C V SYSTEM from SELECT SENSOR.<br />
g. Select CV VOLTAGE (V) from CV SYSTEM.<br />
h. Select OK once to return to the main screen.<br />
5. Connect the circuit shown in Figure 2:<br />
a. With the power supply turned off, connect the power supply to the input terminal posts on the Vernier Circuit<br />
Board. Note that switch 1 (SW1 SPDT), which is connected to the input terminal posts, is off when in the<br />
“up” position. Keep the switch in the off position when you are not taking measurements.<br />
b. Use wires to connect the DC voltmeter directly to the output terminal posts of the Power Supply. Take care<br />
to connect the positive post to the appropriate input terminal post of the DC voltmeter, depending on the<br />
voltage level needed. You will use the reading on the DC voltmeter when adjusting the Power Supply<br />
voltage.<br />
c. Connect a 10- resistor, wires, the current sensor, and the voltage sensor as shown in Figure 1. Take care<br />
that the positive lead from the power supply and the red terminal from the Current & Voltage Probe are<br />
connected as shown in Figure 2.<br />
Note: Attach the red connectors electrically closer to the positive side of the power supply.<br />
Have your instructor check the arrangement of the wires before proceeding.<br />
6. Now, you will need to zero both probes with no current flowing and with no voltage<br />
applied (power supply off).<br />
a. Select SETUP from the main screen.<br />
b. Select ZERO from the setup screen.<br />
c. Select ALL CHANNELS from SELECT CHANNEL.<br />
d. Press ENTER to zero the sensors.<br />
7. *NOTE: The maximum voltage which can be applied to the input terminals of the circuit<br />
board is 10 VDC. The resettable fuse on the circuit board will be tripped at 0.8A . The<br />
current and voltage readings are shown on the main screen, updated about once a second.
Turn the control on the DC power supply to 0 V and then turn on the power supply.<br />
Slowly increase the potential to 5 V. Monitor the readings on your calculator and describe<br />
what happens to the current through the resistor as the potential difference across the<br />
resistor changes. If the potential doubles, what happens to the current? What type of<br />
relationship do you believe exists between potential difference and current?<br />
Procedure:<br />
1. Set the data collection mode so that the interface will record the potential and current only at<br />
times you specify:<br />
a. Select SETUP from the main screen.<br />
b. Press UP to select MODE and press ENTER.<br />
c. Select SELECTED EVENTS from the SELECT MODE menu.<br />
d. Select OK to return to the main screen.<br />
2. Record the value of the resistor in the Data Table.<br />
3. To collect your first point of current and potential data,<br />
a. Select START from the main screen.<br />
b. Check to see that your power supply is set to 0 V, and then press ENTER<br />
to record the current and potential.<br />
4. Take additional data:<br />
a. Increase the potential on the power supply to approximately 0.5 V.<br />
b. Press ENTER to record another point.<br />
c. Increase the potential by about 0.5 V.<br />
d. Repeat this process until you reach a potential of 5.0 V. After the last point, press<br />
STO> to end data collection.<br />
5. Set the power supply back to 0 V.
6. View a graph of potential vs. current.<br />
a. Press UP to select CH2 VS. CH1.<br />
b. Press ENTER to see a graph of potential vs. current.<br />
7. Are the voltage and current proportional for this resistor? If so, fit a straight line to the data.<br />
a. Press ENTER and select MAIN SCREEN to return to the main screen.<br />
b. Select ANALYZE from the main screen.<br />
c. Select CURVE FIT from the ANALYZE OPTIONS.<br />
d. Select LINEAR (CH2 VS CH1) from the CURVE FIT screen.<br />
e. Record the slope and y-intercept of the regression line in the Data Table, along with their<br />
units.<br />
f. Press ENTER to see your graph and the fitted line.<br />
g. Press ENTER again and then select RETURN TO MAIN SCREEN.<br />
8. Save your data using Logger Pro 3.2 software on the lab computers:<br />
a. Click on the calculator icon located in the menu at the top of the screen.<br />
b. Connect your calculator to the computer using the TI-Connect USB cable<br />
c. Choose TI-GRAPH LINK-USB from the PORT pull-down menu.<br />
d. Click on “Scan for Device”.<br />
e. Select the Lists you want to import, then click OK.<br />
9. Repeat Steps 2 – 8 using a 51 resistor.<br />
10. Replace the resistor in the circuit with a #50 light bulb (round body). Repeat Steps 3 – 6, but
this time increase the voltage in 0.1 V steps up to 1.0 V and in 0.5 V steps from 1 to 5 V.<br />
After you are finished, turn off the Power Supply.<br />
11. Trace across your graph using the cursor keys. Is the slope constant? To compare slopes of<br />
data at different parts of the curve, estimate the slope at the start of the graph (the low-current<br />
end) using the second and third points. Record the slope in the Data Table. Be sure to enter<br />
the units of the slope. In the same way estimate the slope using the last two points. Record<br />
this slope in your Data Table.<br />
Discussion<br />
1. What is the rated tolerance of the each of the resistors used? For each resistor, calculate the<br />
range of resistance values that fall in this tolerance range.<br />
2. As the potential across the resistor increased, the current through the resistor increased. If the<br />
change in current is proportional to the voltage, the data should be in a straight line and it<br />
should go through zero. In these two examples how close is the y-intercept to zero? Is there a<br />
proportional relationship between voltage and current? If so, write the equation for each run<br />
in the form potential = constant current. Use a numerical value for the constant.<br />
3. Compare the constant in each of the above equations to the rated resistance of each resistor.<br />
Calculate the percentage difference between the rated resistance value and the constant. Does<br />
the constant fall in the range of values calculated for the tolerance of the resistor?<br />
4. Do your resistors follow Ohm’s law? Base your answer on your experimental data.<br />
5. What parts of the circuit you constructed, other than the resistor, contributed to the resistance<br />
measured?<br />
6. Describe what happened to the current through the light bulb as the potential increased. Was<br />
the change linear? Since the slope of the linear regression line is a measure of resistance,<br />
describe what happened to the resistance as the voltage increased. Since the bulb gets brighter<br />
as it gets hotter, how does the resistance vary with temperature?<br />
7. Does your light bulb follow Ohm’s law? Base your answer on your experimental data.
Name_______________________Section_________________________Date___________<br />
Data Sheet<br />
Slope of regression<br />
line (V/A)<br />
Y-intercept of<br />
regression line (V)<br />
Resistor<br />
Resistor<br />
<br />
<br />
Light bulb (low current)<br />
Light bulb (high current)