Project Report â Fiji 2010 - Pacific Health Voices
Project Report â Fiji 2010 - Pacific Health Voices
Project Report â Fiji 2010 - Pacific Health Voices

You also want an ePaper? Increase the reach of your titles
YUMPU automatically turns print PDFs into web optimized ePapers that Google loves.
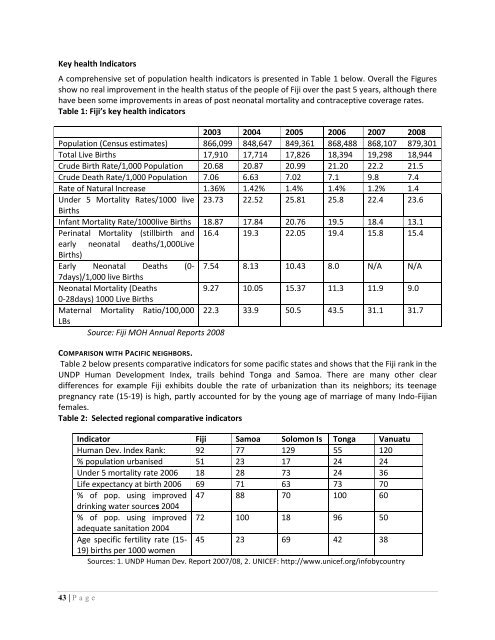
Key health Indicators<br />
A comprehensive set of population health indicators is presented in Table 1 below. Overall the Figures<br />
show no real improvement in the health status of the people of <strong>Fiji</strong> over the past 5 years, although there<br />
have been some improvements in areas of post neonatal mortality and contraceptive coverage rates.<br />
Table 1: <strong>Fiji</strong>’s key health indicators<br />
2003 2004 2005 2006 2007 2008<br />
Population (Census estimates) 866,099 848,647 849,361 868,488 868,107 879,301<br />
Total Live Births 17,910 17,714 17,826 18,394 19,298 18,944<br />
Crude Birth Rate/1,000 Population 20.68 20.87 20.99 21.20 22.2 21.5<br />
Crude Death Rate/1,000 Population 7.06 6.63 7.02 7.1 9.8 7.4<br />
Rate of Natural Increase 1.36% 1.42% 1.4% 1.4% 1.2% 1.4<br />
Under 5 Mortality Rates/1000 live 23.73 22.52 25.81 25.8 22.4 23.6<br />
Births<br />
Infant Mortality Rate/1000live Births 18.87 17.84 20.76 19.5 18.4 13.1<br />
Perinatal Mortality (stillbirth and 16.4 19.3 22.05 19.4 15.8 15.4<br />
early neonatal deaths/1,000Live<br />
Births)<br />
Early Neonatal Deaths (0- 7.54 8.13 10.43 8.0 N/A N/A<br />
7days)/1,000 live Births<br />
Neonatal Mortality (Deaths<br />
9.27 10.05 15.37 11.3 11.9 9.0<br />
0-28days) 1000 Live Births<br />
Maternal Mortality Ratio/100,000 22.3 33.9 50.5 43.5 31.1 31.7<br />
LBs<br />
Source: <strong>Fiji</strong> MOH Annual <strong>Report</strong>s 2008<br />
COMPARISON WITH PACIFIC NEIGHBORS.<br />
Table 2 below presents comparative indicators for some pacific states and shows that the <strong>Fiji</strong> rank in the<br />
UNDP Human Development Index, trails behind Tonga and Samoa. There are many other clear<br />
differences for example <strong>Fiji</strong> exhibits double the rate of urbanization than its neighbors; its teenage<br />
pregnancy rate (15-19) is high, partly accounted for by the young age of marriage of many Indo-<strong>Fiji</strong>an<br />
females.<br />
Table 2: Selected regional comparative indicators<br />
Indicator <strong>Fiji</strong> Samoa Solomon Is Tonga Vanuatu<br />
Human Dev. Index Rank: 92 77 129 55 120<br />
% population urbanised 51 23 17 24 24<br />
Under 5 mortality rate 2006 18 28 73 24 36<br />
Life expectancy at birth 2006 69 71 63 73 70<br />
% of pop. using improved 47 88 70 100 60<br />
drinking water sources 2004<br />
% of pop. using improved 72 100 18 96 50<br />
adequate sanitation 2004<br />
Age specific fertility rate (15- 45 23 69 42 38<br />
19) births per 1000 women<br />
Sources: 1. UNDP Human Dev. <strong>Report</strong> 2007/08, 2. UNICEF: http://www.unicef.org/infobycountry<br />
43 | P a g e